

 PDF
PDF Citation
 Print
Print


INTRODUCTION
According to the 2018 Korea Hypertension Fact Sheet, the number of people in Korea with hypertension in 2016 was 11 million, compared to 7.6 million in 1998.1 The prevalence of high blood pressure (BP), which promotes the development of cardiovascular and cerebrovascular diseases,1 is considerable (around 30% of the Korean population aged ≥ 30 years).2 The World Health Organization reported that 9 million people die annually due to hypertension.3 High BP is a modifiable factor, so early intervention and prevention are important to reduce the burden of disease.
Although the prevalence of pediatric hypertension is low (< 5%),4 it is reportedly associated with chronic diseases in later life,567 so monitoring of the BP of children is important. A recent study that used data from the Bogalusa Heart Study, which involved a 36-year follow-up, reported that children with elevated BP and hypertension had 45% and 66% higher risks, respectively, of developing hypertension as adults compared to normotensive children.5 In addition, elevated BP during childhood is associated with risk for metabolic syndrome and left ventricular hypertrophy in later life.5 A systematic meta-analysis reported a strong correlation of childhood and adult BP across a diverse population.6 Therefore, to prevent hypertension in adulthood it is necessary to maintain normal BP from early childhood, monitor BP regularly, and initiate interventions when required. In 2017, the American Academy of Pediatrics (AAP) published new guidelines for the screening and management of high BP in children and adolescents. Those guidelines recommend routine BP measurement beginning at 3 years of age and that monitoring of the BP of children with low birth weight, premature birth, or congenital heart disease should begin measuring earlier than 3 years of age.89 National BP reference values for Korean children and adolescents were published in 2007 but do not apply to children less than 7 years old.10 Improved Korean Children and Adolescent National Growth Charts were also published in 2017, but did not include BP charts. Although there are BP reference values for children in the United States and Europe,911 these may not be applicable to Korean children. In addition, differences in the relationship between body size and BP according to ethnicity have been reported.1213
Using data from the Ewha Birth and Growth Cohort Study, we developed sex-, age-, and height-specific BP reference values for children aged 3–9 years. Current reference values used to determine cutoff values for identifying children with elevated BP with high sensitivity are typically based on data from non-overweight children.911 Therefore, we created a BP reference curve for non-overweight children.
METHODS
Study subjects
This study used data from the Ewha Birth and Growth Cohort Study, a longitudinal birth cohort established at Mokdong Hospital, Ewha Womans University, Seoul, Korea, from 2001 to 2006 (baseline n = 940). This cohort was established for the purpose of identifying risk and preventive factors related to growth and disease susceptibility. Beginning in 2005, the subjects underwent follow-up evaluations at 3 and 5 years of age, and annually after the age of 7 years. On average, about half of the subjects were contacted and three-quarters participated in the follow-up program. Detailed information on the cohort composition and methodology has been reported elsewhere.1415 Of the subjects, 471, 400, 364, 382, and 400 aged 3, 5, 7, 8, and 9 years, respectively, participated in the follow-up program. We excluded subjects with missing data for height or BP. Accordingly, complete data were available for 453, 391, 361, 380, and 390 subjects aged 3, 5, 7, 8, and 9 years, respectively. We excluded overweight and obese subjects (body mass index [BMI] ≥ 85th percentile based on the 2007 Korean Children and Adolescent National Growth Charts). The proportions of those who were overweight or obese at 3, 5, 7, 8, and 9 years of age were 7.3, 13.0, 11.1, 14.6, and 14.4%, respectively (boys, 12.9% and girls, 11.0%). Thus, the data for 416, 340, 321, 323, and 332 subjects aged 3, 5, 7, 8, and 9 years, respectively, were analyzed. Of these, 26.9, 17.4, 8.7, 9.6, and 13.0% of the subjects were born preterm at each age, respectively.
Measurements
When subjects visited the hospital for follow-up, their anthropometric measurements and BP were evaluated by trained researchers. Height and weight were measured with no shoes while wearing light clothing using a stadiometer and a calibrated scale (DS-102; Dong Sahn Jenix Co. Ltd., Seoul, Korea). BMI was calculated as weight divided by height in meters squared. The sex- and age-specific z-scores of height, weight, and BMI were calculated based on the 2007 Korean Children and Adolescent National Growth Charts.10
Systolic blood pressure (SBP) and diastolic blood pressure (DBP) were measured twice using an automated instrument (Dinamap Procare 200; GE Inc., Milwaukee, WI, USA) with the correct cuff size with the subject in a stable position. The correct cuff size was determined based on the circumference of the upper arm. Two measurements, taken within 5 minutes of each other, were averaged. Generally, a BP between the 90th and 94th percentiles in children is considered prehypertension and a BP ≥ 95th percentile is considered hypertension.16 In this study, children with an average SBP or DBP ≥ 90th percentile or > 120/80 mmHg were defined as having elevated BP.
Statistical analyses
Using the generalized additive model for location, scale, and shape (GAMLSS) package in R software (ver. 3.5.0 for Microsoft Windows™; R Foundation, Vienna, Austria),17 we generated a BP percentile curve for non-overweight children, stratified by sex and age. The GAMLSS method is an extension of the Lambda-Mu-Sigma (LMS) method for modeling the distribution of the outcome of interest depending on multiple covariates, while accounting for the dispersion, skew, and kurtosis of the distribution.18 We evaluated various distribution models (e.g., Box-Cox Cole-Green, Box-Cox power exponential, and Box-Cox t) to choose the best one. Goodness of fit was assessed using the generalized Akaike information criterion and by generating Q-Q plots. Based on the selected model, the reference 50th, 90th, and 95th percentile values of BP for boys and girls were estimated for the 5th, 10th, 25th, 50th, 75th, 90th, and 95th percentiles of height for age.
Based on the definition of prehypertension, the 90th percentile of BP was compared to that in the 2017 Pediatric Hypertension Guidelines of the AAP,9 the Identification and Prevention of Dietary- and Lifestyle-Induced Health Effects in Children and Infants (IDEFICS) study in Europe,11 the international BP reference values from a multinational study,19 and the national growth chart released in 2007 by the Korea Centers for Disease Control and Prevention (KCDC).10
RESULTS
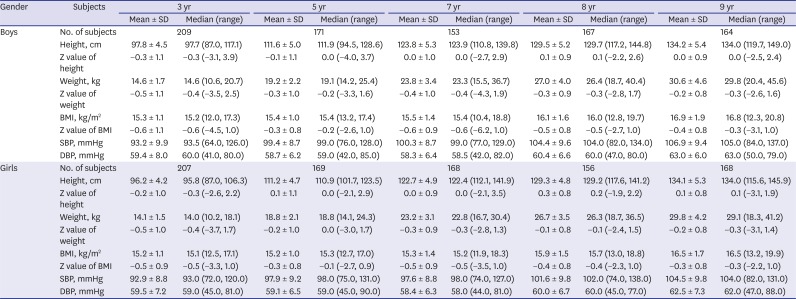
The characteristics of the subjects are listed in Table 1. Among non-overweight children (n = 416, 340, 321, 323, and 332 subjects aged 3, 5, 7, 8, and 9 years, respectively), the sex ratio was close to 1.0 (boys, 49.9% and girls, 50.1%). Compared with the anthropometric measurements of all Korean children (presented as z-scores), the heights of children aged 3 years tended to be slightly lower (boys, –0.3 ± 1.1 standard deviation [SD]; girls, –0.2 ± 1.0 SD), while those of children of other ages were similar.
Table 1
Characteristics of the study subjects with non-overweight children
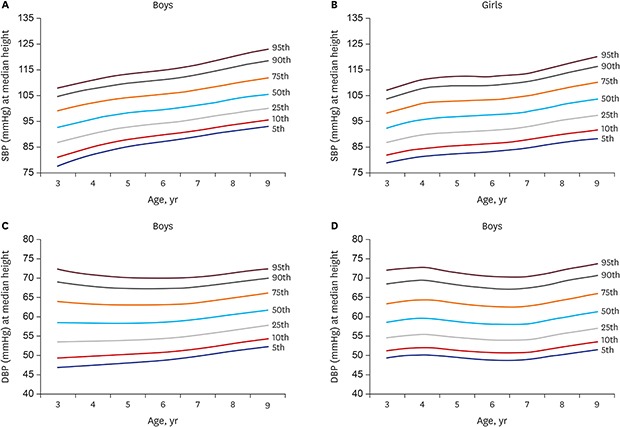
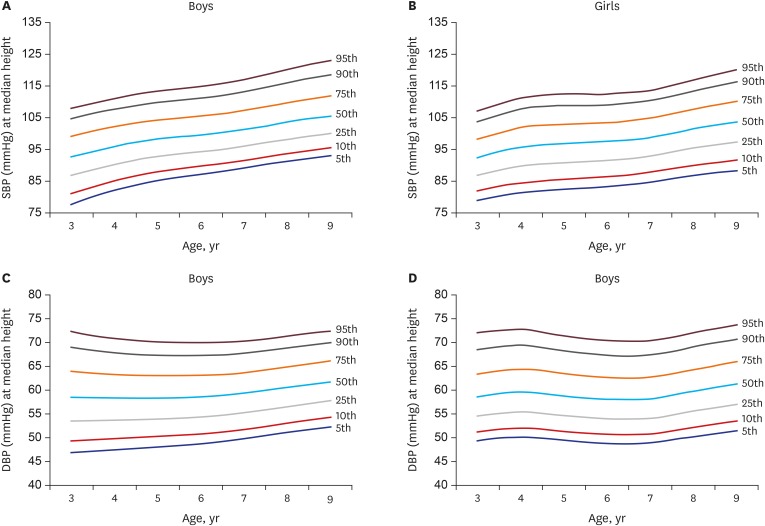
The 50th, 90th, and 95th percentiles for SBP and DBP were calculated according to the percentile of height for age of boys and girls (Tables 2 and 3, respectively). For non-overweight children, the best-fit model for the SBP and DBP of boys was the log-linked versions of BCCG (Table 2), and that for girls was the BCCG model (Table 3). Overall, BP percentiles tended to be higher in boys than in girls at any age (Tables 2 and 3), and BP for height tended to be lower in non-overweight children than in all children (including overweight and obese children) (data not shown). Fig. 1 shows the sex- and age-specific BP percentiles (5th, 10th, 25th, 50th, 75th, 90th, and 95th) at median height of non-overweight children. In both boys and girls, the gradual increase in SBP with age was more pronounced than that in DBP.
Table 2
BP distribution by percentiles in non-overweight boys < 10 years old
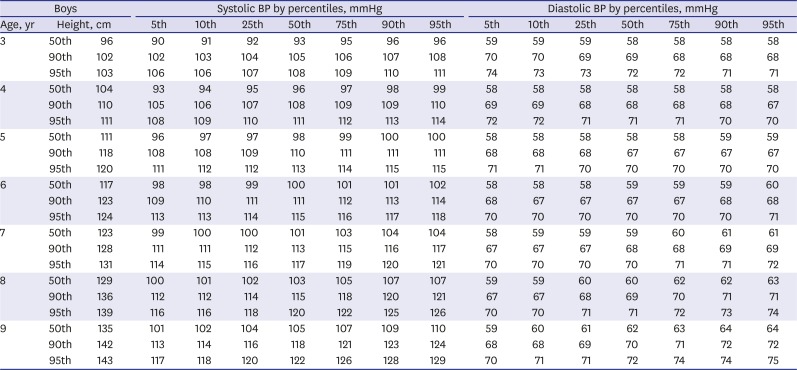
Table 3
BP distribution by percentiles in non-overweight girls < 10 years old
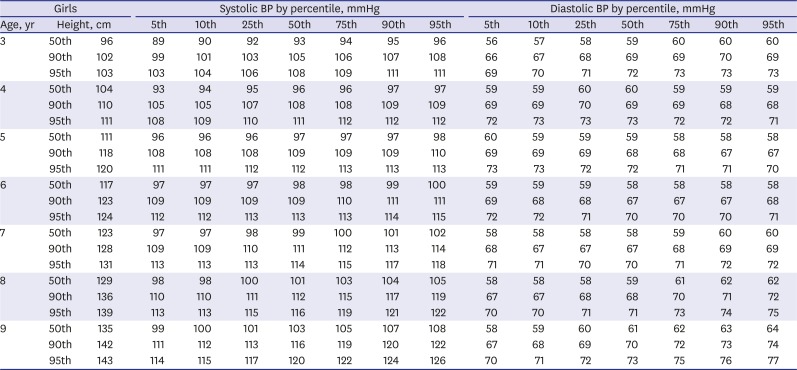
Fig. 1
BP percentiles at median height for age in non-overweight boys and girls. (A) SBP for boys, (B) SBP for girls, (C) DBP for boys, and (D) DBP for girls.
BP = blood pressure, SBP = systolic blood pressure, DBP = diastolic blood pressure.
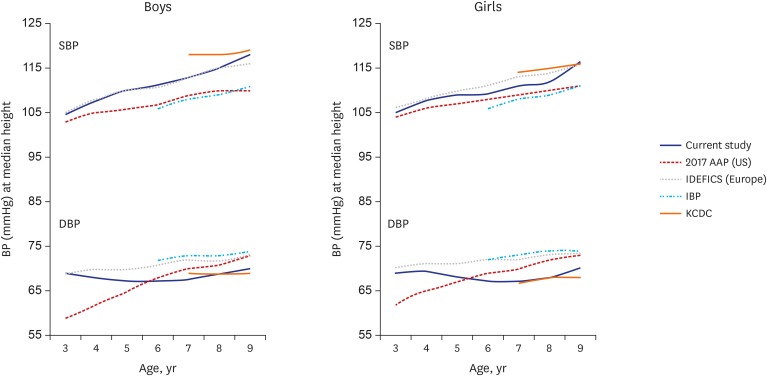
The reference values for 90th percentile of BP by sex at median (i.e., 50th percentile) height for age from the US (2017 AAP guidelines), Europe (IDEFICS study), a multinational study, and the KCDC are shown in Fig. 2. The aforementioned multinational study reported the lowest 90th percentile SBP value, and our findings were most similar to those of the European IDEFICS study. The DBP values were higher than the US reference values for children < 6 years old, but that trend was reversed in older children. The reference SBP value of the KCDC was higher than that in the current study while the reference DBP value was similar.
Fig. 2
Comparison of the 90th percentile BP values in prior reports and the current study. BP values are for the median height for age.
BP = blood pressure, SBP = systolic blood pressure, DBP = diastolic blood pressure, AAP = American Academy of Pediatrics, IDEFICS = Identification and Prevention of Dietary- and Lifestyle-Induced Health Effects in Children and Infants, IBP = international blood pressure derived from a multinational data, KCDC = Korean Center for Disease Control and Prevention.
Based on our reference values, 18.5% of children 3 to 9 years old had an elevated BP (boys, 19.5% and girls, 17.5%). Among children 7–9 years old, 17.7% had an elevated BP (boys, 19.2% and girls, 16.1%), which is similar to the proportion determined using the KCDC reference values (total, 18.4%; boys, 18.6%; and girls, 18.1%) (data not shown).
DISCUSSION
We propose sex-, age-, and height-specific BP reference values for children aged 3–9 years using data from the Ewha Birth and Growth Cohort Study. To the best of our knowledge, this study is the first to propose BP reference values for children aged 3–9 years in Korea using the data of non-overweight children.
The life-course approach to the prevention of chronic disease has led to an emphasis on the need for early intervention for risk factors during childhood. Although there is insufficient evidence of the benefit of screening for elevated BP among children,7 the American Heart Association and the European Society of Hypertension recommend routine BP measurement in children older than 3 years in a medical setting.820 To determine cutoff BP values for identifying children with elevated BP with greater sensitivity, BP reference values for non-overweight children were recently proposed.11192122 Pediatric BP is closely related to anthropometric measurements and the reference BP is typically based on height rather than weight. This may be because the relationship between changes in BP and in weight is, at least in part, a consequence of a physiopathological process.11 Indeed, BMI, which is closely correlated with weight, is an independent predictor of hypertension in children and in adults. 1123 In the same context, the BP reference values in the fourth report of the National High Blood Pressure Education Program Working Group on High Blood Pressure in Children and Adolescents in 2004 were in 2017 updated based on the normative BP values for non-overweight children.9
A study by Sohn et al.24 reported the BP percentiles according to sex, age, and height of children under 6 years of age, but overweight and obese children were included in the analyses. Compared to our values for children aged 3–6 years, the SBP reference values in that study were 6–9 mmHg higher in boys and 3–8 mmHg higher in girls. A multinational study of non-overweight children, including Korean teenagers, proposed BP reference values only for those aged 6–17 years.19 Compared to the national reference values of the KCDC, the 90th percentile of SBP at ages 7–9 years in our study was lower, and that of the DBP was similar. The cutoff values proposed in this study result in more boys than girls with high BP compared to those based on the national reference values of the KCDC. However, the national reference values were developed based in part on data from overweight and obese children. When the data for overweight and obese children were included, the BP reference values also increased in this study, but were lower than those of the KCDC. The difference may be due to the different statistical analysis methods used. The GAMLSS method is more flexible than the LMS method in terms of applying various distributions of the outcome of interest.18 It is also able to incorporate a larger number of covariates to maximize the model fit. Because of these advantages, several studies have proposed BP reference values using the GAMLSS method.111921 Furthermore, the BP data in this study were obtained using the same instrument as the national reference values of the KCDC,25 but there was bias caused by operator and measurement time.
The 90th percentiles of SBP for boys and girls were similar to the BP reference values for children younger than 7 years derived from the European IDEFICS study. The US DBP reference values of boys and girls are lower than those in this study for children aged < 6 years, and vice versa for older children. The US BP reference values are based on auscultatory measurements, and oscillometric devices systematically overestimate BP compared to the values determined by auscultation.926 In addition, the median height for age differs among countries, and European children have a high median height for age. Although controversial, differences in the relationship between body size and BP according to ethnicity have been reported.1213 Therefore, it would be appropriate to develop and use population-based BP reference values to screen high-risk groups.21
Because the BP reference values were obtained from a statistical distribution rather than based on their associations with disease, they cannot be directly applied for diagnostic purposes. Thus, our results enable the identification of children who require BP monitoring, but are unsuitable as cutoff values for diagnostic purposes. Considering the variation in BP, multiple measurements are needed to diagnose hypertension. Identification of high-risk children with an elevated BP would enable early interventions, such as improvement of the diet or promotion of physical activity, to prevent hypertension in adulthood. A high BMI is an independent risk factor for hypertension, and in this study 39.6% (boys, 40.6% and girls, 38.3%) of overweight and obese children had an elevated BP, a higher frequency than that in normal-weight children (total, 15.7%; boys, 16.4%; and girls, 15.0%). Thus, it is important for overweight and obese children to return to a normal weight.
This study had several limitations. The sample was small and not representative of the Korean population, limiting the generalizability of the results. The cohort was established in a tertiary hospital, so the percentage of children with low birth weight or preterm birth was higher than in the general population. This may have influenced the results because the risk for high BP increases with the degree of immaturity at birth.27 Considering the increasing number of low-birth-weight births, this factor should be considered in future studies. In addition, we did not assess external validity, and so further research is needed. The trends in body size among Korean children and adolescents have slowed, but the average height of children in the 2016–2017 Korea National Health and Nutrition Examination Survey was increased compared to that in the 2005 survey by the Korean Pediatric Society28; indeed, the average height of children aged 3–6 years has recently increased by 2–5 cm (data not shown). Therefore, by reflecting the current body size of children, it is necessary to develop the normal ranges of BP for Korean children of all ages. Finally, regarding the accuracy of the device, the device used in this study can measure BP in children and adolescents, but was not sufficiently accurate to recommend for measuring DBP.29 Therefore, it is not interchangeable with auscultatory measurements, so care must be taken when interpreting BP measurements. In addition, the intraclass correlation coefficient (ICC) values of intra-observer variability were 0.877 (95% confidence interval [CI], 0.833–0.906) for SBP and 0.767 (95% CI, 0.743–0.789) for DBP, while the ICC values of inter-observer variability could not be estimated. However, by minimizing the observer bias, which is an advantage of the oscillometric method, the issue of observer variability is not critical in the BP measurements.
In summary, we determined BP reference values for non-overweight children using an advanced statistical method. Routine BP measurement should begin at an early age, but there were no BP reference values for children under 7 years old in Korea; our findings bridge that gap in knowledge.
 XML Download