

 PDF
PDF ePub
ePub Citation
 Print
Print


INTRODUCTION
Diabetes mellitus is a common chronic disease and has multiple complications, which contribute to the global health-care burden. Diabetes is the seventh leading cause of death in the United States. The International Diabetes Federation has predicted that the number of people with diabetes worldwide will increase by 50%, from 366 million in 2011, by 2030 [1]. This increase in diabetes prevalence is presumably the result of population aging, increasing prevalence of obesity, and longer survival of people with diabetes [2].
Diabetes is characterized by the chronic hyperglycemia-induced triad of symptoms (polydipsia, polyuria, and polyphagia) caused by elevated blood glucose level and metabolic dysregulation. Untreated diabetes leads to multiorgan and systemic injury, including to the heart, kidneys, nerves, and blood vessels, which impair the quality of life and increase the death rate caused by diabetes complications [3]. Some of these complications play a well-defined role in increasing the mortality of people with diabetes. For instance, people with diabetes have a twofold increased risk for cardiovascular mortality [4]. Diabetes also increases the risk of chronic kidney disease (affects 30% to 40% of individuals with diabetes) which is a major predictor of long-term mortality [5]. Whether diabetes can contribute to mortality caused by other major types of diseases, such as cancer and Alzheimer's disease (AD), remains a topic of debate because of limited epidemiological evidence. We investigated this issue using National Health and Nutrition Examination Survey (NHANES) 1999 to 2010 and its publicly available linked mortality file (LMF). Here, we report the associations between diabetes and mortality due to eight underlying causes of death, including cardiovascular disease (CVD), cancer, chronic lower respiratory disease (CLRD), accidents, cerebrovascular disease (CeVD), AD, influenza and pneumonia, and kidney disease.
METHODS
Study population
As a nationwide complex survey, NHANES collects health and nutrition data from the noninstitutional civilian United States population. Continuous NHANES data have been released by the National Center for Health Statistics (NCHS) every 2 years for public use since 1999. NHANES has been approved by the National Health Statistics Institutional Review Board. The current study used data from six NHANES survey cycles (1999 to 2010) as well as the publicly available NHANES (1999 to 2010) LMF to identify possible associations between diabetes status and mortality due to various causes, including CVD, cancer, CLRD, accidents, CeVD, AD, influenza and pneumonia, and kidney disease. National Death Index death certificate records were linked with NHANES LMF to identify the leading causes of death.
This study was restricted to participants aged ≥40 years at the baseline. Of the 19,968 participants aged ≥40 years, 18,588 (93.1%) had information about diabetes status at the time of examination. We excluded 3,075 participants who had inadequate information of follow-up or other variables, which yielded a final population of 15,513 participants in this study (Supplementary Fig. 1). The median follow-up was 66 months and 2,042 all-cause deaths were recorded during follow-up.
Diabetes is generally divided into type 1 (insufficient insulin production) and type 2 (insulin resistance), where type 2 diabetes mellitus represents the most prevalent type. Most of the 2,396 diabetic participants in the current study had type 2 diabetes mellitus and only 98 (4.09%) had been diagnosed with type 1 diabetes mellitus using the criteria diabetes diagnosis before age 40 years and currently using only insulin [6]. Seventeen participants (0.71%) could not be categorized because of insufficient information. The results of the analyses were essentially the same when excluding the 115 type 1 diabetes mellitus/uncategorized participants from the population; therefore, they were included in the study. However, given that a higher percentage of diabetic participants had type 2 diabetes mellitus, the study results represented mainly that type of diabetes.
Cause-specific mortality
Deaths due to numerous causes were identified according to the leading causes of death included in the publicly available NHANES LMF, which are based on the International Statistical Classification of Diseases, Injuries, and Causes of Death (ICD-10) guidelines. The nine leading causes of death are consistent with the following ICD-10 codes: CVD (I00–I09, I11, I13, I20–I51), cancer (C00–C97), CLRD (J40–J47), accidents (V01–X59, Y85–Y86), CeVD (I60–I69), AD (G30), influenza and pneumonia (J09–J18), and kidney disease (N00–N07, N17–N19, N25–N27). Participants with no record of death were deemed as alive and were censored at the end of follow-up (December 31, 2011). For the analysis of specific cause-related mortality, follow-up participants with other leading causes of death were censored at the age of death.
Diagnosed diabetes category and diabetes status
Diagnosed diabetes was categorized as yes or no based on the question, “Have you ever been told by a doctor or health professional that you have diabetes or sugar diabetes?” Diabetes status was based on the category of diagnosed diabetes and blood glycosylated hemoglobin (HbA1c) level, and was defined as diabetes (with diagnosed diabetes or HbA1c ≥6.5%), prediabetes (without diagnosed diabetes and HbA1c 5.7% to 6.4%) or no diabetes (without diagnosed diabetes and HbA1c <5.7%). To measure blood HbA1c level, three instruments from two laboratories were used during 1999 to 2010. For NHANES 1999 to 2004, HbA1c level was measured at the University of Missouri in Columbia using a Primus CLC330 analyzer (Primus Corp., Kansas City, MO, USA). For NHANES 2005 to 2006 and 2007 to 2010, HbA1c levels were measured at the University of Minnesota using Tosoh A1C 2.2 Plus (Tosoh Medics, San Francisco, CA, USA) and Tosoh A1C G7, respectively. Cross-over studies for laboratory method were performed each time when changing instruments. The detailed methodology can be found in the NHANES Laboratory Procedures Manual. Population-attributable risk percentage (PAR%) for diabetes at the baseline was calculated for cause-specific mortality using the following equation:
where P refers to the prevalence of sampled persons with diagnosed diabetes and HR is the hazard ratio calculated using the Cox proportional-hazards model.
Other variables
The associations between diagnosed diabetes/diabetes status and all-cause/cause-specific mortality were adjusted for a series of potential confounding factors: sex (male or female); age in years at the baseline examination (40 to 49, 50 to 59, 60 to 69, or ≥70 years); race (non-Hispanic white, non-Hispanic black, or others); educational level (less than high school, high school, or more than high school); poverty income ratio (PIR; <1, ≤1 and less than the median, or greater than the median, where the medians was computed based on PIR ≥1 for each of the six data cycles); body mass index (BMI; <25 or ≥25 kg/m2, where BMI ≥25 kg/m2 indicates overweight based on the National Institutes of Health's health guidelines); smoking status (yes or no, based on the question, “Have you smoked at least 100 cigarettes in your entire life?”); alcohol use (yes or no, based on the question, “In any 1 year, have you had at least 12 drinks of any type of alcoholic beverage?”); hypertension status (yes or no, based on the question, “Have you ever been told by a doctor or other health professional that you had hypertension, also called high blood pressure?”); and physical activity (yes or no; participants reporting any vigorous or moderate activities were considered active).
Statistical analysis
Sample weighting was used to account for the complex sampling design following the NHANES Analytic and Reporting Guidelines. The weighted characteristics were calculated based on the overall data, and data were stratified by the diagnosed diabetes category (yes or no) and diabetes status (diabetes, prediabetes, no diabetes). Possible statistical differences for variables were examined using the Rao-Scott chi-square test. The association between diagnosed diabetes/diabetes status and cause-specific death rate was studied using Cox proportional-hazards regression using the “proportional hazards regression (PHREG)” procedure. The HR and 95% confidence interval for the risk of all-cause or specific cause-related mortality for diabetic participants were calculated by comparing with the population without diabetes. Ptrend was also calculated for diabetes status categories. In the adjusted hazard model, age was used as a continuous variable for confounder adjustments. In analyses of all-cause and each of the eight cause-specific mortalities, the proportional-hazards assumption for diagnosed diabetes category and diabetes status was verified using the Kolmogorov-type supremum test. Directly adjusted Kaplan-Meyer curves were plotted using the “direct adjusted (DIRADJ)” option in SAS software version 9.4 (SAS Institute, Cary, NC, USA) and SAS was used for all statistical analyses.
Ethics approval and consent to participate
Data analysed in this study were obtained from NHANES. Protocols involved were approved by the NCHS Research Ethics Review Board (ERB) (protocol #98-12 and #2005-06), and consent from all participants was documented.
Availability of data and material
The data used in this study is from NHANES 1999 to 2010 and corresponding mortality follow-up study. Data are publicly available and can be downloaded from NHANES website: http://www.cdc.gov/nchs/nhanes.htm.
RESULTS
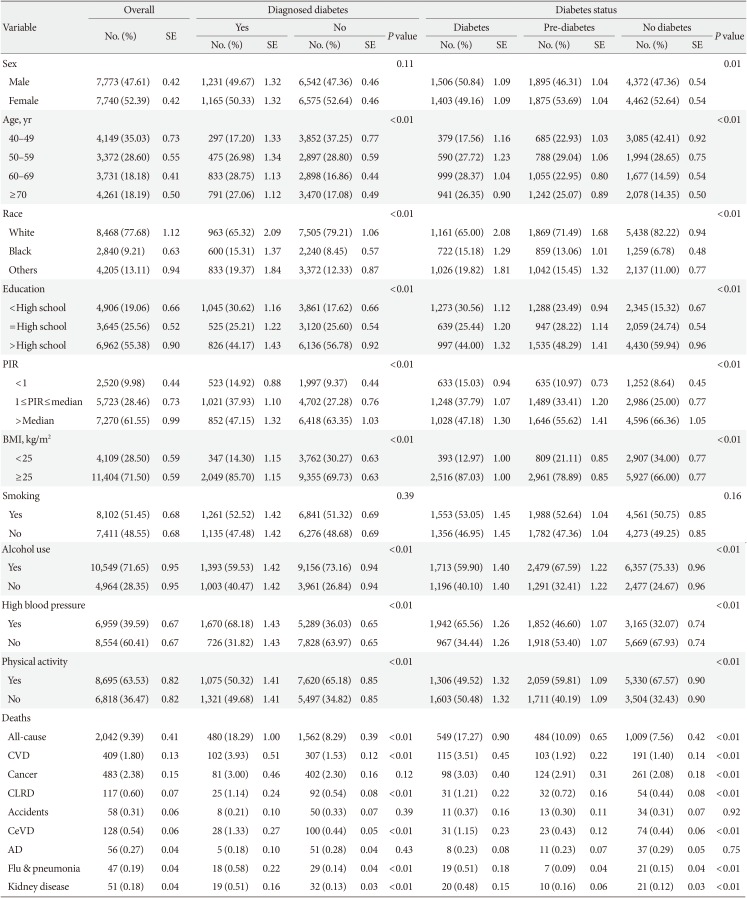
The demographic data for the overall study population and subpopulations according to diagnosed diabetes category or diabetes status are shown in Table 1. The sample sizes were 2,396 and 13,117 for the diagnosed diabetes categories yes and no, respectively. For diabetes status, the sample sizes were 2,909, 3,770, and 8,834 for diabetes, prediabetes, and no diabetes, respectively. Compared with the subpopulation without diabetes, diabetic participants were more likely to be men, ≥60 years old, of non-White ethnicity, with less than a high school education, with income below the median, to have a BMI ≥25 km/m2, to have a history of hypertension, and to be physically inactive. Participants with diabetes also tended to have higher all-cause mortality and mortality due to CVD, cancer, CLRD, CeVD, influenza and pneumonia, and kidney disease. All-cause and cause-specific mortality rate was calculated according to the glycemic control status and duration of diabetes in diabetic participants (Supplementary Tables 1 and 2).
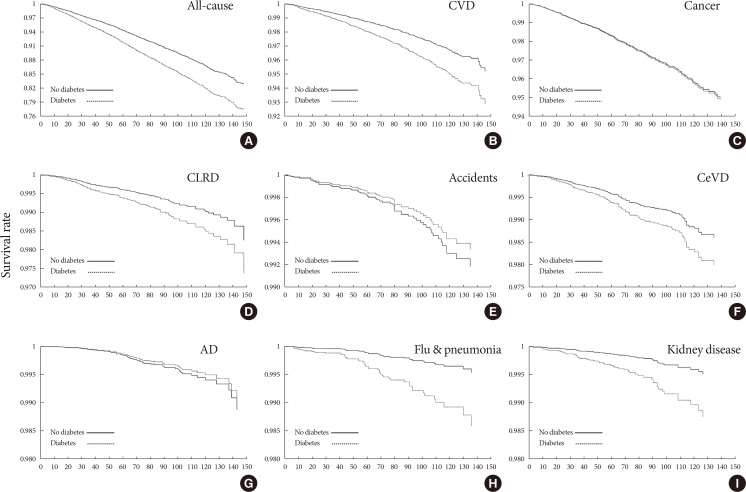
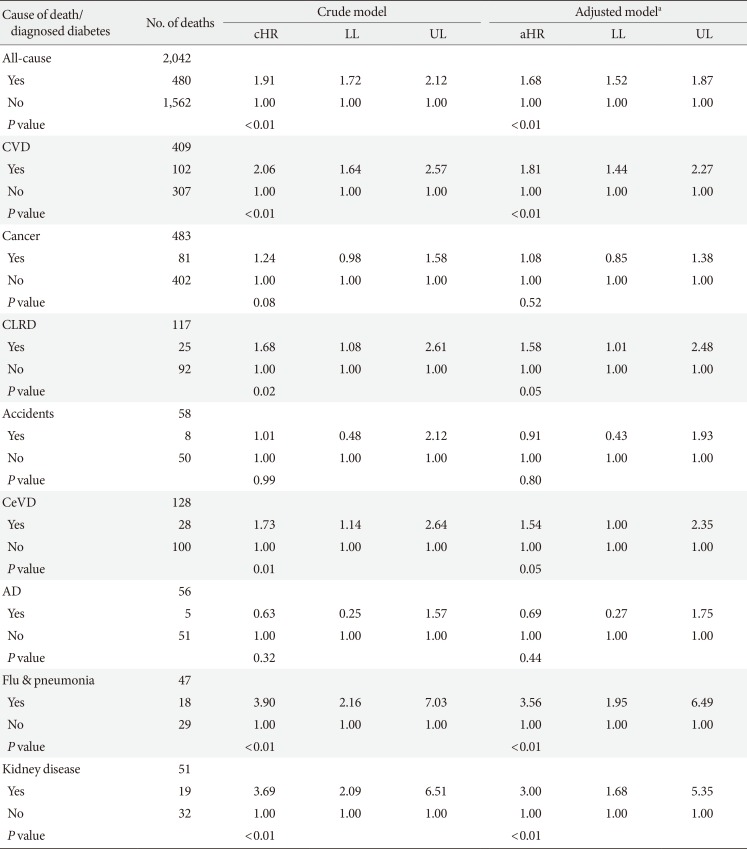
HRs from the Cox proportional-hazard models for all-cause and eight cause-specific mortalities were calculated using the diagnosed diabetes category (yes or no) as an independent variable (Table 2). All-cause mortality and mortality due to CVD, CLRD, CeVD, influenza and pneumonia, and kidney disease were consistently associated with diagnosed diabetes both before and after multivariable adjustment. However, these associations were not significant for mortality related to cancer, accidents, or AD. Sex-stratified analysis suggested that baseline diabetes was associated with mortality due to CeVD in men, but not women after adjusting for potential confounders (Supplementary Table 3). Information on history of cancer, CVD, CeVD, and lung disease at the baseline are shown in Supplementary Table 4, and the results from the Cox model after adjusting for the abovementioned major types of disease at the baseline as confounding variables are shown in Supplementary Table 5. Adjusting for the NHANES data cycle in the Cox proportional-hazards model produced similar results (Supplementary Table 6). As an important indicator of public health impact, PAR represents the proportion of cause-specific mortality that could be attributed to baseline diabetes. Compared with nondiabetic participants, the PAR% values for those with diagnosed diabetes for all-cause mortality and mortality related to CVD, CLRD, CeVD, influenza and pneumonia, and kidney disease were 7.00%, 8.23%, 6.04%, 5.64%, 22.09%, and 18.14%, respectively. However, we note that the diabetes prevalence rate used to calculate PAR% was derived from the population in the present study rather than the community. Kaplan-Meier curves for diagnosed diabetes category were used to estimate 10-year survival (Fig. 1).
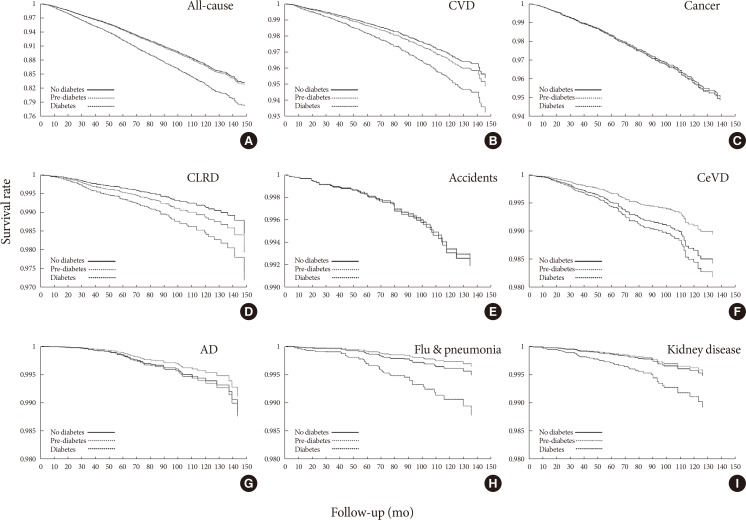
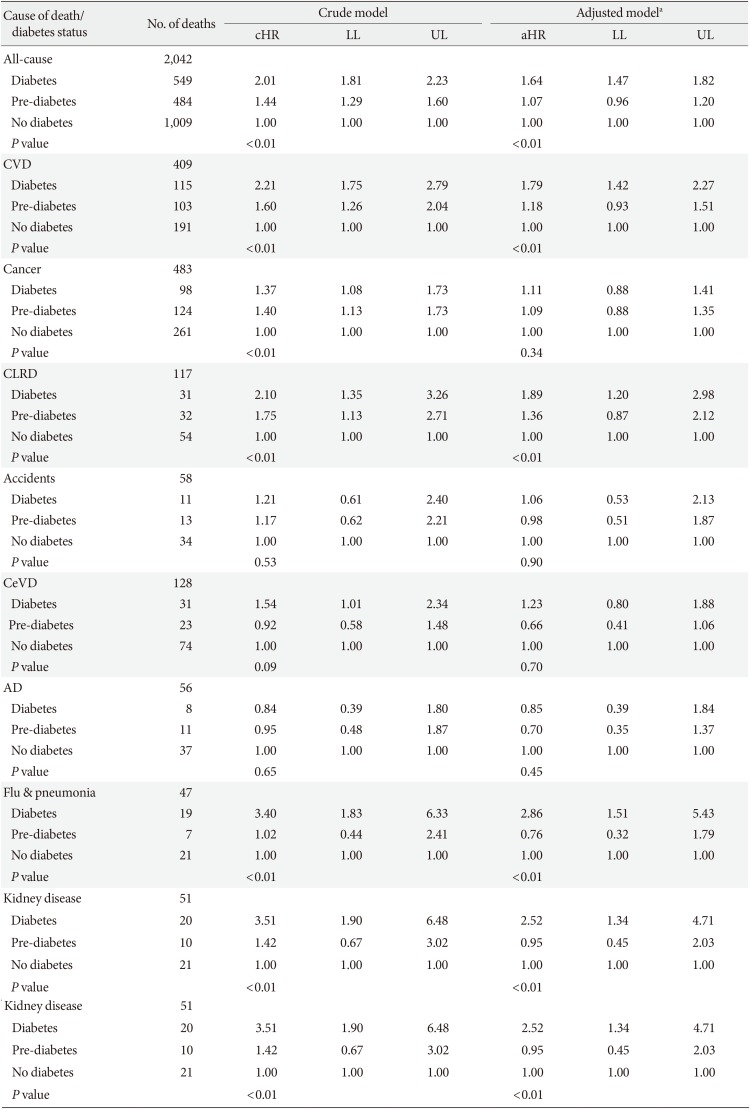
The HRs for all-cause and eight cause-specific mortalities are presented in Table 3; diabetes status (diabetes, prediabetes, no diabetes) was set as an independent variable. Trend analysis indicated that diabetes status was significantly associated with all-cause mortality and mortality related to CVD, CLRD, influenza and pneumonia, and kidney disease. The association between diabetes status and cancer- or CeVD-specific mortality was nonsignificant after adjusting for covariates, and no such association was found for accident- and AD-related mortality. Kaplan-Meier survival curves for diabetes status are shown in Fig. 2.
DISCUSSION
In the present study, we analyzed data from six NHANES survey cycles (1999 to 2010) and the mortality follow-up data to identify associations between diabetes and mortality due to specific causes. Our findings provide epidemiological evidence that diabetes contributes to mortality due to major types of diseases. According to studies published in the 1990s, the life expectancy of people with diabetes is generally 7.5 years less than that of nondiabetic people and this life-shortening effect of diabetes is greater in people who develop diabetes at a younger age [7]. Our analysis showed a 10% higher all-cause mortality in the diabetic subpopulation compared with the nondiabetic subpopulation. Moreover, the percent of diabetic participants with a lower level of education (30.62%) or PIR (14.92%) was higher than those of non-diabetic participants (17.62% or 9.37%, respectively). Mortality rates among people with diabetes also vary according to individual income and educational level [8]. Our analysis showed that adults with diagnosed diabetes were more likely to have a BMI >25 kg/m2 compared with nondiabetic participants (85.70% and 69.73%, respectively), which is consistent with the National Health Interview Survey data (2000 to 2009), indicating that obesity correlates positively with the occurrence of diabetes [9]. Given that hypertension is a common risk factor for diseases such as peripheral arterial disease [10], we included high blood pressure status as a confounder in our analysis. The weighted percentage of participants with hypertension was much higher in the diabetic than in the nondiabetic subpopulation (68.18% and 36.03%, respectively) and shows the high rate of co-occurrence of these two diseases. People with diabetes are also more likely to be physically inactive [10], and behavioral intervention strategies have been implemented to help people with diabetes maintain a physically active lifestyle [11]. Similarly, our analysis showed that diabetic participants were 14.86% less likely to be physically active.
CVD is a known complication of diabetes. A mechanistic study in diabetic rats showed that cardiac function changes gradually during the progression of diabetes and that these changes are closely related to alterations in two groups of proteins, neurotrophic cascade protein (NTF4) and electron transport chain cascade protein (ETFB) [12]. Several epidemiological studies have investigated the elevated mortality rate due to CVD in people with diabetes. Evidence from the Cardiovascular Prevention from Observational Cohorts in JAPAN (EPOCH-JAPAN) study showed that diabetes is a significant risk factor for all-cause and CVD-specific mortality and is associated with a two- to four-fold increased risk of cardiovascular death [4]. Seventy percent of diabetes-related mortality is attributed to CVD [13]. Given this high death rate, the use of prognostic factors, such as serum 25-hydroxyvitamin D3 (25(OH)D3), has been proposed for CVD prevention in diabetic patients [14]. Our data indicated a 1.81-fold elevated CVD mortality risk in participants with diagnosed diabetes, and the trend analysis indicated that diabetes status (no diabetes, prediabetes, and diabetes) was significantly (Ptrend<0.01) associated with CVD-specific mortality.
According to the publicly available NHANES LMF, as an underlying cause of death, CLRD comprises mainly chronic bronchitis, emphysema, and asthma. Characterized by long-term breathing problems and poor airflow, chronic obstructive pulmonary disease (COPD) represents a severe respiratory disease, and chronic bronchitis and emphysema are the most common forms of COPD. A retrospective longitudinal cohort study in northern California reported a significantly higher incidence of COPD in people diagnosed with diabetes [15]. Diabetic people are more sensitive to complicated lower respiratory tract infections, and a nearly half of them develop emphysema or asthma as a frequent comorbidity [16]. Respiratory function tests confirm the adverse effects of diabetes on the respiratory system [17], which may reflect pathological changes observed in the diabetic lung, such as vascular hyalinosis and septal degeneration [17]. Similar to people with COPD, diabetic people also have a higher prevalence of asthma [18]. This evidence suggests that diabetic people are a high-risk population for CLRD-mediated morbidity and mortality. Our analyses showed an association between diabetes and CLRD mortality (P=0.05) when using diabetes as a dichotomous variable (Table 2). Trend analysis for diabetes status showed significant results (Ptrend<0.01), and the adjusted HRs for participants with prediabetes and diabetes were 1.36 and 1.89, respectively, compared with those without diabetes as the reference (Table 3).
Seasonal influenza is a global health burden among the general population and increases the risk of mortality in winter. Adults with diabetes are at high risk for influenza-mediated morbidity and mortality [19]. People with diabetes are also more likely to have an impaired immune response to influenza vaccine and are thus more sensitive to influenza-related complications [19]. Dysfunction of the immune system in diabetic people may be attributed to an abnormal CD4/CD8 lymphocyte ratio and malfunction of natural killer cells and monocytes [20]. Epidemiological studies suggest that people with diabetes, especially those with cardiac and renal complications, are at high risk of death due to influenza and pneumococcal disease [20]. Analysis of Canadian administrative data showed greater susceptibility to influenza in adults with diabetes and a 6% higher rate of influenza-attributable all-cause hospitalization in diabetic people of working age (aged <65 years) [21]. Similar as for influenza, analyses of 97 prospective studies revealed a higher risk for mortality due to pneumonia and other infectious diseases (1.67- and 2.39-fold, respectively) [22]. Moreover, an observational study of a prospective cohort of immunocompetent adults with community-acquired pneumonia reported different clinical features between pneumonia patients with and without diabetes. This study also reported that additional risk factors for mortality, such as bacteremia and septic shock, are found in patients with both pneumonia and diabetes [23]. In that study, patients with diabetes generally had more severe pneumonia compared with nondiabetic patients [23], which may lead to an elevated death rate in people with diabetes. Consistent with this evidence, we found a 3.56-fold elevated risk for influenza and pneumonia-specific mortality in participants with diagnosed diabetes after adjustment for confounders.
Diabetes is a known risk factor for CeVD, and CeVD represents one of the leading causes of morbidity and mortality in people with diabetes. Adjusted models in the Cox proportional-hazards regression analysis of the diagnosed diabetes category (Table 2) revealed a significant association between baseline diabetes and CeVD mortality (P=0.05). Trend analysis suggested that the association between diabetes status (diabetes, prediabetes, no diabetes) and mortality due to CeVD was nonsignificant (Table 3), which is presumably because prediabetes or less severe diabetes is not associated with vascular pathology in the brain as revealed by magnetic resonance imaging [24]. Moreover, our sex-stratified analysis suggested that baseline diabetes was associated with mortality due to CeVD in men, but not in women (Supplementary Table 3), which may also have contributed to the overall weak association between diabetes and CeVD-specific mortality.
Kidney disease, as defined by increased urine albumin excretion and/or impaired glomerular filtration rate, is a known complication of diabetes. Ten-year cumulative mortality analysis using NHANES III (1988 to 1994) data revealed that kidney disease contributes predominantly to the elevated mortality in diabetic people [25]. A population-based case-control study concluded that high HbA1c level may contribute to deteriorating kidney function and may thereby increase mortality due to kidney disease [2]. An animal model suggested that upregulation of the release of proinflammatory cytokines and transforming growth factor-β1 signaling may be the mechanisms underlying diabetic nephropathy [26]. Consistent with this evidence, we observed a threefold increased risk of kidney disease-mediated mortality in people with diagnosed diabetes.
Diabetes treatment by insulin may lead to hypoglycemia as a common side effect. Low blood glucose level has been linked to impaired cognitive function and may contribute to accidents due to deteriorated driving performance [27]. However, hypoglycemia-induced accidents are extremely rare and cannot serve as material consideration for the accidents during driving [28]. A population register-based study showed a similar risk for road traffic collisions in insulin-treated patients and nondiabetic individuals [29]. We included mortality due to accidents in our analysis, although this was not limited to transport accidents, and our data show clearly that diabetes status was not associated with accident-specific mortality.
Cancer and diabetes share many common risk factors, such as obesity and physical inactivity. Although the potential role of poorly controlled hyperglycemia and hyperinsulinemia in carcinogenesis has been proposed in people with diabetes, the relationship between diabetes and cancer-specific mortality is inconsistent [30]. A retrospective study in China reported a significantly increased overall mortality risk of cancer in people with diabetes [31]. Data from the Strong Heart Study in the United States show that diabetes increases the risk of cancer mortality by 1.27-fold in American Indians [32]. Data analyses from a French cohort suggest that diabetes is not associated with cancer mortality in patients with end-stage renal disease [33]. For specific types of cancer, a consistent positive association between baseline diabetes and mortality due to liver, pancreas, or bladder cancer has been reported, although the relationship between diabetes and endometrial cancer mortality is inconsistent [30]. Moreover, diabetes is not associated with kidney cancer mortality [30]. For other site-specific cancers, a positive association between diabetes and breast cancer-specific mortality has been found in Black women, and this excess breast cancer-mediated death caused by diabetes is with racial disparities [34]. Another study suggested that diabetes is not associated with mortality due to breast cancer, regardless of diabetes treatment and duration [35]. For male-specific cancer, diabetes has been reported to be associated with a reduced incidence of prostate cancer in several studies [36]. A Japan cohort study showed an association between diabetes and colorectal cancer mortality only in women [37]. Thus, the evidence of a possible association between diabetes and mortality due to specific types of cancer is inconsistent. The crude models in the Cox proportional-hazards regression analysis of diabetes status (Table 3) in our study suggest that baseline diabetes was significantly associated with increased risk of cancer mortality. However, this association disappeared after multivariable adjustment, which is consistent with a recent study [38]. We did not analyze site-specific cancer mortality because such information is not publicly available in the NHANES (1999 to 2010) LMF to protect the confidentiality of NHANES participants.
As another age-related disease, AD has been linked to diabetes in several studies that have shown an increased risk of AD development in diabetes patients. The Tel Aviv Brain Acute Stroke Cohort (TABASCO) study showed an independent effect of diabetes on brain atrophy and the risk of cognitive decline in survivors of stroke/transient ischemic attack [39]. However, the results of clinicopathological investigations suggest that AD patients with diabetes have the same levels of amyloid-β and neurofibrillary tangles as nondiabetic AD patients [40]. Most of the papers analyzed in a systematic review showed no significant association between diabetes and cognitive decline in AD patients [41]. Diabetes was not associated with AD after controlling for CeVD in a study based on a nationally representative database of aged United States Medicare beneficiaries [42]. Therefore, the relationship between diabetes and AD remains uncertain. In our study, baseline diabetes was not associated with increased risk of AD mortality in the United States general population.
In summary, diabetes plays a well-defined role in elevating mortality due to several major diseases while whether diabetes can contribute to mortality of other diseases, such as cancer and AD, is still a topic of debate. We examined the associations between diabetes and mortality due to eight underlying causes of death. We found epidemiological evidence that diabetes diagnosed at the baseline was associated with increased mortality risk due to CVD, CLRD, influenza and pneumonia, and kidney disease, but not cancer or AD. These findings remained consistent even after including participants with insufficient information on confounding variables (Supplementary Table 7). As an indicator of the proportion of cause-specific mortality attributable to baseline diabetes, the PAR% was calculated using HRs from the Cox models [43]. However, we note that HR may not be identical to relative risk when calculating PAR, especially at longer follow-up time points.
Our study has several limitations. First, the follow-up was relatively short, especially for the NHANES data cycle 2009 to 2010, in which participants were followed for only 2 years. Second, only one certifying physician-marked leading cause of death was recorded in the death certificate even though some deaths may be attributed to multiple causes. Third, several diseases are with few events in the analysis of cause-specific mortality, and we have to include a limited number of confounding variables to prevent biased adjusted HRs. Our work has several strengths. The NHANES data are generalizable to the noninstitutional civilian United States population. By using the most recent NHANES and its mortality data, this study included all available leading causes of death-mediated mortality and examined the association with baseline diabetes. Our findings provide new information about whether diabetes contributes to mortality due to the major types of diseases.
In conclusion, we studied the association between diabetes diagnosed at baseline and mortality due to various causes using NHANES (1999 to 2010) and its mortality follow-up study. We found positive associations between diagnosed diabetes and mortality due to CVD, CLRD, influenza and pneumonia, and kidney disease; baseline diabetes did not contribute to cancer- and AD-specific mortality.
 XML Download