

 PDF
PDF ePub
ePub Citation
 Print
Print


INTRODUCTION
Chronic complications of type 2 diabetes mellitus (T2DM) can be divided into macrovascular complications, including cardiovascular, cerebrovascular, and peripheral arterial disease, and microvascular complications, most commonly, retinopathy, nephropathy, and neuropathy. The increasing incidence of these chronic complications has been accompanied by an increase in the mortality rate among diabetic patients [12]. In Korea, the prevalence of myocardial infarction, cerebrovascular disease, cataracts, and glaucoma is higher in diabetic patients than in the normal population according to the Korean National Diabetes Program [3]. Annual screening for the microvascular and macrovascular complications of diabetes has thus been recommended to allow early detection and treatment.
Atherosclerosis is the most prominent manifestation of cardiovascular disease, and atherosclerotic vascular changes lead to diabetic microvascular complications [45]. As demonstrated in several studies, the development of several surrogate markers of subclinical atherosclerosis, including the carotid artery intima medial thickness (IMT), ankle-brachial index (ABI), and pulse wave velocity (PWV), have contributed to the prevention of chronic diabetic complications [678]. IMT, which is measured by ultrasonography, reflects early atherosclerosis and vascular remodeling status. ABI is calculated by measuring upper- and lower-extremity blood pressure, and PWV is calculated by non-invasive evaluations of the velocity of a pulse wave traveling between two defined points in a blood vessel. Because PWV is significantly affected by blood pressure, an arterial stiffness index, the cardio-ankle vascular index (CAVI), is used to compensate for the weakness of PWV, and its utility has been well demonstrated [910]. However, the various tests conducted to evaluate T2DM-related complications are often economically burdensome for patients. Studies of the correlation of these surrogate markers and determination of a single marker that best detects subclinical atherosclerosis would therefore be of value. In this study we analyzed the correlation between surrogate markers of subclinical atherosclerosis and their optimal use in diabetic patients. The same markers were also examined for their relationship to 10-year atherosclerotic cardiovascular disease (ASCVD) risk.
METHODS
Study population
This study was conducted with 312 patients with T2DM who visited the Department of Endocrinology and Metabolism, Kyung Hee University Hospital, between July 2010 and December 2011. Patients 18 years of age or older diagnosed with T2DM who underwent IMT, ABI, and CAVI tests were included in the study. Patients in whom at least one of the tests was not performed were excluded, as were patients with severely compromised renal function (creatinine levels ≥1.6 mg/dL, overt proteinuria ≥1 g/day) or a history of cancer or depression. Thus, the final study population consisted of 219 patients.
Study design
This retrospective non-interventional study was conducted based on medical records; specifically, we reviewed patients' medical history and examination records. Baseline clinical characteristics included age, sex, physical examination results, smoking and alcohol consumption habits, exercise, and comorbidities. Biochemical examinations included complete blood counts; tests for liver enzyme, blood urea nitrogen, glycosylated hemoglobin, and creatinine levels; and lipid profiles. Tests for diabetes mellitus (DM) complications included the urinary albumin creatinine ratio, which is used to screen for microvascular complications, and the IMT, ABI, and CAVI tests, which are used to screen for macrovascular complications. We analyzed both the correlation among the latter three surrogate markers and the association between each one and the ASCVD risk or the presence of factors indicative of metabolic syndrome. The ASCVD was defined as coronary death or nonfatal myocardial infarction or as fatal or nonfatal stroke. Metabolic syndrome was defined according to the criteria proposed by the National Cholesterol Education Program's Adult Treatment Panel III (NCEP ATP III) [11]. The risk factors for metabolic syndrome include waist circumference ≥90 cm in men and ≥80 cm in women, fasting blood glucose ≥110 mg/dL, high density lipoprotein cholesterol (HDL-C) <50 mg/dL in women and <40 mg/dL in men, triglyceride ≥150 mg/dL, and blood pressure (systolic blood pressure ≥130 mm Hg, diastolic blood pressure ≥85 mm Hg).
Measurement of carotid artery IMT
A single skilled sonographer measured IMT using a high-resolution real-time B mode ultrasonography (HD11XE; Philips, Bothell, WA, USA) fitted with a linear 5- to 12-MHz probe. After the patient was stabilized in the supine position for approximately 10 minutes, the test was performed with the patient's head turned in the opposite direction from the examiner. IMT was measured at the far wall of the common carotid artery, 10 mm proximal to the bulb, and was defined as the distance between the lumen-intima interface and the media-adventitia interface. An absolute IMT value ≥1 mm was defined as atherosclerosis [1213]. A plaque was defined as a focal structure encroaching into the arterial lumen by 50% of the surrounding IMT value or demonstrating a thickness >1.2 mm. IMT and plaque features were analyzed using IntimaScope version 1.13E (Media Cross Co. Ltd., Tokyo, Japan). Mean and maximal IMT were measured on the left and right sides, and the larger set of values was included in the analysis.
Measurement of ABI and CAVI
The ABI and CAVI were measured using the VaSera VS-1000 (Fukuda Denshi Co. Ltd., Tokyo, Japan). After the patient had been stabilized in the supine position for 5 minutes, blood pressure at the posterior tibial and brachial arteries was measured. Dividing the ankle systolic blood pressure by the arm systolic blood pressure yielded the ABI. A value <0.9 was interpreted as lower-limb arterial occlusion; that between 0.9 and 1.3 was interpreted as normal; and that >1.3 was interpreted as lower-extremity arterial calcification and stiffness. The right and left sides were measured, and the value closer to 0.9 was used for the analysis. Four blood pressure cuffs were wrapped on the four extremities to measure the CAVI. Electrocardiography electrodes were attached to both arms, and a microphone was placed on the sternum in the second intercostal space. After the patient had been stabilized in the supine position for 10 minutes, electrocardiography and phonocardiography were monitored. CAVI was calculated using Bramwell-Hill's equation [14]: CAVI=a[(2ρ/ΔP)×ln(Ps/Pd)PWV2]+b, where ‘Ps’ is the systolic blood pressure; ‘Pd’ is the diastolic blood pressure; ‘ΔP’ is Ps–Pd; ‘PWV’ is the cardio-ankle pulse wave velocity; ‘ρ’ is the blood viscosity; and ‘a’ and ‘b’ are the constants for converting the CAVI value to a value obtained using the Hasegawa method. A CAVI value <8 was interpreted as a mild risk of atherosclerosis; that between 8 and 9 was interpreted as a moderate risk of atherosclerosis; and that >9 was interpreted as a high risk of atherosclerosis. The higher of the measured right and left CAVI values was used for the analysis.
ASCVD risk assessment
The patients were divided into ASCVD and non-ASCVD groups according to their history of ASCVD. The medical history documented in the records was used to assign patients to the groups. In the non-ASCVD group, the cardiovascular morbidity and mortality risks were estimated according to the 10-year ASCVD risk protocol suggested by the 2013 American College of Cardiology/American Heart Association (ACC/AHA) guideline and based on the Pooled Cohort Equations as well as the work of Lloyd-Jones. This algorithm was published in the 2013 ACC/AHA guideline on the assessment of cardiovascular risk [15]. The estimate of 10-year ASCVD risk was based on sex, age, race (two groups: African-Americans and Caucasians or others), total cholesterol, HDL-C, systolic blood pressure, treatment for hypertension, history of DM, and smoking history.
Statistical analysis
All data are expressed as numbers with proportions for categorical variables or as mean±standard deviation for numerical variables. Differences in the means of the different groups were analyzed using the chi-square test for categorical variables and Student t-test or analysis of variance (ANOVA) for continuous variables. Tukey and Dunnett T3 methods were used for post hoc analysis. Spearman correlation analysis was used to analyze the relationship among ABI, IMT, and CAVI. A multivariate logistic regression analysis was performed to evaluate the utility of CAVI as a surrogate marker for atherosclerosis (mean IMT ≥1 mm) and a high (≥7.5%) 10-year ASCVD risk in the non-ASCVD group. The sensitivity and specificity of a high 10-year ASCVD risk (≥7.5%) in the non-ASCVD group were analyzed using a conventional receiver operating characteristic (ROC) curve. The statistical analyses were carried out using PASW version 20.0 software (IBM Co., Armonk, NY, USA). A P<0.05 was considered to indicate statistical significance.
RESULTS
Baseline clinical characteristics
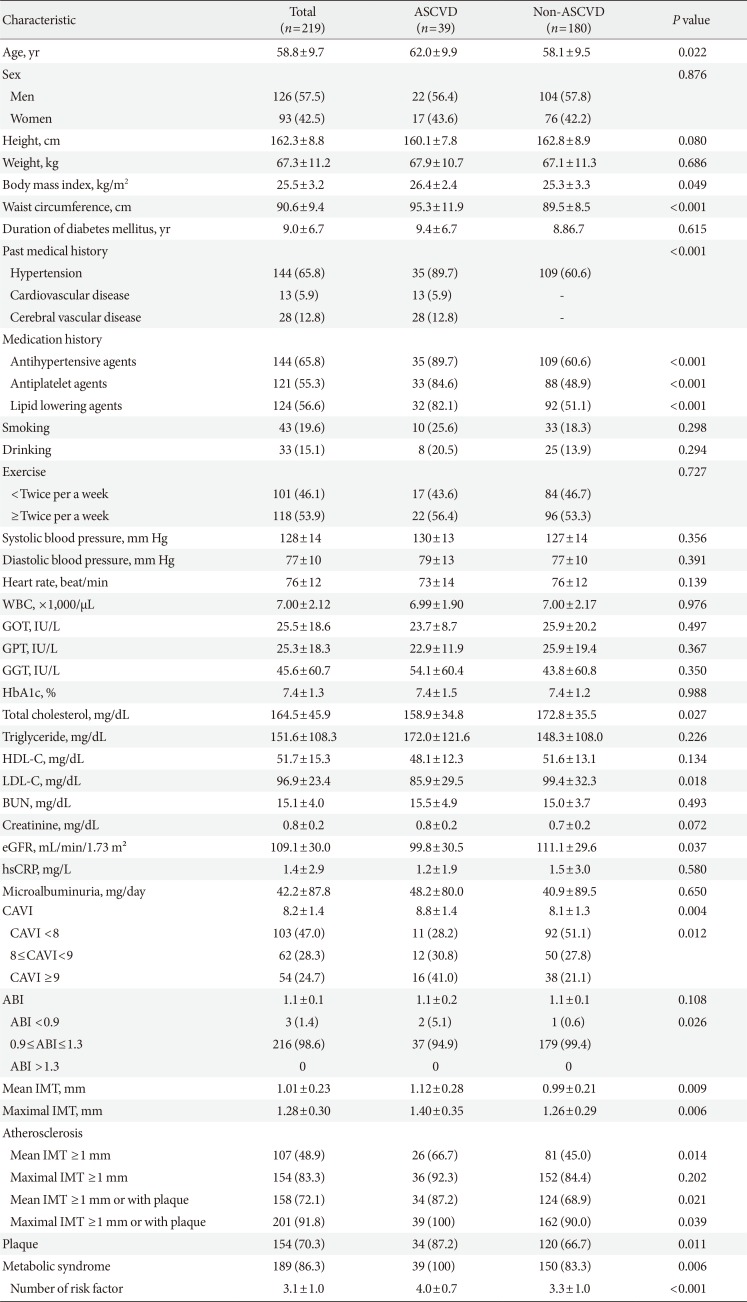
Table 1 shows the baseline clinical characteristics of the patients. The mean age was 58.8±9.7 years, and the mean duration of DM was 9.0±6.7 years. Patients in the ASCVD group (62.0±9.9 years; n=39, 17.8%) were significantly older than those in the non-ASCVD group (58.1±9.5 years; n=180, 82.2%; P=0.022) and had a significantly higher BMI and waist circumference than the non-ASCVD group (26.4±2.4 kg/m2 vs. 25.3±3.3 kg/m2, P=0.049; 95.3±11.9 cm vs. 89.5±8.5 cm, P<0.05, respectively). The differences in the triglyceride and HDL-C levels were not significant, but the low density lipoprotein cholesterol (LDL-C) and apolipoprotein B levels were lower in the ASCVD than in the non-ASCVD group (85.9±29.5 mg/dL vs. 99.4±32.3 mg/dL and 87.7±19.3 mg/dL vs. 96.5±24.0 mg/dL, respectively; P<0.05). The use of lipid-lowering agents was more common in the ASCVD than in the non-ASCVD group (P<0.001), and the mean CAVI (8.8±1.4 vs. 8.1±1.3, P=0.004), mean IMT (1.12±0.28 mm vs. 0.99±0.21 mm, P=0.009), and maximal IMT (1.40±0.35 mm vs. 1.26±0.29 mm, P=0.006) were higher in the ASCVD than in the non-ASCVD group.
Clinical characteristics according to CAVI in the non-ASCVD group
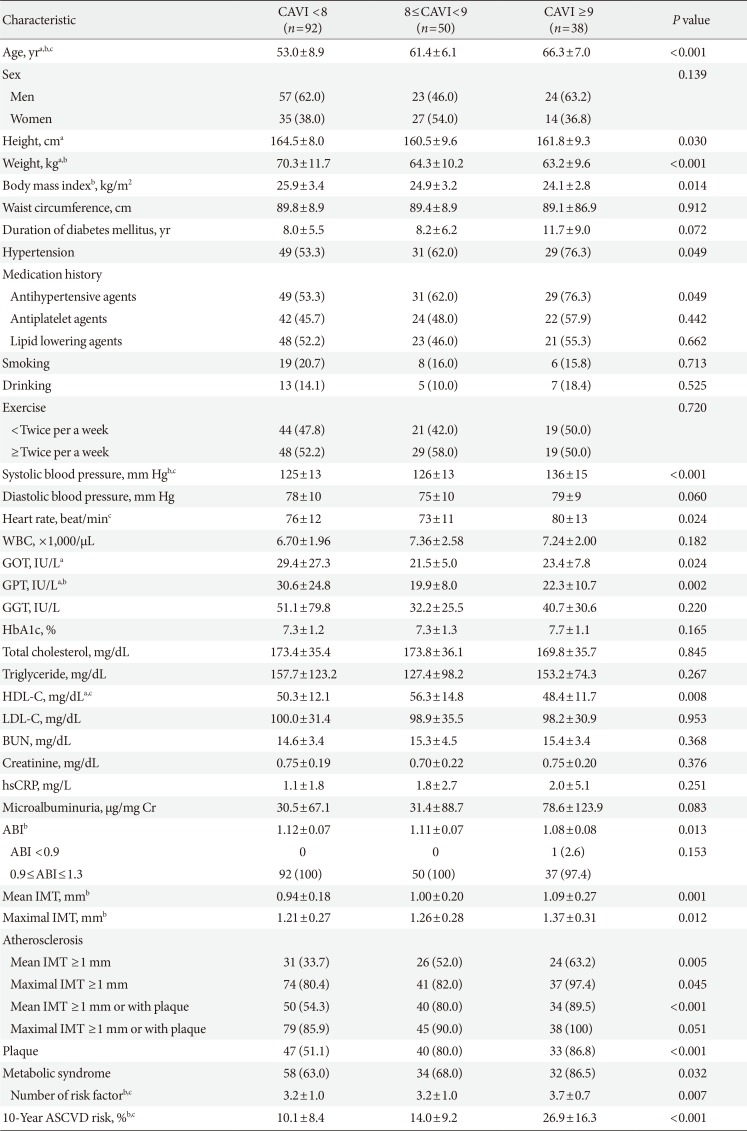
The non-ASCVD group was divided into three subgroups according to the CAVI: low (CAVI <8, n=92), moderate (8≤CAVI<9, n=50), and high (CAVI ≥9, n=38). The clinical characteristics of the groups were compared using an ANOVA and a chi-square test (Table 2). Age, blood pressure, history of hypertension, and use of anti-hypertensive agents were elevated in the high-CAVI group (P<0.05). Mean IMT (0.94±0.18 mm vs. 1.00±0.20 mm vs. 1.09±0.27 mm, P=0.001) and maximal IMT (1.21±0.27 mm vs. 1.26±0.28 mm vs. 1.37±0.31 mm, P=0.012) increased with increasing CAVI, as did the presence of atherosclerotic plaques (51.1% vs. 80.0% vs. 86.8% in the low, moderate, and high subgroups, respectively). There were no differences in the LDL-C and triglyceride levels among the three groups, but the HDL-C levels were lowest in the high CAVI group (50.3±12.1 mg/dL vs. 56.3±14.8 mg/dL vs. 48.4±11.7 mg/dL, P=0.008). ABI was also lowest in the high CAVI group (1.12±0.07 vs. 1.11±0.07 vs. 1.08±0.08, P=0.013). The 10-year ASCVD risk (10.1%±8.4% vs. 14.0%±9.2% vs. 26.9%±16.3%, P<0.001) and prevalence of metabolic syndrome (63.0% vs. 68.0% vs. 86.5%, P=0.032) increased in proportion to the CAVI score.
Correlations among CAVI, IMT, and ABI and association with the 10-year ASCVD risk
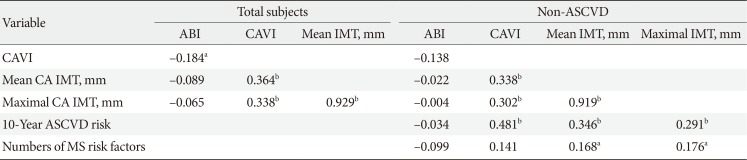
Table 3 shows the correlations among the CAVI, IMT, and ABI. CAVI was correlated with both the IMT and the ABI in all diabetic patients (P<0.05), whereas there was no correlation between ABI and IMT. In the non-ASCVD group, only the correlation between CAVI and IMT was significant. An additional analysis was conducted in the non-ASCVD group to determine the correlation between each surrogate marker of subclinical atherosclerosis and the 10-year ASCVD risk score or the number of metabolic syndrome risk factors. The results showed that ABI was not associated with either the 10-year ASCVD risk score or the number of metabolic syndrome risk factors, whereas CAVI and IMT were correlated with the 10-year ASCVD risk score. The highest correlation coefficient was that for CAVI. IMT was correlated with the number of metabolic syndrome risk factors.
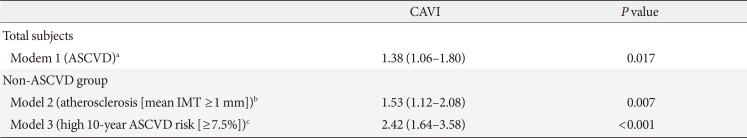
The value of CAVI for predicting ASCVD
After an adjustment for confounding factors, CAVI was identified as an independent risk factor for ASCVD and atherosclerosis (Table 4). Therefore, we analyzed the value of CAVI for predicting both the prevalence of ASCVD in all diabetic patients and the risk of ASCVD and atherosclerosis in diabetic patients without a history of ASCVD. The odds ratio (OR) of CAVI for ASCVD prevalence in all patients was 1.38 (95% confidence interval [CI], 1.06 to 1.80; P=0.017). In the non-ASCVD group, the OR of CAVI for the high 10-year ASCVD risk group (≥7.5%) was 2.42 (95% CI, 1.64 to 3.58; P<0.001). Based on a definition of atherosclerosis as a mean IMT ≥1 mm, the OR of CAVI for atherosclerosis in the non-ASCVD group was 1.53 (95% CI, 1.12 to 2.08; P=0.007).
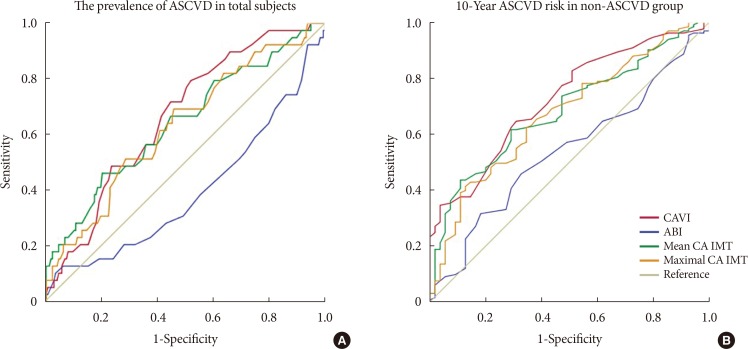
To detect the prevalence of ASCVD in all patients, the cut-off values and areas under the curve (AUCs) were determined for CAVI, ABI, and IMT. For CAVI, the cut-off was 8.05 with an AUC of 0.66; for ABI, the values were 1.08 and 0.39, respectively; for mean IMT, they were 0.995 and 0.64, respectively; and for maximal IMT, they were 1.225 and 0.63, respectively (Fig. 1A). To detect a high risk of 10-year ASCVD in the non-ASCVD group, the cut-off value was 7.65 with an AUC of 0.74 for CAVI, 1.11 with an AUC of 0.53 for ABI, 0.925 with an AUC of 0.70 for mean IMT, and 1.165 with an AUC of 0.68 for maximal IMT (Fig. 1B).
DISCUSSION
This study analyzed the correlations among three surrogate markers of subclinical atherosclerosis and demonstrated the superiority of CAVI. Diabetic patients with a history of ASCVD were more likely to be older, more obese, and to have a high CAVI and IMT. Among diabetic patients without a history of ASCVD, CAVI was correlated with IMT, whereas ABI was not associated with either CAVI or IMT. Thus, whereas CAVI and IMT reflect systemic atherosclerosis, ABI is an indicator of peripheral artery disease of the lower extremities and therefore of local significance. In the ROC curve analysis, among the three surrogate markers, CAVI was of the greatest utility for evaluating the prevalence of ASCVD in both all patients and in the potential high ASCVD risk group. In the non-ASCVD group, the 10-year ASCVD risk was ≥7.5%. Additionally, age, IMT, prevalence of metabolic syndrome, number of metabolic syndrome risk factors, and 10-year ASCVD risk were all significantly higher in the high CAVI group (CAVI ≥9). After adjusting for confounding factors, a high CAVI was a risk factor for ASCVD in all patients as well as a risk factor for atherosclerosis in the non-ASCVD group based on the mean IMT and a high (≥7.5%) 10-year ASCVD risk. According to this result, CAVI is the most sensitive surrogate marker of subclinical atherosclerosis.
The utility of CAVI has been extensively studied in Japan. In the study performed by Izuhara et al. [16], a high CAVI indicated the progression of carotid and coronary artery arteriosclerosis, and CAVI was more closely linked with arteriosclerosis than was brachial-ankle PWV. Takenaka et al. [17] demonstrated the utility of CAVI for predicting cardiovascular disease in patients undergoing hemodialysis, and Mineoka et al. [18] reported a positive correlation between CAVI and the coronary artery calcification score determined by multislice computed tomography in patients with T2DM. Similar studies have been conducted in Korean and Caucasian patients [192021]. Our results showed a strong correlation between CAVI and IMT and thus the utility of the CAVI as a surrogate marker of ASCVD. However, unlike other studies, we found a weak correlation between CAVI and ABI. This was probably due to the larger number of patients with an ABI <0.9 (at least 1.5% of all subjects) in previous studies than in our study, in which only three of the 219 patients had an ABI <0.9. Nonetheless, our results showed that, among the three surrogate markers of subclinical atherosclerosis, CAVI had the highest sensitivity and specificity. Additionally, we identified an association between a high CAVI and both a higher 10-year ASCVD risk score and a larger number of metabolic syndrome risk factors. Although there may be limitations in directly comparing the 10-year ASCVD risk calculated according to the 2013 ACC/AHA guidelines with the CAVI, ABI, and IMT values, because they may be affected by genetic background and complication progress, the three markers could be used complementarily to assess cardiovascular risk.
Limitations in the utility of the traditional surrogate markers of subclinical atherosclerosis have been suggested in several studies. The sensitivity and specificity of ABI decreases in diabetic patients due to higher rates of medial arterial calcification [22]. Despite several studies in which IMT was used as a surrogate marker of cardiovascular disease and atherosclerosis [81323], limitations in this method have been suggested because the value of this variable may increase for reasons not related to atherosclerosis, such as smooth muscle cell hyperplasia or fibrocellular hypertrophy [24]. Moreover, it is difficult to evaluate the vulnerability of a carotid artery plaque by ultrasonography. For this reason, the 2013 ACC/AHA guideline did not support routine carotid artery IMT as a risk assessment for an ASCVD event, regardless of initial risk stratification by traditional methods. IMT was therefore downgraded from a class IIa (reasonable) to a class III (none) benefit [25]. Given the limitations of these surrogate markers and the high medical costs incurred by diabetic patients, our demonstration of a strong correlation between CAVI and traditional surrogate markers of subclinical atherosclerosis as well as the superiority and utility of CAVI is meaningful. Our results are also supported by studies reporting the value of CAVI as a clinical marker for carotid and coronary arteriosclerosis screening and as a parameter for the prediction of disease severity and early stage left ventricular diastolic stiffness [2627]. In our study, CAVI, which reflects the stiffness of the thoracic, abdominal, common iliac, and distal arteries and their involvement in arteriosclerosis, was more representative of systemic arteriosclerosis than was IMT, which reflects carotid artery status, and ABI, an indicator of reflects lower-extremity status. This finding explains the superiority of CAVI as a marker. CAVI is also more valuable than PWV because it is not affected by changes in blood pressure in response to the confounding environmental and psychological factors associated with the examination itself; rather, it reflects autonomic nervous system function, including vasoconstriction [10]. The superior clinical value of CAVI vs. PWV was also reported previously [16].
However, one limitation of CAVI is that, although the formula to calculate it is based on the assumption that vascular diameter, blood pressure, and the elasticity from the aortic valve to the ankle are constant, this is not always the case. Other limitations of our study included its inclusion of patients from a single tertiary medical institution, which could limit the generalizability of the results. Multicenter, large-scale studies are therefore needed. Additionally, a 10-year ASCVD risk assessment model (pooled cohort equation) based on the 2013 ACC/AHA guideline and developed for non-Hispanic Caucasian and African-American populations suggested that the risk factors differ for Asians and are thus not more broadly applicable. Moreover, only patients 40 to 75 years of age were included in our model. Risk factors are commonly measured in this age group but not in older or younger patients. Also, there are currently very few ASCVD-risk equations suitable for Asians. The Korean Risk Prediction Model for ASCVD published by Jung et al. [28] has several limitations regarding its general use. Unlike the latter, although CAVI compensates for the weakness of the PWV, its use has not been validated for the Korean population. Our study thus provides important evidence of the utility of the CAVI as a new screening option.
In conclusion, CAVI was positively correlated with both the 10-year ASCVD risk and IMT and was the most sensitive of the tested surrogate markers for the detection of subclinical atherosclerosis in Korean diabetic patients without ASCVD.
 XML Download