

 PDF
PDF ePub
ePub Citation
 Print
Print


INTRODUCTION
As clustering of risk factors are associated with development of cardiovascular disease (CVD), various prediction models have been developed to identify high-risk individuals for CVD. Traditional approaches for CVD prediction models have been used Cox hazard regression-based analyses.1)2)3) These models identify risk factors in terms of odds or hazard ratios and then provide 10-year risks for CVD, which enables treatment strategies tailored to an individual.4)
Hazard regression-based models use pre-specified risk factors, which must meet the assumption of independence between predictors.4) In a prospective cohort, because pre-selected risk factors are measured at pre-planned time points, the collected risk factor information can be fully exploited by statistical methods. However, in clinical practice, as types and cycles of risk factor measurement vary widely, conventional statistical models cannot use all of the available risk information but use only a part of such database. The modern hospital information system (HIS) has generated a complex, time-series digitalized health dataset. However, the proper analytic method has not been clearly defined to maximize predictive performance using these numerous, repeated-measures datasets.
Deep learning is a class of machine learning algorithms5) and demonstrates excellent performance in classification. The overall transformations have multiple layers in deep learning4) and this capacity could enhance predictive model performance in complex time-varying datasets. To date, several small studies have explored the potential of deep learning for disease prediction based on data from specific time points.6)7)8) The purpose of this study was to evaluate the discriminative accuracy of a deep learning-based prediction algorithm to integrate repeated-measures health examination data for prediction of CVD, and to compare it with conventional Cox hazard regression analysis.
METHODS
This study was approved and exempted from informed consent by the Institutional Review Board of Yonsei University, Severance Hospital in Seoul, Korea (IRB No.4-2016-0383). This study used National Health Insurance Service-Health Screening Cohort (NHIS-HEALS)9) data and National Health Insurance Service-National Sample Cohort (NHIS-NCS)10) data derived from a national health screening program and the national health insurance claim database in South Korea and prospective cohort data from the Rotterdam Study.11) Data in NHIS-HEALS and NHIS-NCS were fully anonymized for all analyses and informed consent was not specifically obtained from each participant. In the Rotterdam Study, all data were collected in a standardized manner according to the pre-determined study protocol and informed consent was obtained from all participants.
Study population for development and internal validation
The National Health Insurance Service (NHIS) provides insurance benefits and free health screening programs for all citizens and residents of Korea. All adults over 40 years old are recommended to undergo periodic health examinations and the participation rate was as high as 74.8% in 2014.12) The NHIS constructed the NHIS-HEALS cohort consisting of data for 514,795 people (age 40–79 years), who had been randomly sampled from 10% of the source population who had undergone the NHIS health examination in 2002 or 2003. The cohort was followed up till either a participant's disqualification from health services or the end of the study period in 2013. Individuals who were free from CVD at baseline and had health examinations at least 2 times during follow-up period were included in the analysis.
Allocation of study datasets for model development
The study population in NHIS-HEALS was randomly divided into 3 groups—development, calibration, and validation datasets. The development dataset was used to build a model for fitting the parameters of the predictors; the calibration dataset was used to tune the parameters to prevent over-fitting in the training model; and the validation dataset was used to evaluate the prediction performance of the developed model. For improving predictive accuracy of the deep learning algorithm, the imbalance between those with CVD and without CVD was adjusted by under-sampling of the majority class. That is, those with and without CVD were constituted with a ratio of 1:1 for the development and calibration datasets to build a model, which has been traditionally applied in deep learning methods for dealing with imbalanced data, because predictive accuracy is impaired when data are imbalanced.13)
Study population for external validation
We validated the prediction models in 2 external cohorts, the NHIS-NSC and the Rotterdam Study. The NHIS-NSC is a national sample cohort representing all Korean age groups, in which 10% of the entire Koreans with health insurance were randomly sampled and followed up from 2002 until 2013. A subgroup of those aged between 40 and 79 years was used for external validation. Since the Rotterdam Study consists almost exclusively of Caucasian subjects, it is ethnically and geographically different from NHIS-HEALS (Supplementary Data 1 for the details of the Rotterdam Study). For external validation, individuals who were free from CVD at baseline and had health examinations at least two times were enrolled according to the same criteria for the development cohort.
Outcomes
The primary outcome was defined as the occurrence of one of the following events during the follow-up period after the baseline health examination: 1) death from CVD (International Classification of Diseases 10th edition [ICD-10] codes I-00 to I-99), 2) records of hospitalization due to myocardial infarction, coronary arterial intervention or bypass surgery, and 3) records of hospitalization due to stroke.
Risk predictors used in model building
To develop the risk model, an a priori decision which assumed the following variables; age, body mass index (BMI), systolic blood pressure (SBP), diastolic blood pressure (DBP), total cholesterol (TC), fasting plasma glucose (FPG), current smoking, and exercise - as predictor variables was made. Methods for risk factor measure are shown in Supplementary Data 2. Details of variables included in Cox regression and deep learning are described in Supplementary Table 1. Variables with missing data less than 4% were included in the analysis. Multiple imputation by fully conditional specification was used in cases where the data was missing.
Development of prediction models
As it has been known that significant differences existed in the relations between risk factors and CVD occurrence according to gender, CVD prediction models were developed separately for men and women. Data from baseline health examination and repeated measurements in periodic follow-up examinations were used to build prediction models. The time to event was defined as the time between the date of the first health examination and that of the first diagnosis of an event.
The Cox proportional hazard regression model was used to develop the statistical risk prediction model. Cox regression model used the mean, minimum and maximum values and standard deviations (SDs) for continuous variables and the mean and SDs for categorical variables, which were calculated from the periodic health screening data. Detailed method for this Cox model using longitudinal data and its improved accuracy over single-measure method has been described previously.14)
For the deep learning algorithm, a Recurrent Neural Network-Long Short-Term Memory (RNN-LSTM)15) network was used. Deep learning algorithm was constituted by using the same variables used in Cox regression model with longitudinal data. This study used the methods combining survival analysis and deep learning for comparison of the performances between Cox hazard regression and deep learning. Some recent studies proposed replacing the linear part βTx in f(x) with nonlinear deep learning neural network analyses in Cox hazard regression.16) In these studies, they proved that the methods combining two algorithms worked well in standard linear function like Cox regression but also as well in the nonlinear settings like deep learning, Thus, this study also presented the results by replacing the exponential part βTx in f(x) of Cox regression with nonlinear deep learning so that it could make survival prediction from NHIS-HEALS sequential cohort data. The details of deep learning and model building process are demonstrated in Supplementary Data 3, and the significance of included variables are shown in Supplementary Table 2.
Evaluation of prediction performance
The prediction performance of each prediction model were evaluated in the internal and external validation cohorts. Model discrimination was quantified by calculating C-statistics for the survival model. Reclassification performance was also evaluated using a reclassification table and the net reclassification improvement (NRI) index between Cox regression and deep learning model. For calculation of NRI, 3 CVD risk categories were used; <10%, 10% to <20%, and ≥20% in 10 years. Model calibration was assessed by comparing observed and predicted event probabilities. Observed and predicted risks were compared by plotting 2 CVD event occurrence probabilities and indicated the Hosmer-Lemeshow χ2 statistics and Brier score which are a measure of the fit of the model. All statistical analyses were conducted with SAS (version 9.4; SAS Inc., Cary, NC, USA) and the R Statistical Package (www.R-project.org). The statistical significance criterion was set at 2-sided p<0.05.
RESULTS
Of the original 514,866 individuals in NHIS-HEALS, those with histories of CVD according to their questionnaires, those who had records of CVD diagnosis at baseline, or those who received health examinations less than 2 times were excluded. The remaining 412,030 individuals constituted study population for model development and internal validation.
The individuals were divided into those with CVD (25,777 individuals, 6.3%) and those without CVD (386,253 individuals, 93.7%) at any point during the follow-up period thereafter.
In individuals with CVD, they were randomly allocated to the development, calibration and validation dataset with a ratio of 6:2:2 (15,466, 5,156, and 5,155 individuals, respectively). The number of individuals with and without CVD were allocated in a ratio of 1:1 in development and calibration cohort. The ratio of 6.3:93.7, which reflects actual occurrence of CVD in the original NHIS-HEALS cohort, were used for the validation cohort. Therefore, in individuals without CVD, they were randomized as follows; 15,466 individual for development, 5,156 individual for calibration, and 77,202 individuals for validation. Therefore, a total of 30,932 individuals were used for development; 10,312 individuals for calibration; and 82,357 individuals for validation (Figure 1). Details of the population selection process in the NHIS-NSC and the Rotterdam Study are also described in Figure 1.
Figure 1
Formation of the development, internal validation, and external validation cohorts.
CVD = cardiovascular disease; NHIS-HEALS = National Health Insurance Service-Health Screening Cohort; NHIS-NSC = National Health Insurance Service-National Sample Cohort.
*Individuals with CVD and non-CVD were defined according to CVD occurrence during the mean 9.8 ± 2.2 years follow-up period to 2013; †123,601 out of 412,030 individuals were randomly selected as the final dataset to deal with the imbalanced data between CVD and non-CVD. During the matching process for the development and validation datasets, 288,429 non-CVD were excluded.
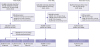
Table 1 shows baseline characteristics of development and validation datasets. External validation was performed in 178,875 persons (women 51.0%) in the NHIS-NSC and 4,296 (women 50.6%) from the Rotterdam Study. Mean follow-up duration was approximately 10 years in all 3 validation datasets. Mean number of health examinations was lower in the Rotterdam Study than in the NHIS-HEALS or NHIS-NSC cohorts. The cumulative CVD event rate was higher in the Rotterdam Study (11.7%) than in the NHIS-HEALS (6.3%) and NHIS-NSC (5.2%).
Table 1
Baseline characteristics of the development, internal validation and external validation cohorts

Relative risk estimates for the Cox model predictors were described in Supplementary Table 3. Age, BMI, DBP, current smoking and exercise were associated with CVD in men while age, SBP, TC and exercise were associated with CVD in women. Moreover, SDs of CVD risk factors were more important compared to their mean values in Cox models using repeated measures.
Performance indicators of each model are demonstrated in Tables 2 and 3. C-statistics (95% confidence interval [CI]) for Cox regression and deep learning were 0.813 (0.803–0.823) and 0.896 (0.886–0.907) in men and 0.837 (0.825–0.849) and 0.921 (0.908–0.934) in women in the internal validation dataset, suggesting improved performance from Cox regression to deep learning. From Cox regression to deep learning, the NRI was 24.8% (p<0.001) in men and 29.0% (p<0.001) in women. In external validation with NHIS-NSC (External validation 1), deep learning had a C-statics of 0.868 (95% CI, 0.86–0.88) in men and 0.889 (0.88–0.91) in women and improved reclassification compared with Cox regression (NRI, 24.9% in men, 26.2% in women, all p<0.001). In external validation with Rotterdam Study (External validation 2), deep learning had a C-statics of 0.860 (95% CI, 0.82–0.90) in men and 0.867 (0.83–0.90) in women and improved reclassification compared with Cox regression (NRI, 36.9% in men, 31.8% in women, all p<0.001).
Table 2
Predictive performance of FRS and prediction models of men in internal and external validation cohorts
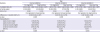
Table 3
Predictive performance of FRS and prediction models of women in internal and external validation cohorts
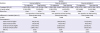
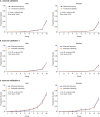
The Brier scores in each deep learning model indicated good calibration between the estimated predicted risk and observed risk (Tables 2 and 3). A calibration plots for deep learning models also confirmed good agreement between the estimated predicted risk and observed risk, grouped by decile of risk (Figure 2).
DISCUSSION
The principal findings of this study were as follows: 1) A deep learning algorithm significantly improved predictive performance over the conventional statistical approach when analyzing a large repeated-measures data for prediction of CVD. 2) Better performance of the deep learning algorithm over Cox regression analysis was confirmed by external validation in the Rotterdam Study, a different ethnicity, as well as in a different South Korean cohort.
Various risk prediction models have been proposed for the purpose of CVD prediction.1)2)3)17)18). However, since the accuracy of the CVD prediction models based on risk factor or statistics is not satisfactory in all circumstances,19) various attempts to increase the predictability are continuing. The most common approach is to add new biomarkers as predictors to improve disease predictability.20)21) However, apart from costs, biomarkers such as coronary artery calcium score has demonstrated only modest increase in predictive accuracy when added to a traditional risk factor model.22)
Since electronic health record was introduced several decades ago, huge amount of data has been accumulating in the medical field. In the current study, deep learning model using periodic risk factor measures showed better predictive accuracy over traditional Cox hazard regression approach. We used longitudinal Cox regression model incorporating mean and variability information into the Cox model, which showed better performance compared to the single measured method.14) Still, Cox regression demonstrated lower predictive accuracy than deep learning. A nationwide repeated health screening system like that used in South Korea may not be applicable to all health care systems. However, accumulation of large-scale data is accelerating in the medical field as HIS is advancing as a healthcare platform. The deep learning model provided good discrimination and calibration using these repeated data and can, therefore, may be a valuable tool for risk predictions in the era of electronic health record.
Deep learning, which have shown high value for many classification problems,23) is different from Cox regression-based statistics in many respects. A Cox regression model needs assumptions of proportional changes in the hazards being predicted and independence among pre-specified variables and does not reflect variable changes over time. In contrast, deep learning is agnostic in any assumptions and fully uses variable that are constantly changing into their models. Therefore, deep learning is a more proper method for analyzing data from daily clinical practice, where numerous confounding factors exist and risk factors for each individual change continuously. Moreover, the risk factors are closely related to each other and their interactions are complex. In the current study, traditional risk factors derived from prior cohort studies such as BMI and TC were not significant predictors for CVD in regression models, which corresponds to previous findings derived from analysis of various hospital data that showed many traditional risk factors were less significant factors for CVD occurrence.24) In this regard, deep learning may be more suitable for analyzing complex time-varying data derived from standard clinical practice, which may differ greatly from data derived from prospective controlled trials.
In both the NHIS-NSC of a different Korean population and the Rotterdam Study of a Europeans, deep learning approach showed improved discrimination to a considerable extent compared to the traditional statistical approach, implying its robust predictive power to be highly generalizable in geographically-disparate ethnically-diverse settings. Application of the developed model in this present study to other large-scale ethnic cohorts—such as blacks and Hispanics—now appears warranted. Models derived from machine learning, including deep learning, are fundamentally dynamic, and can incorporate new data for the continuous update and optimization of its algorithm, which improves its predictive performance over time.25)26) More importantly, models derived from machine learning algorithm can be locally retrained in diverse populations to maximize accuracy in different populations of patients with varying clinical and demographic profiles.27) The paradigm shift of methodology for building a prediction model from traditional hypothesis-driven statistical analysis to these self-training deep learning methods can help offer insights for precision medicine into personalized disease prediction. Regarding the importance of a continuous learning system and informatics tools to assist health-care providers in interpreting data and tailoring decisions of treatment to a patient in precision medicine,28) the deep learning algorithm represents new opportunities for physicians to engage in precision medicine by providing precise information of CVD risk in each individual.
This study had several limitations. First, the level of risk factors can be modified by drug or non-drug treatment during the course of follow-up, thereby changing the risk of CVD, and these modifications may be unpredictable based upon physician and patient behavior. While predict models may be influenced by such confounders, it is likely to be more affected by single point measures. This study showed that deep learning methods can further improve CVD prediction ability using repeatedly-measured information, suggesting the strengths of deep learning for these data. Second, outcome events were ascertained from health insurance claims data and diagnoses were not adjudicated by medical records or laboratory tests as in other large data studies. However, evaluation of the deep learning approach in a prospectively enrolled cohort study nevertheless demonstrates the robustness of this model in populations in which events were prospectively ascertained. Third, some risk factors some risk predictors included in the prediction model did not satisfy the assumptions required for proportional hazard analysis (Supplementary Table 4). However, we used proportional hazard analysis, which has been the most widely used for CVD prediction, because our main purpose was to assess whether we could improve the predictive power of the models by using repeatedly measured data. Fourth, incorporation of more complex information can enhance the predictive power of deep learning, since the benefit of deep learning is its capacity to deal with large complex data without any assumptions. However, since the purpose of the current study was to confirm the superior analytic performance of deep learning to that of Cox regression, we used the same variables for both models. Further studies using a large number of variables would be needed to validate predictive performance of deep learning with increase in number of variables. Fifth, the number of health screening was relatively small in Rotterdam Study compared to NHIS-HEALS and NHIS-NSC. This might be one of the reasons for the lower C-statistics in Rotterdam Study. Sixth, the problem of imbalanced data was adjusted by under-sampling of the majority class. Further studies with more complex validation scenario and experiments with different class ratios are needed.
In conclusion, a time-series deep learning algorithm analysis of periodic health screening data resulted in predictive models for CVD outcomes that had greater discriminative accuracy then conventional statistical approaches. However, the utility of this model in clinical care requires further research.
 XML Download