

 PDF
PDF Citation
 Print
Print


INTRODUCTION
Non-alcoholic fatty liver (NAFLD) is the most common cause of liver disease in children.12 The disease's natural course has not been well understood, but in some cases it may lead to fibrosis, cirrhosis, and ultimately liver failure.34 NAFLD appears to be closely related to metabolic syndrome, showing similar symptoms such as abdominal obesity, insulin resistance, diabetes, dyslipidemia, and hypertension; it also increases the risk of death by cardiovascular disease.5 Thus, establishing the diagnosis of NAFLD in children is important for screening purposes.
Liver biopsy is the gold standard to confirm the diagnosis and determine the severity of fatty liver disease. However, liver biopsy has some limitations: the variable quality of specimen, which is obtained only at a singular time point, variability during sampling, subjective assessment bias. Moreover, liver biopsy on children is not available in many institutes and is not suitable for screening. Although measuring the proton density of the fat fraction with a magnetic resonance-based technique has been reported as a promising, non-invasive method for quantification of hepatic steatosis,6 this technique is currently limited by high costs and a low availability of specific sequences in screening imaging centers.
Ultrasound (US) is a relatively inexpensive and widely available technique commonly used both in research centers and in clinical practice for the evaluation of fatty liver disease. However, an evaluation of the relationship of clinical and histopathological parameters with the four degrees of hepatic steatosis by US examination is lacking, especially in children.7 Moreover, a recent study suggests that fat accumulation in the pancreas may lead to similar processes observed in NAFLD.8 Furthermore, it is becoming evident that NAFLD has important associations with other obesity-related diseases.9
Therefore, we investigated whether US findings are correlated with the severity of clinical and histopathologic parameters of children affected with NAFLD. We also evaluated the prevalence of fatty pancreas in these patients.
METHODS
Study population
Between March 2006 and August 2017, 58 consecutive children were enrolled in this study (42 boys, 16 girls; mean age, 12 years; age range, 4–19 years). All 58 subjects underwent abdominal US and percutaneous US-guided liver biopsy after 6 months follow-up period, when the children had been showing no improvement of liver function test since the first US. We recorded age and sex, and the serum levels of aspartate aminotransferase (AST), alanine aminotransferase (ALT), alkaline phosphatase (ALP), and total bilirubin were evaluated. Metabolic factors were also recorded: body mass index (BMI) percentiles,10 waist circumference, fasting serum glucose, fasting insulin, total cholesterol, triglycerides, free fatty acid (FFA), high-density lipoprotein (HDL), low-density lipoprotein (LDL), and systolic and diastolic blood pressure. Homeostasis model assessment of insulin resistance (HOMA-IR) index and insulin sensitivity index were calculated as follows11: HOMA-IR index = fasting insulin (μIU/mL) × fasting glucose (mg/dL) / 405; Insulin sensitivity index-free fatty acid (ISI-FFA) = 2/(insulin × FFA + 1); Quantitative insulin sensitivity check index (QUICKI) = 1/[log fasting insulin (μIU/mL) + log fasting glucose (mg/dL)]. ISI-FFA in normal subjects is reported as 1 in adults,1213 whereas QUICKI is defined as impaired in children if the level is between 0.43 and 0.91.1415
US examination of the liver and pancreas
The US examinations were performed by using one of the following systems: iU22 (Philips Healthcare, Andover, MA, USA) and Aixplorer (SuperSonic Imagine, Aix-en-Provence, France) using a convex-array transducer. All subjects were asked to fast for at least 6 hours before examination to reduce bowel gas and improve the visualization of the pancreas. For evaluating the parenchymal echogenicity of the liver, an intercostal scan was performed to visualize the portal vein, diaphragm, and right kidney. To carefully evaluate the pancreas, the radiologist used a compression technique for displacing bowel gas and different scanning techniques such as controlling respiration by suspending inspiration or expiration and using the spleen as a sonic window for evaluation of the pancreas' tail.
US imaging analysis
Two radiologists independently and retrospectively analyzed the US images by using the hospital's picture archiving and communications system. The clinical and histopathologic diagnoses were unknown to both radiologists at the time of image evaluation. The radiologists evaluated the degree of fatty liver according to four grades as follows: 1) grade 0 (absence of steatosis with normal liver echogenicity); 2) grade 1 (mild steatosis, the liver had higher echogenicity than the right renal cortex, but the echogenic wall of the main portal vein was preserved); 3) grade 2 (moderate steatosis, impaired echogenicity of the main portal vein wall); 4) grade 3 (severe steatosis, impaired visualization of the posterior hepatic parenchyma or the diaphragm). The degree of fatty pancreas was rated according to three grades as follows: 1) grade 0 (the echogenicity of pancreas is similar or slightly higher than that of the kidney); 2) grade 1 (pancreas echogenicity is much higher than that of the kidney, but lower than that of the retroperitoneal fat); and 3) grade 2 (pancreas echogenicity is similar to that of the retroperitoneal fat). After each radiologist had analyzed the images individually, if they had differing opinions, a consensus via discussion was reached. Inter-observer agreement analysis was performed with regard to the four US signs.
Liver biopsy and histopathologic examination
Ultrasonography-guided liver biopsies were performed using an 18-gauge needle (Stericut 18G coaxial; TSK Laboratory, Tochigi, Japan). In each patient, two parenchyma cores were obtained from two sites in the right anterior segment of the liver and routinely processed. All liver biopsy specimens were more than 1.5 cm in length and contained more than 6 portal tracts. A single experienced pathologist unbeknownst to the patients' information and the initial pathological assessment reviewed the hematoxylin and eosin and Masson-trichrome stained slides of each specimen, evaluating the presence and degree of histopathological features of steatohepatitis. A histological scoring system for NAFLD was used following already published parameters.16 In brief, the degree of steatosis was evaluated according to the percentage of parenchymal involvement and graded as follows: 0 (< 5%), 1 (5%–33%), 2 (> 33%–66%), and 3 (> 66%). Lobular inflammation was evaluated based on an overall assessment of the inflammatory foci and graded as follows: 0 (no foci), 1 (< 2 foci per 200× field), 2 (2–4 foci per 200× field), and 3 (> 4 foci per 200× field). Ballooning degeneration was graded as follows: 0 (none), 1 (few balloon cells), and 2 (many cells/prominent ballooning). NAFLD activity score (NAS) was calculated as the sum of the steatosis (0–3), lobular inflammation (0–3), and ballooning degeneration (0–2) scores. Each case was categorized as not-NASH (NAS of ≤ 5) and NASH (NAS of > 5).17 Portal inflammation was graded as follows: 0 (none), 1 (mild), and 2 (moderate to severe). Fibrosis was evaluated on the Masson-trichrome stained slides and graded as follows: 0 (none), 1 (perisinusoidal fibrosis), 2 (perisinusoidal and portal/periportal fibrosis), 3 (bridging fibrosis), and 4 (cirrhosis).15
Statistical analysis
Baseline characteristics were shown as frequencies with percentage, mean and standard deviation. Kruskal-Wallis test was used to compare the mean of continuous variables with the grade of hepatic or pancreatic steatosis, while the χ2 test for trends was performed for the categorical variables. Inter-observer agreement for liver and pancreas steatosis grading was analyzed using weighted Cohen's Kappa (κ) statistics with 95% confidence intervals (CIs) and was interpreted as follows: 0.00–0.20, poor; 0.21–0.40, fair; 0.41–0.60, moderate; 0.61–0.8, good; and 0.81–1.00, excellent agreement. Results were considered statistically significant with a P value < 0.05.
RESULTS
The analyzed population consisted of 42 boys and 16 girls (mean age, 11.6 years ± 3.1; range, 4–19 years). The mean values of AST, AST, and ALP were 134.2 U/L, 195.6 U/L, and 252.0 U/L, respectively. The BMI and waist circumference were 25.7 Kg/m2 and 90.1 cm, respectively. Twenty-nine children showed BMI ≥ 97 percentile (50%), those with BMI ≥ 95 percentile were 7 (12%), and those with BMI ≥ 85 percentile were 10 (17%). In our patient population, 42 subjects had simple steatosis (NAS ≤ 5) while 16 subjects had NASH (NAS > 5). Clinical and demographic data are shown in Table 1.
Table 1
Demographic parameters of the subjects
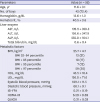
Data are presented as mean ± standard deviation or number (%).
AST = aspartate aminotransferase, ALT = alanine aminotransferase, ALP = alkaline phosphatase, HDL = high density lipoprotein, LDL = low density lipoprotein, ISI-FFA = insulin sensitivity index-free fatty acid, HOMA-IR = homeostasis model assessment of insulin resistance, QUICKI = quantitative insulin sensitivity check index.
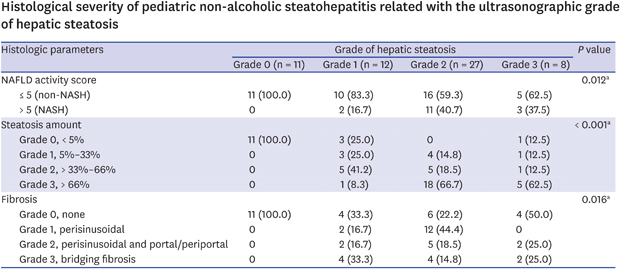
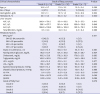
The clinical and histological parameters divided according to liver and pancreas steatosis grade are shown in Tables 2-5. Among various clinical parameters, sex (P = 0.036), hemoglobin (P = 0.028), hematocrit (P = 0.033), total bilirubin (P = 0.006), BMI percentiles (P = 0.004), waist circumference (P = 0.001), systolic blood pressure (P = 0.013), ISI-FFA (P = 0.026), HOMA-IR index (P = 0.019), and QUICKI (P = 0.019) were significantly associated with the liver steatosis grade (Table 2). Among histopathological parameters, NAS (P = 0.012), steatosis amount (P < 0.001), and fibrosis (P = 0.016) were significantly associated with the liver steatosis grade (Table 3).
Table 2
Clinical parameters according to grade of hepatic steatosis
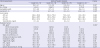
Table 3
Histological parameters according to grade of hepatic steatosis
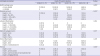
Table 4
Clinical parameters according to the degree of fatty pancreas
Data are presented as mean ± standard deviation or number (%).
AST = aspartate aminotransferase, ALT = alanine aminotransferase, ALP = alkaline phosphatase, BMI = body mass index, HDL = high density lipoprotein, LDL = low density lipoprotein, ISI-FFA = insulin sensitivity index-free fatty acid, HOMA-IR = homeostasis model assessment of insulin resistance, QUICKI = quantitative insulin sensitivity check index.
aP < 0.05.
Table 5
Histological parameters according to the degree of fatty pancreas
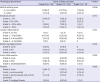
Fatty pancreas could not be evaluated in three children due to a limited sonic window. Fatty pancreas prevalence in all patients and among the group with ultrasonographic evidence of hepatic steatosis was 74.5% (41/55) and 79.5% (35/44), respectively. The proportion of boys was significantly higher among subjects with a higher grade of steatosis of the pancreas (P = 0.021). As steatosis grade of the pancreas increased, ISI-FFA tended to decrease (P = 0.049) (Table 4).
Fatty pancreas was more prevalent in the NASH group (13/15, 86.7%) than in the simple steatosis group (28/40, 70.0%), although the difference was not statistically significant. But the grade of fatty pancreas was not correlated with the severity of all the histological grade of liver (Table 5).
Post-hoc analysis of clinical parameters according to the ultrasonographic grade of fatty liver and fatty pancreas showed that ISI-FFA was statistically significant between grade 2 and grade 3 of fatty liver (P = 0.003), and also between grade 0 and grade 1 of fatty pancreas (P = 0.014). Waist circumference was statistically significant between grade 2 and grade 3 of fatty liver (Table 6).
Table 6
Post-hoc analysis of clinical parameters according to the grade of fatty liver and pancreas
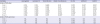
ISI-FFA = insulin sensitivity index-free fatty acid, HOMA-IR = homeostasis model assessment of insulin resistance, QUICKI = quantitative insulin sensitivity check index, NA = not applicable.
aP value < 0.008 were considered statistically significant for fatty liver and P value < 0.017 were considered statistically significant for fatty pancreas.
The inter-observer agreement rates between the two US radiologists was good for both the liver steatosis grade (κ = 0.674; 95% CI, 0.543–0.806) and pancreas steatosis grade (κ = 0.743; 95% CI, 0.601–0.886).
DISCUSSION
As childhood obesity is globally gradually increasing, NAFLD is becoming more prevalent as well. Between 5.5%–10.3% of children worldwide are affected by NAFLD and NASH. NAFLD is diagnosed in 34% of children with obesity1 and is related to metabolic syndrome.18 We found that diabetes-related parameters such as insulin resistance (HOMA-IR) and insulin sensitivity indices (ISI-FFA and QUICKI) are significantly associated with NAFLD severity. These results are consistent with the “two-hit hypothesis” proposed by Day and James to explain the development of NASH, in which insulin resistance is a major trigger for NASH pathogenesis. In this hypothesis, the “first hit” is characterized by an excessive hepatic triglyceride accumulation resulting in higher hepatic insulin resistance and impaired insulin sensitivity of the whole organ. Hyperinsulinemia and insulin resistance lead to hepatic steatosis, increasing FFA uptake into the liver.19 In this study, the degree of fatty liver was evaluated using US and showed good correlation with several clinical and pathologic parameters. Subjects with a high grade of hepatic steatosis had a significantly higher hemoglobin level, hematocrit level, waist circumference, systolic blood pressure, high HOMA-IR index, low ISI-FFA, and QUICKI scores. Moreover, the NAFLD activity score, steatosis amount, prevalence of fatty pancreas, and fibrosis were elevated at higher grade of hepatic steatosis.
While liver biopsy is the gold standard for the evaluation of fatty liver, it cannot be performed on all subjects, especially children. Conversely, US is the most commonly used technique to diagnose fatty liver in pediatric practice, despite the impossibility of precisely determining the hepatic fat content and identifying fat regression or progression. The presence of moderate and severe fatty liver confirmed by US is associated with a high risk of developing the metabolic syndrome.20
In a previous study, Shannon et al.7 showed an excellent correlation of ultrasonographic steatosis grade with the histologic grade. In this study, however, they divided ultrasonographic grades into two groups: normal and mild; moderate and severe. Instead, in our study, we increased the grading granularity by dividing the patients into 4 stages of hepatic steatosis, correlating them with the histological grade. Thus, we think that our grading system is more detailed than the previously published one. Moreover, we also correlated the US grade of hepatic steatosis with NAS and fibrosis grade.
A fatty pancreas is formed following excessive fat deposition in the organ. Its true incidence and epidemiology are currently poorly understood, but it has been suggested in the literature that pancreatic fat should be considered an additional factor affecting the glucose metabolism and severity of liver disease, increasing the risk of developing metabolic syndrome and not only just ectopic fat.2122 Della Corte et al.21 reported a prevalence of fatty pancreas in approximately half of the children with NAFLD with or without liver biopsy and in about 80% of patients with biopsy-proven NASH. In the present study, we show a high prevalence of fatty pancreas among children with NAFLD (above 70%). A large cohort study should be further conducted to determine the clinical significance of pancreatic steatosis with higher confidence.
There were several limitations of our study. First, US-based evaluation may be subjective and operator-dependent although in this study, the inter-observer agreement between the two radiologists was good for both the hepatic and pancreatic steatosis evaluations. Second, there is currently no gold standard for histopathologic diagnosis of fatty pancreas due to limitations in tissue acquisition and the presence of a few published studies on living patients. Third, the number of subjects included in each group was relatively small, and further study with a large cohort is advised.
In conclusion, US-based evaluation of fatty liver shows good correlation with clinical and pathologic parameters. Prevalence of fatty pancreas is common among children with NAFLD (above 70%), but further studies are needed to assess its clinical significance.
 XML Download