

 PDF
PDF ePub
ePub Citation
 Print
Print


INTRODUCTION
Emergency departments (EDs) treat patients with limited workforce and resources. Approximately 32% of ED visits are for non-urgent symptoms (1). This evokes crowding in the EDs, which, in turn, reduces patient satisfaction due to extended waiting times; it also reduces the efficacy of medical treatment, and leads to missed treatment windows, resulting in increased mortality (2).
It is known that the proportion of non-urgent emergency visits is high, as is the number of infant and neonatal emergency visits compared to adult visits (3). As the neonatal period includes various important physiological changes, it can be difficult to distinguish between normal and abnormal presentations in patients visiting EDs (4). Since neonates are susceptible to infection, unnecessary visits by neonates with weak immunity to EDs carry additional risks, such as exposure to nosocomial infections (5).
It is essential to make a quick judgment about the urgency of the patient at initial examination in order to reduce these risks. However, it is challenging for the emergency physicians to determine the urgency of symptoms because neonates (aged less than 28 days) account for a small proportion of emergency medicine patients, presentations can be atypical, and additional knowledge is required for diagnosis in many cases. Lately, as many neonatal units have implemented an early discharge policy, the need for good management of neonatal ED visits has become more pressing (4).
Although there are substantial numbers of studies on the characteristics of children and adults visiting EDs with non-urgent symptoms (67), there are few studies on non-urgent neonatal ED visits. An analysis of the characteristics distinguishing urgent and non-urgent neonatal visits would therefore be helpful for emergency physicians, who may have little neonatal experience.
Therefore we analyzed clinical characteristics between urgent and non-urgent visits of neonates by this retrospective study. Also, we determined the differences of chief complaints and final diagnosis according to the urgency of the visit.
MATERIALS AND METHODS
This study retrospectively analyzed the medical records of patients visiting a university hospital in a city in Korea. Approximately 89,000 patients visit the University Hospital Emergency Medical Center annually, and it is the leading emergency medical center among comparable cities and in the Southern Large Province. Approximately 24,000 pediatric patients are treated annually in the pediatric ED including severely ill neonates, as the hospital has a regional neonatal intensive care unit (NICU). This study included all neonates younger than 28 days who visited the ED in the 5-year period from March 1, 2010 to February 28, 2015. Of these, patients excluded from the study were: those registered but not examined in the ED in order to be admitted to the NICU as part of the tertiary hospital referral process; those not examined or treated due to refusal of consent by parents or caregivers, or those transferred to another hospital without examination; patients dead on arrival (DOA); and cases where target data were missing from medical records.
We classified ED visits into two groups; non-urgent group and urgent group. Simple chest or abdominal X-ray and medical care can be performed for mildly ill neonates in many private pediatric clinics. Therefore, the visits were defined as non-urgent cases if the patient was discharged after only a chest or abdominal X-ray was performed, or if the patient was discharged without laboratory tests; the cases were classified as the urgent visits group if the patient had examinations other than simple chest or abdominal radiography or if the patient was hospitalized regardless of whether tests were performed.
The records of ED visits were examined separately by the two primary investigators (HJY, HYS) to determine whether the visit would be classified as urgent or non-urgent. Finally the final record was reviewed by the corresponding author. In order to investigate neonatal characteristics and visit-related characteristics, age, sex, type of delivery (vaginal delivery/cesarean section), birth weight, prematurity, place of residence (hospital/postnatal care center/home), weight, referral visit route (physician/self-referral), and time of visit (8:00–15:59, day; 16:00–23:59, evening; 24:00–7:59, night) were collected. Data relating to ED treatment included presentation, final diagnosis, length of ED stay, and final disposition details. The frequency of non-urgent visits and urgent visits was analyzed, and neonatal characteristics, ED visits, and examination-related characteristics were compared between the groups. As there were various chief complaints, we also analyzed the presentations and final diagnosis according to organ system.
SPSS for Windows version 21.0 (SPSS Inc., Chicago, IL, USA) was used for statistical analysis. The distribution of variables was presented as mean and standard deviation. The t-tests and analysis of variance (ANOVA) was used to compare continuous variables, and the χ2 test for categorical variables. Univariable analysis and multivariable analysis was then performed with logistic regression analysis, and the association between adjusted non-urgent visits and each variable was presented as an odds ratio (OR) with confidence interval. Statistical significance was defined as P values < 0.05.
RESULTS
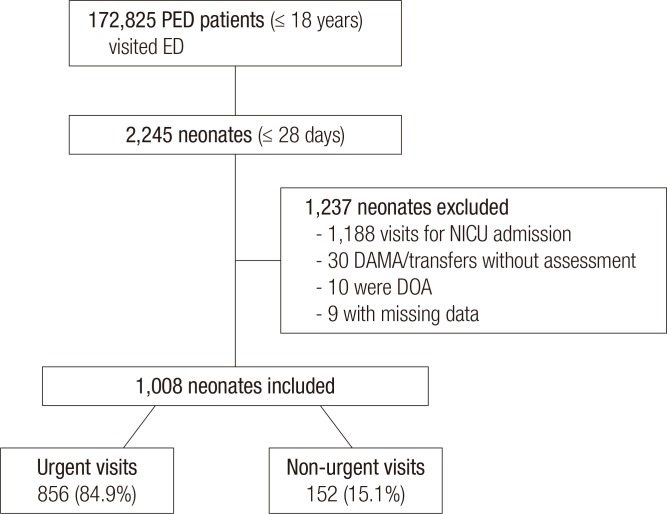
A total of 172,825 children and adolescents, including 2,245 neonates (1.3%), visited the ED during the 5-year study period. Of these, 1,188 visited the ED only in order to be admitted to the NICU after being arranged between medical professionals; 30 were not treated due to refusal of caregiver's consent or transfer to other hospital in our ED. Ten neonates were excluded due to being DOA and 9 were excluded due to missing charts. Data from the remaining 1,008 patients were used for analysis. Visits were classified based on our urgency definition: 856 (84.9%) were urgent visits and 152 (15.1%) were non-urgent visits (Fig. 1).
Fig 1
Flow chart of patient inclusion.
PED = pediatric emergency department, NICU = neonatal intensive care unit, DAMA = discharge against medical advice, DOA = dead on arrival.
Neonates were significantly younger and lighter in the urgent group compared to those in the non-urgent group (P < 0.001 and P < 0.001, respectively) (Table 1). There was a significant difference in places of residence between the groups: children visiting from home made up 66.0% of the urgent group, and 88.2% of the non-urgent group (P < 0.001). The percentage of neonates referred after examination from another clinic was 71.0% in the urgent group, which was significantly higher than the 21.1% in the non-urgent group (P < 0.001). The time of visits were also different between the groups. Fifty-three point three percent of the non-urgent visits were in the evening and 28.3% at night. In contrast, 50.4% of the urgent visits were in the daytime (P < 0.001).
Table 1
Urgent/non-urgent visits according to characteristics of neonates visiting an ED
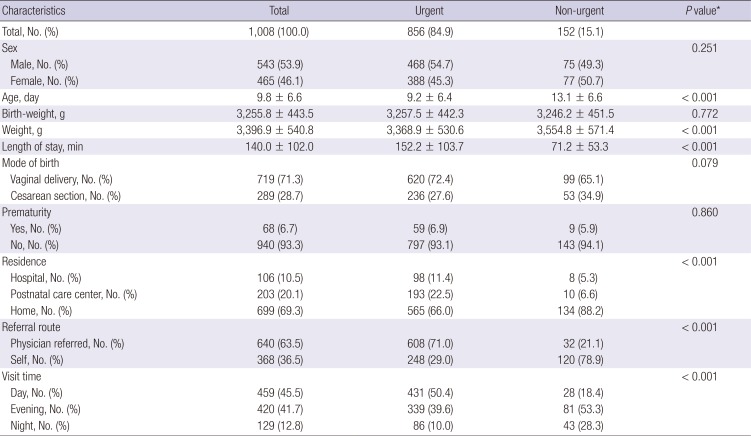
Length of stay for the ED was significantly shorter in the non-urgent group compared to that of the urgent group (P < 0.001). Seventy-nine point six percent of urgent patients were admitted to the NICU, whereas all non-urgent patients were discharged.
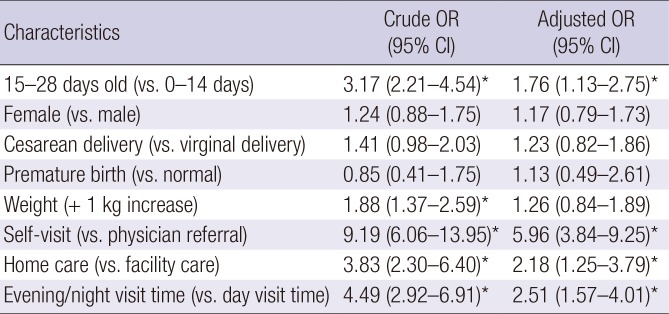
Multivariable analysis was performed in order to see if there was a difference in the rate of non-urgent visits according to the characteristics of neonates visiting the ED. After adjustment by multiple logistic regression analysis (Table 2), non-urgent visits had 1.76 times higher odds of being patients in the late neonatal period (15–28 days after birth) than in the early neonatal period (0–14 days after birth), 5.96 times higher odds of being voluntary visits than referrals from other hospitals, 2.18 times higher odds of being patients visiting from home than from postnatal care centers and hospitals, and 2.51 times higher odds of being visits in the evening than at night or in daytime. Weight was significantly associated with non-urgent visits prior to adjustment (1.88 times/kg) but it was not significant after adjustment; sex, cesarean section, and prematurity were not significant neither before nor after adjustment.
Table 2
OR and 95% CI for non-urgent visits by characteristics of neonates visiting ED, using multiple logistic regression analysis
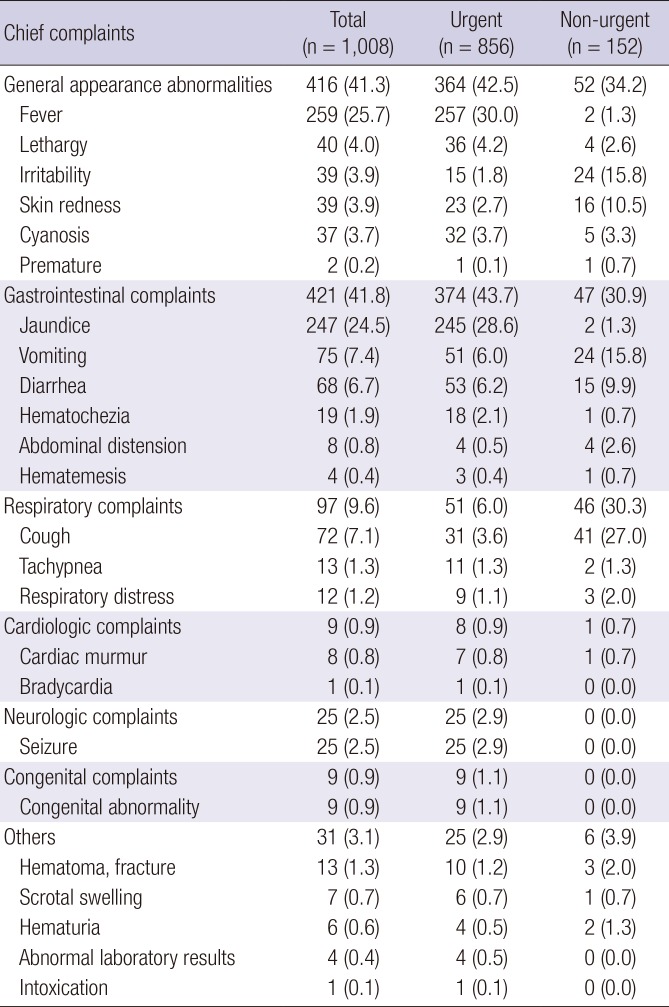
Chief complaints were classified by organ system, and were compared between the urgent and non-urgent groups (Table 3). In the urgent group, general appearance abnormalities like lethargy, irritability and fever were 42.5%, and gastrointestinal (GI) complaints were 43.7%, accounting for the majority of presentations. In the non-urgent group, general appearance abnormalities (34.2%), and GI complaints (30.9%) were also common presentations, but unlike the urgent group, respiratory complaints accounted for a large proportion (30.3%). As each chief complaint was ranked, fever was the most common (30.0%), followed by jaundice (28.6%) and diarrhea (6.2%) in the urgent group; however, cough (27.0%), followed by vomiting and irritability (15.8%) were frequent complaints in the non-urgent group.
Table 3
Presentations by urgent/non-urgent visits (from most to least common)
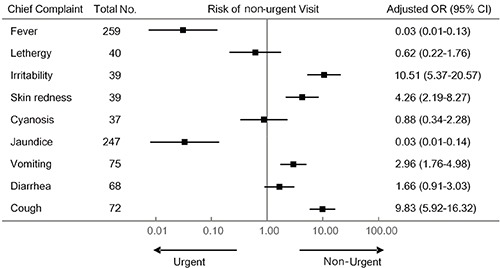
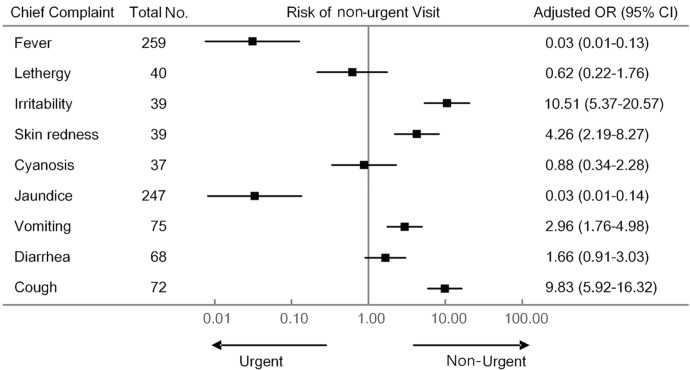
Multivariable analysis was performed using logistic regression in order to investigate the correlation between chief complaints and non-urgent visits (Fig. 2). The OR indicates the odds of non-urgent visit in the presence of each symptom in relation to the odds of non-urgent visit in the absence of the symptom. The OR for each symptom was adjusted with previous variables (Table 2), and was calculated only when the number of subjects was more than 30. The subgroup whose chief complaint was irritability, cough, skin redness, and vomiting was significantly associated with non-urgent visits. On the contrary, when the chief complaint was fever or jaundice, the OR was significantly low.
Fig 2
Plot of adjusted ORs with 95% CIs for the risk of non-urgent visit according to chief complaint. The subgroup whose chief complaint was irritability, cough, skin redness, and vomiting was significantly associated with non-urgent visits. On the contrary, when the chief complaint was fever or jaundice, the OR was significantly low. Plotted with logarithmic scales. Adjusted for sex, age, mode of birth, prematurity, weight, residence, referral route, visit time.
OR = odds ratio, CI = confidence interval.
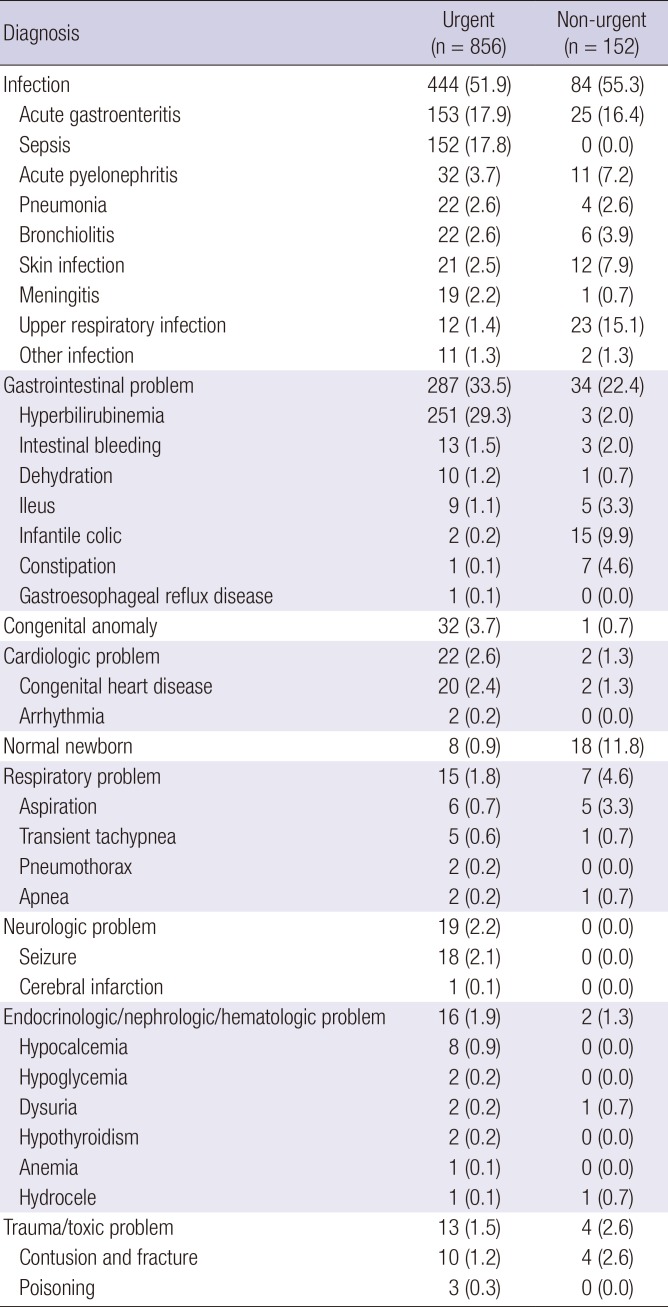
Final diagnoses on discharge from the ED were classified according to organ systems and compared between the two groups (Table 4). Infection was the most common diagnosis, at 52.1% and 55.3% in the urgent and non-urgent groups respectively, and diagnoses of GI disorders were the second most common, at 33.4% and 22.4% respectively. Diagnosis of normal neonate was 11.8% in the non-urgent group, which was 0.8% higher than in the urgent group.
Table 4
Diagnoses according to systems by urgent/non-urgent visits (from the most to the least frequency)
DISCUSSION
As neonates visit the ED with various non-specific symptoms, it may be challenging for physicians to distinguish non-urgent cases from potentially fatal cases. This study is important because the size of the sample is greater than that of previous neonatal studies. Therefore, our results are more helpful to assess neonatal visits to the ED according to their basic characteristics and chief complaints.
The proportion of non-urgent neonatal visits in this study was 15.1%, which was lower than 49% reported by Kennedy et al. (8) and 44.3% reported by Batu et al. (9). There were more referrals from other hospitals compared to previous studies. The rate of referral from other hospitals in this study was 63%, which was higher than the 28% in Kennedy et al.'s study (8) and 20% in Batu et al.'s study (9). Because the referred patients tended to go through further examinations or hospitalization, they were usually classified as the urgent group. It is this reason that the non-urgent group was relatively small compared with previous studies. In our city, there are many private pediatric clinics that patients can easily visit until evening time. Also our national health insurance system usually covers most neonatal diseases. Due to these factors, neonates firstly visit local pediatric clinics and then truly urgent patients are referred to the tertiary hospital emergency center. Results of the multivariable analysis of this study show that voluntary visits rather than patient referrals were highly associated with the non-urgent group (OR, 5.96), and similarly high results were presented by other studies (910).
Neonatal residence was also different between the urgent and non-urgent groups. ED visits from home had 2.18 times higher odds to be non-urgent than visits from facilities (hospitals/postnatal care centers). While the parent without any medical knowledge at home might decide whether or not to go to the emergency center, the judgment of experienced staff or medical professionals in other facilities was helpful in determining the urgency of symptoms. Results of previous studies also support this finding; Boulvain et al. (11) reported that readmission within 6 months after birth was 2.61 times higher from the home-based care group than from the hospital-based care group, and Paul et al. (12) reported that neonatal ED visits due to jaundice and dehydration could be reduced by 100% by home visits from nurses.
Non-urgent visits were more frequent at evening and night than during daytime, which was similar to previous studies (13); it has been hypothesized that while primary medical facilities are easily accessible during the day, EDs are only accessible during the night. For this reason, non-urgent visits were increased at night. The proportion of premature neonates was higher in the urgent group in previous studies (91014). In our study, it was 6.9% in the urgent group and 5.9% in the non-urgent group, although there was no statistical difference between the groups (P = 0.860). However, the proportion of premature neonates included is too small to assess the difference between the groups. Considering that the period of hospital stay may be more than a month for premature neonates, and the subjects of this study were the neonates younger than 28 days old, many potential patients might not have been recruited. Moreover, because many neonates may be transferred to the NICU directly when born prematurely and were excluded from this study, the results may reflect the particular characteristics of our hospital. The proportion of urgent visits were higher when patients were younger and had lower weight, but there was no association with sex, mode of delivery, and weight at birth. The results were similar to those of previous studies (913).
In this study, more than 50% of visits were due to fever or jaundice in the urgent group, while the main symptoms in the non-urgent group were cough, irritability, and vomiting. In previous studies, jaundice was the most common presentation in ED, followed by irritability and fever which accounts for 4% (910). Normal newborn was the most common final diagnosis in the urgent group of previous studies, followed by hyperbilirubinemia and colic, but in our study, infection was the most common presentation, followed by GI complaints. Hyperbilirubinemia was the most common final diagnosis in the urgent group, followed by pneumonia and sepsis. The reason why the distribution of our final diagnoses was different from other studies is that the urgency was higher and there were more cases of severe diseases because of higher rate of referrals than voluntary visits. Of final diagnoses in the non-urgent group, GI disorders accounted for 22.4%, and normal, including mild conditions such as irritability, vomiting, diarrhea, lactating method, and skin rash, were 11.8%; these findings were similar to the results of a previous study (15).
The results of this study show that it is essential to examine and quickly treat neonates, bearing in mind that referrals from other hospitals, daytime visits, and visits from a postnatal care center or hospital care can require urgent care. It is particularly necessary to carefully examine patients whose chief complaints are fever and jaundice. However, non-urgent visits are associated with patient visit from home, direct visits without referrals, visits at evening or night and may have frequent presentations of cough, vomiting, skin rash, and irritability. It is essential to reduce unnecessary workup through taking thorough history and performing a detailed physical examination. Accordingly, this may result in reduction of length of stay and unnecessary burden on the emergency physician. Also, early neonates can be protected from many infection sources in the ED. Additionally, using our results, comprehensive efforts would need to be put in place to educate caregivers in understanding neonatal symptoms, focusing on presentations that are often mistaken for urgent symptoms.
This study has several limitations. Because the retrospective analysis was based on medical records, potential influencing factors identified in previous studies, such as caregiver factors including social or educational levels of parents, were not included. Also, we could not analyze ED revisits or outpatient visits. Moreover, because our hospital's NICU takes patients from a wide geographical area, 1,218 medical records related to NICU admissions via the ED were excluded. Further prospective studies are needed to confirm the findings of our study.
In conclusion, referrals, daytime visits, and neonates presenting with fever or jaundice were urgent patients who needed rapid treatment. Non-urgent visits were common in self-referral, night-time visits, and neonates with coughs. For non-urgent visits, emergency physicians need to try to reduce unnecessary workup and length of stay in the ED.
 XML Download