

 PDF
PDF Citation
 Print
Print


INTRODUCTION
Several significant hemodynamic changes such as closure of patent ductus arteriosus (PDA) and increase of pulmonary blood flow take place during the transition period from fetal to neonatal environment.1 PDA usually closes within 24–48 hours after birth in full-term infants while cardiac parameters show radical progression within 48 hours after birth.2 Therefore, neonatal hemodynamic changes are dramatic during this transitional period not only in normal full-term neonates, but also in abnormal high-risk infants. It is important to understand these changes of cardiac hemodynamics.
Many studies have characterized changes of cardiac function assessed by echocardiography during fetus-to-neonate transition.34 Many studies have evaluated systolic and diastolic ventricular function of children and neonates using tissue Doppler imaging (TDI).567 Some studies have highlighted the importance of hemodynamic changes in neonates during the transitional period. However, hemodynamic investigations have not been focused on very early transitional time with chronological changes simultaneously. Therefore, the objective of this study was to evaluate serial changes in full-term healthy infants at 12-hour intervals within postnatal 72 hours using echocardiography. This study focused on the very early changes within postnatal 72 hours and observed short-term changes at 12-hour intervals to evaluate cardiac morphometric, functional, systolic, diastolic, and TDI parameters. Results of this study can serve as clinical basis to study high-risk full-term and preterm neonates with unstable hemodynamics during the early transitional period.
METHODS
Participants and study design
A total of 56 full-term neonates (37–42 weeks gestational age) were recruited at Korea University Ansan Hospital between April 2015 and November 2015. None of these 56 neonates needed prolonged oxygen support, positive pressure ventilation, complex circulatory, and respiratory support. These 56 neonates were classified into two groups (groups A and B) and they were assessed serially three times at 12-hour intervals during postnatal 0–72 hours. Continuous ratio variables were changed into the continuous interval variables (12-hour intervals) for stratification according to postnatal periods. Echocardiographic parameters in group A were measured at postnatal 0–12, 24–36, and 48–60 hours. The same parameters in group B were measured at postnatal 12–24, 36–48, and 60–72 hours. The reason why the groups A and B are divided is to minimize diurnal variations such as blood pressure (BP), heart rates and these neonates were examined from 9 a.m. to 12 p.m.
BP was measured in the left leg using automated oscillometric method. Those who had specific cardiac diseases that might influence systemic vascular resistance were excluded. There was no specific feeding intervention or fluid administration that could change hemodynamic conditions of hypovolemia and hypervolemia. All subjects were full-term neonates (38 to 42 weeks gestation) with appropriate birth weight for gestational age.
Echocardiographic methods
One investigator performed all echocardiographic scans using standard techniques. Echocardiography scans were performed with a Vivid Q device (General Electric Company, Boston, MA, USA) and a 7-MHz probe. Infants were placed in supine position on a flat surface. Echocardiographic parameters were measured at rest or during sleep to minimize crying.
PDA sizes have been measured by means of 2 dimensional images assisted by color Doppler images in the parasternal short-axis or high parasternal short-axis view (PSSV) in echocardiography. Left atrial to aortic root ratio (LA/Ao) was obtained with M-mode pictures of the left atrium and a parasternal long-axis view (PSLV) of the aortic root. Left atrial and aortic root diameters were measured using incorporated measurement calipers.89 Peaks of early diastolic flow velocities (E) and late diastolic flow velocities (A) were measured at mitral and tricuspid inflow during diastole. To obtain mitral and tricuspid E and A, the sample volume was placed in the inflow tip of each valve in the apical four chamber view (A4CV) of conventional pulsed wave Doppler. TDI parameters and wall motional velocities of the myocardium were measured with a pulsed-wave Doppler. Peak annular velocities during early diastole (E′), late diastole (A′), and during systole (S′) were measured at interventricular septum (IVS), lateral mitral annulus of the left ventricle (LV), and lateral tricuspid annulus of the right ventricle (RV), respectively, in A4CV. Transducer beam was placed in parallel as close as possible to the Doppler beam to reduce angle correction of Doppler signal.10 Each parameter was measured three times in consecutive cardiac cycles. Their mean values were used for statistical analysis.
Epicardial and endocardial borders of the LV myocardium on the PSSV were traced to measure LV end-diastolic volume (EDV), LV end-systolic volume (ESV), LV end-diastolic dimension (EDD), and end-systolic dimension (ESD). These values were measured three times. Their mean values were used to calculate LV ejection fraction (EF) and fractional shortening (FS) using the following equation 1.10

Velocity time integral (VTI) of superior vena cava (SVC) flow was used with pulsed wave Doppler at a low sub-costal view. Integrated SVC VTI was the sum of positive forward flow deducted from negative reverse flow. SVC diameter was assessed at the true sagittal plane in PSLV as close to the midline as possible to acquire direct anteroposterior view of the SVC. Maximal and minimal SVC diameters were assessed at each cardiac cycle. Their mean values were used to quantify SVC flow volume. SVC flow was calculated using equation 2.911

Mitral valve (MV) closure to opening time (MCO), LV ejection time (ET), and LV myocardial performance index (MPI), tricuspid valve closure to opening time (TCO), RV ET, and RV MPI were calculated using equation 3.

LV and RV EDV were assessed using biplane Simpson's method in the A4CV and two-chamber views as described previously.12
Statistical analysis
The mean of three measured values was calculated. Mean values of parameters were used for calculation using equations. These mean values of parameters were compared among postnatal hours using Mann-Whitney U test, a nonparametric test. P values of less than 0.05 were considered statistically significant. SPSS® (version 12; IBM Corp., Chicago, IL, USA) was used for all statistical analyses.
RESULTS
Intra-observer variability
There were no significant differences in measurements performed by the same observer for all parameters with interval of 5–10 minutes (median value differences: P > 0.05). Median variability between measurements was within 10% for all parameters and 90% of measurements were within approximately 20% of each other.
Measured data
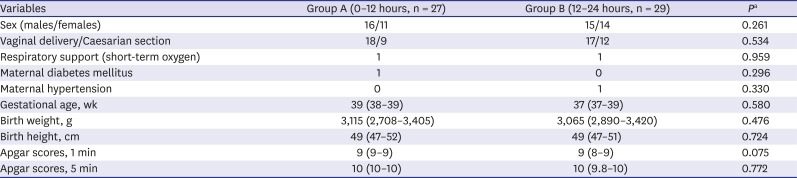
The demographic and clinical characteristics of all initially enrolled neonates at postnatal 0–12 and 12–24 hours in groups A and B are showed. There were no differences between groups A and B in demographic and clinical parameters; gender, delivery types, respiratory support, maternal diabetes mellitus, maternal hypertension, gestational ages, birth weight, birth height, and Apgar scores which were verified by χ2 test and Mann-Whitney U test (all P > 0.05) (Table 1).
Table 1
Demographic and clinical characteristics of full-term infants at immediate postnatal 0–12 and 12–24 hours (represented as medians with quartiles)
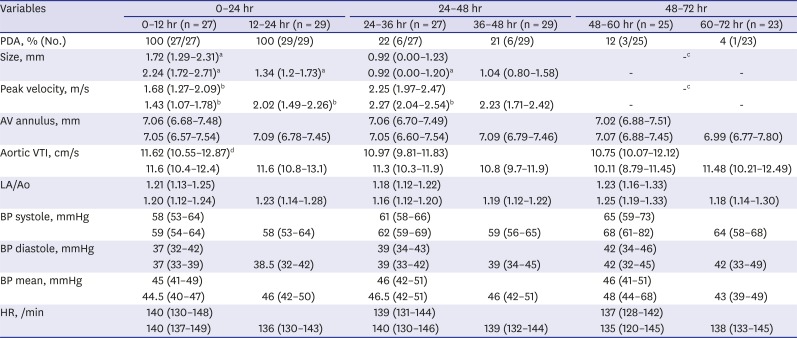
Chronological changes of PDA and PDA-induced enlarged structures of aortic valve, aorta, and left atrium (left-sized volume overload influenced by PDA) are summarized. PDA size was gradually decreased from birth to 72 hours and PDA within postnatal 24 hours was substantially patent. PDA sizes during 0–24 hours was more significantly patent compared with those during 24–48 hours (P < 0.001). Hemodynamic closure of PDA showed gradual decrease of sizes every 12-hour interval from postnatal 0–36 hours (0–12 hours vs. 12–24 hours, P < 0.001; 12–24 hours vs. 24–36 hours, P = 0.001). However, the hemodynamic changes of size of PDA were not significant between 24–36 hours and 36–48 hours (P = 0.669). Most PDAs after postnatal 48 hours have spontaneously closed (patent PDA, 12% [3/25] at 48–60 hours and 4% [1/23] at 60–72 hours) (Table 2).
Table 2
Chronological changes of PDA and PDA-induced enlarged structures of aortic valve, aorta, and left atrium (represented as medians with quartiles)
There were no significant differences among any postnatal hours in BP and HR.
PDA = patent ductus arteriosus, AV = aortic valve, VTI = velocity time integral, LA/Ao = left atrial to aortic root ratio, BP = blood pressure, HR = heart rate.
aPDA size: 0–24 hours increased significantly compared with 24–48 hours (P < 0.001) (0–12 hours vs. 12–24 hours, P < 0.001; 12–24 hours vs. 24–36 hours, P = 0.001; 24–36 hours vs. 36–48 hours, P = 0.669; 36–48 hours vs. 48–60 hours, P = 0.243; 48–60 hours vs. 60–72 hours, P = 0.655); bPDA velocity: 0–24 hours decreased significantly compared with 24–48 hours (P = 0.003) (0–12 hours vs. 12–24 hours, P = 0.003*; 12–24 hours vs. 24–36 hours, P = 0.049; 24–36 hours vs. 36–48 hours, P = 0.699; 36–48 hours vs. 48–60 hours, P = 0.739; 48–60 hours vs. 60–72 hours, P = 0.987); cMedian values of PDA sizes and velocities are meaningless because most PDAs have closed during postnatal 48–60 hours; dAortic VTI: 0–24 hours increased significantly compared with 24–48 hours (P = 0.018) (0–12 hours vs. 12–24 hours, P = 0.909; 12–24 hours vs. 24–36 hours, P = 0.231; 24–36 hours vs. 36–48 hours, P = 0.222; 36–48 hours vs. 48–60 hours, P = 0.694; 48–60 hours vs. 60–72 hours, P = 0.212).
Peak velocities of PDA have gradually increased with the passage of time from birth to the time before closed PDA. Peak velocities of PDA during 24–48 hours were significantly increased compared with those during 0–24 hours (0–24 hours vs. 24–48 hours, P = 0.003). The peak velocity of PDA showed significant changes every 12-hour interval from postnatal 0–36 hours (0–12 hours vs. 12–24 hours, P = 0.003; 12–24 hours vs. 24–36 hours, P = 0.049). However, peak velocities of PDA were not significant between 24–36 and 36–48 hours (P = 0.699). Most PDAs after postnatal 48 hours have spontaneously closed (Table 2).
Values of aortic VTI during 24–48 hours were significant decreased compared with those during 0–24 hours (P = 0.018). However, they did not show significant differences between 0–12 and 12–24 hours (P = 0.909), and between 12–24 and 24–36 hours (P = 0.231). Also, they did not show significant changes after postnatal 24 hours (24–36 hours vs. 36–48 hours, P = 0.222; 36–48 hours vs. 48–60 hours, P = 0.694; 48–60 hours vs. 60–72 hours, P = 0.212). Values of aortic annulus and LA/Ao did not show significant increases among different intervals. Vital signs associated with heart condition are heart rate and BP. They did not show significant differences among all groups during postnatal 0–72 hours at 12-hour intervals (Table 2).
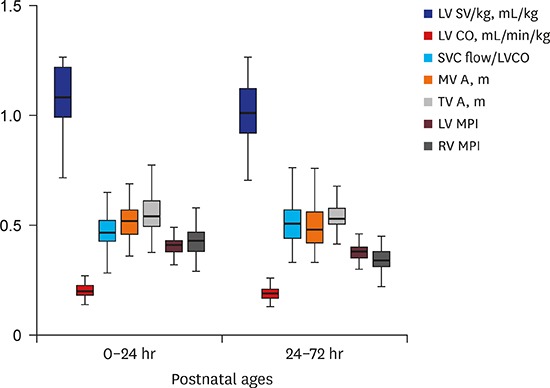
Chronological changes of systemic venous return and systemic CO were measured in SVC and LV. SVC diameter and flow, systolic functional parameters (EF, FS) in LV, or the ratio of SVC flow to LV CO (SVC flow/LV CO) did not show significant differences from postnatal 0–72 hours. However, LV stroke volume (SV) and LV CO per initial body weight (SV/kg, CO/kg) were gradually decreased from postnatal 0–72 hours. LV SV/kg and CO/kg during 0–24 hours were significantly increased compared with those during 24–48 hours (P = 0.033 and P = 0.036, respectively; Table 3).
Table 3
Chronological changes of systemic venous return and systemic CO in the SVC and LV (represented as medians with quartiles)
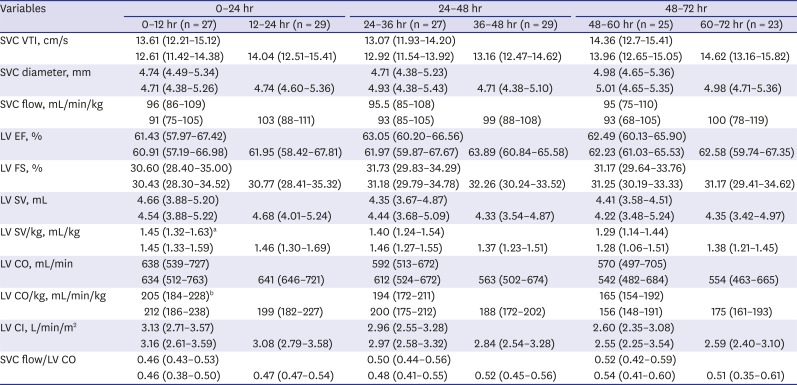
CO = cardiac output, SVC = superior vena cava, VTI = velocity time integral, LV = left ventricle, EF = ejection fraction, FS = fractional shortening, SV = stroke volume, CI = cardiac index.
aLV SV/kg: 0–24 hours increased significantly compared with 24–48 hours (P = 0.033) (0–12 hours vs. 12–24 hours, P = 0.634; 12–24 hours vs. 24–36 hours, P = 0.167; 24–36 hours vs. 36–48 hours, P = 0.304; 36–48 hours vs. 48–60 hours, P = 0.148; 48–60 hours vs. 60–72 hours, P = 0.245); bLV CO/kg: 0–24 hours increased significantly compared with 24–48 hours (P = 0.036) (0–12 hours vs. 12–24 hours, P = 0.749; 12–24 hours vs. 24–36 hours, P = 0.469; 24–36 hours vs. 36–48 hours, P = 0.201; 36–48 hours vs. 48–60 hours, P = 0.264; 48–60 hours vs. 60–72 hours, P = 0.483).
Serial changes in MV and TV diastolic parameters and TDI parameters in LV, RV, and IVS are shown in Table 4. E, A, and E/A ratio in MV and TV pulsed Doppler did not show significant changes from postnatal 12–72 hours. Median E/A in MV within postnatal 0–12 hours was 0.85 (< 1). Median ranges of E/A in TV from postnatal 0–72 hours was 0.77–0.79 (< 1). LV E/E′ was significantly higher compared to RV E/E′ at each 12-interval groups (P < 0.05 in each group). E′, A′, and S′ in LV, RV, and IVS did not show significant changes from postnatal 12–72 hours. However, E′, A′, and S′ in LV were decreased compared to those in RV.
Table 4
Chronological changes of diastolic parameters and TDIs in LV, RV, and IVS (represented as medians with quartiles)
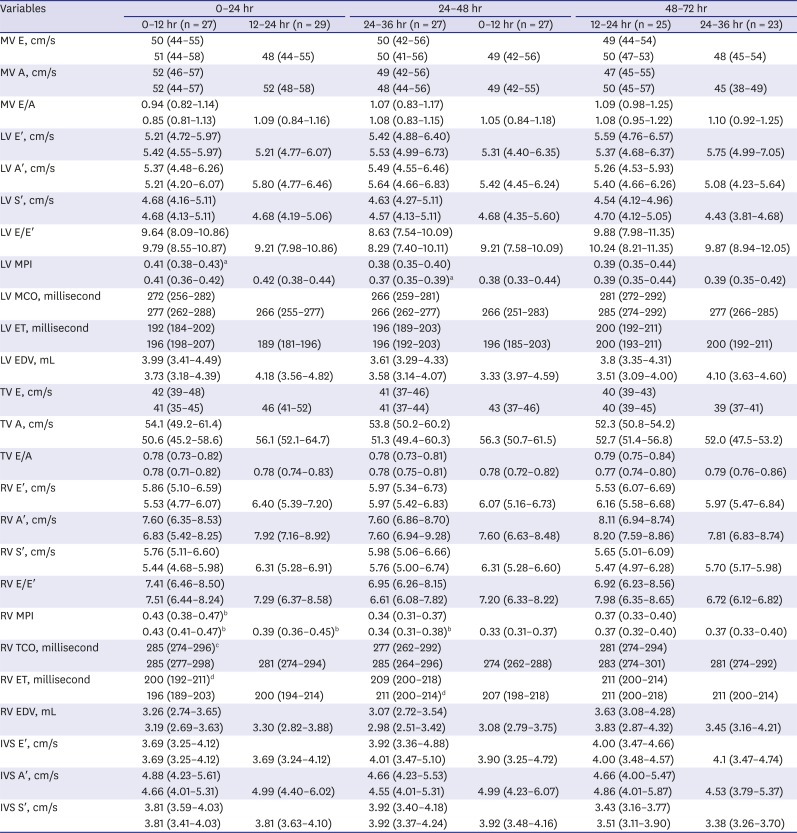
TDI = tissue Doppler imaging, LV = left ventricle, RV = right ventricle, MV = mitral valve, TV = tricuspid valve, IVS = interventricular septum, E = peaks of early diastolic flow velocities, A = peaks of late diastolic flow velocities, E′ = peak annular velocities during early diastole, A′ = peak annular velocities during late diastole, S′ = peak annular velocities during systole, MPI = myocardial performance index, MCO = mitral valve closure to opening time, TCO = tricuspid valve closure to opening time, ET = ejection time, EDV = end diastolic volume.
aLV MPI: 0–24 hours increased significantly compared with 24–48 hours (P = 0.001) (0–12 hours vs. 12–24 hours, P = 0.650; 12–24 hours vs. 24–36 hours, P < 0.001; 24–36 hours vs. 36–48 hours, P = 0.293; 36–48 hours vs. 48–60 hours, P = 0.982; 48–60 hours vs. 60–72 hours, P = 0.516); bRV MPI: 0–24 hours increased significantly compared with 24–48 hours (P < 0.001) (0–12 hours vs. 12–24 hours, P = 0.019; 12–24 hours vs. 24–36 hours, P = 0.001; 24–36 hours vs. 36–48 hours, P = 0.582; 36–48 hours vs. 48–60 hours, P = 0.442; 48–60 hours vs. 60–72 hours, P = 0.845); cRV TCO: 0–24 hours increased significantly compared with 24–48 hours (P = 0.017) (0–12 hours vs. 12–24 hours, P = 0.324; 12–24 hours vs. 24–36 hours, P = 0.599; 24–36 hours vs. 36–48 hours, P = 0.270; 36–48 hours vs. 48–60 hours, P = 0.147; 48–60 hours vs. 60–72 hours, P = 0.358); dRV ET: 0–24 hours decreased significantly compared with 24–48 hours (P = 0.002) (0–12 hours vs. 12–24 hours, P = 0.354; 12–24 hours vs. 24–36 hours, P = 0.042; 24–36 hours vs. 36–48 hours, P = 0.510; 36–48 hours vs. 48–60 hours, P = 0.321; 48–60 hours vs. 60–72 hours, P = 0.235).
LV MPI during 0–24 hours was significantly higher than that during 24–48 hours (P = 0.001). LV MPI showed significant decreases between 12–24 and 24–36 hours (P < 0.001). However, LV MPI did not show significant changes between 0–12 and 12–24 hours (P = 0.650), and also they did not show significant changes after postnatal 24 hours (24–36 hours vs. 36–48 hours, P = 0.293; 36–48 hours vs. 48–60 hours, P = 0.982; and 48–60 hours vs. 60–72 hours, P = 0.516, respectively). Values of RV MPI during 0–24 hours were significantly higher compared with those during 24–48 hours (P < 0.001). Changes of RV MPI between 0–24 and 24–48 hours might be due to changes of RV TCO and ET (RV TCO between 0–24 hours and 24–48 hours, P = 0.017; RV ET between 0–24 and 24–48 hours, P = 0.002). RV MPI showed gradual decreases every 12-hour interval (0–12 hours vs. 12–24 hours, P = 0.019; 12–24 hours vs. 24–36 hours, P = 0.001). However, RV MPI did not show significant changes after postnatal 24 hours (24–36 hours vs. 36–48 hours, P = 0.582; 36–48 hours vs. 48–60 hours, P = 0.442; and 48–60 hours vs. 60–72 hours, P = 0.845, respectively) (Table 4).
The aortic VTI, LV SV/kg, LV CO/kg, LV MPI, and RV MPI showed significant changes at postnatal 24 hours according to the physiological closure of PDA. The changes of measured parameters were compared between before 24 hours (postnatal 0–24 hours) and those after 24 hours (24–72 hours). Systolic BP, cardiac index (CI), SVC flow/LV CO, mitral A and tricuspid A showed significantly dramatic changes between postnatal 0–24 and 24–72 hours (all P < 0.05) as well as preexisting chronological changes of PDA, aortic VTI, SV, CO, and MPI (Table 5).
Table 5
The changes of morphometric, systolic and diastolic parameters with TDIs in LV, RV, and IVS according to the physiological closure of PDA at postnatal 24 hours (represented as medians with quartiles)
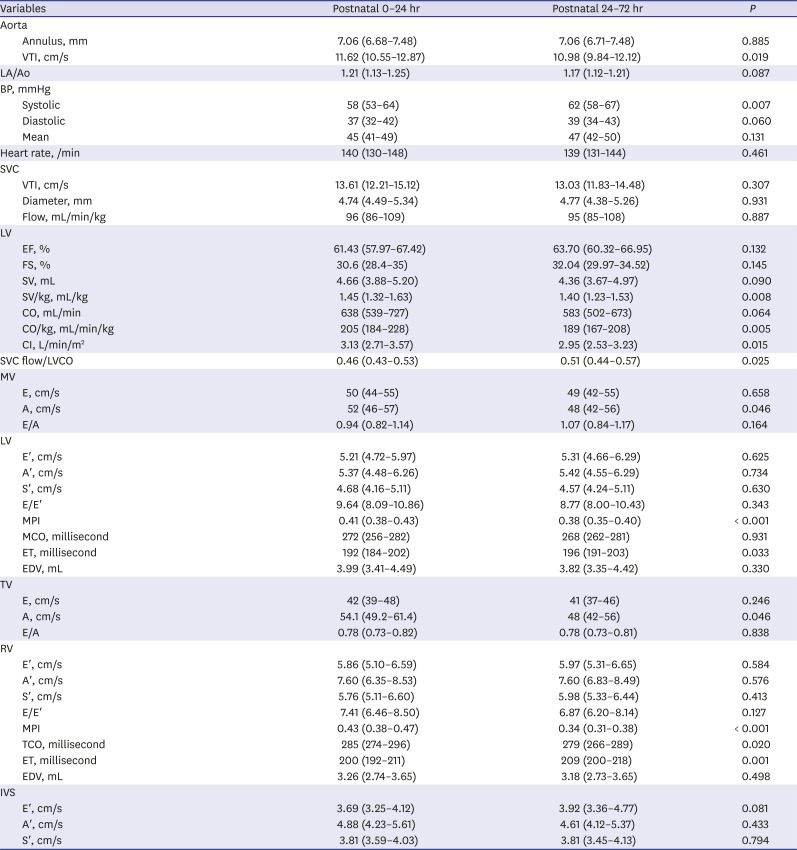
TDI = tissue Doppler imaging, LV = left ventricle, RV = right ventricle, IVS = interventricular septum, PDA = patent ductus arteriosus, VTI = velocity time integral, LA/Ao = left atrial to aortic root ratio, BP = blood pressure, SVC = superior vena cava, EF = ejection fraction, FS = fractional shortening, SV = stroke volume, CO = cardiac output, CI = cardiac index, MV = mitral valve, E = peaks of early diastolic flow velocities, A = peaks of late diastolic flow velocities, E′ = peak annular velocities during early diastole, A′ = peak annular velocities during late diastole, S′ = peak annular velocities during systole, MPI = myocardial performance index, MCO = mitral valve closure to opening time, ET = ejection time, EDV = end diastolic volume, TV = tricuspid valve, TCO = tricuspid valve closure to opening time.
All PDAs were patent during postnatal 0–24 hours (100%) and a small number of PDAs were patent during postnatal 48–72 hours (4%–12%). A considerable number of PDAs were patent during postnatal 24–48 hours (21%–22%) (Table 2). The changes of morphometric, systolic, diastolic, and tissue Doppler parameters were compared between open PDA and closed PDA during postnatal 24–48 hours. Aortic VTI, LA/Ao, and EDV in open PDA group showed significant increases compared with those in closed PDA group (all P < 0.05, Table 6).
Table 6
The changes of morphometric, systolic and diastolic parameters with TDIs in LV, RV, and IVS according to open and closed conditions of PDA during postnatal 24–48 hours (represented as medians with quartiles)
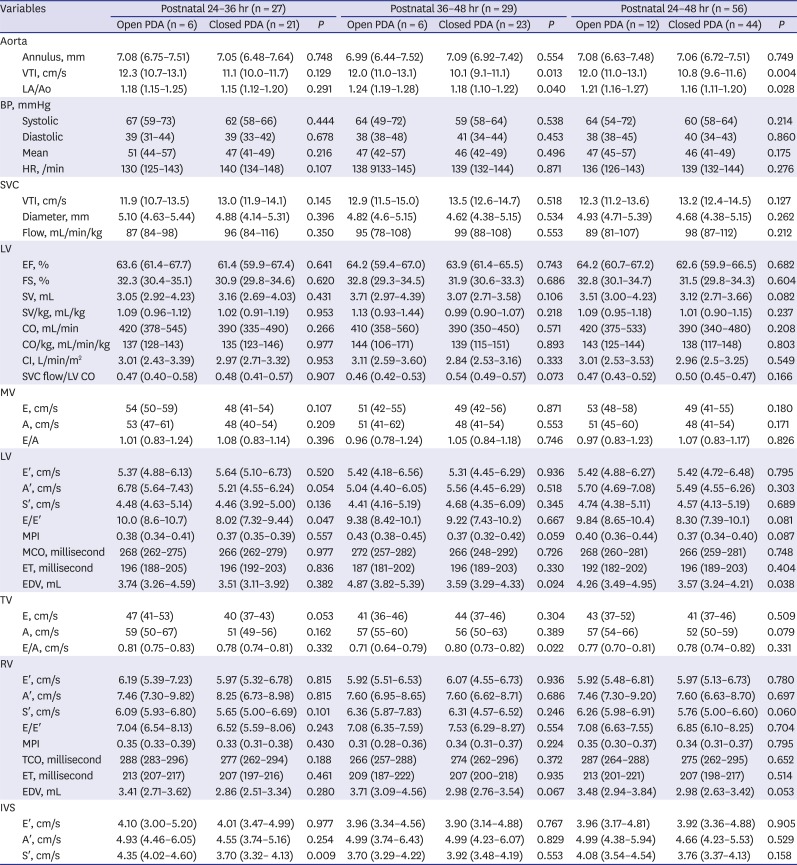
TDI = tissue Doppler imaging, LV = left ventricle, RV = right ventricle, IVS = interventricular septum, PDA = patent ductus arteriosus, VTI = velocity time integral, LA/Ao = left atrial to aortic root ratio, BP = blood pressure, HR = heart rate, SVC = superior vena cava, EF = ejection fraction, FS = fractional shortening, SV = stroke volume, CO = cardiac output, CI = cardiac index, MV = mitral valve, E = peaks of early diastolic flow velocities, A = peaks of late diastolic flow velocities, E′ = peak annular velocities during early diastole, A′ = peak annular velocities during late diastole, S′ = peak annular velocities during systole, MPI = myocardial performance index, MCO = mitral valve closure to opening time, ET = ejection time, EDV = end diastolic volume, TV = tricuspid valve, TCO = tricuspid valve closure to opening time.
DISCUSSION
We can consider group A as the same with group B because there are no differences between groups A and B in demographic and clinical parameters such as gender, delivery types, gestational ages, birth weight, birth height, Apgar scores, BP, and heart rate (Table 1). Therefore, we adopted groups A and B as same chronological data.
Previous studies have reported normal values of neonatal BP in preterm and term babies.1314 Our study showed that systolic, diastolic, or mean BP did not show significant changes between postnatal periods. Our BP values were between those of pre-term and late full-term neonates. BP values in healthy full-term measured in this study can be used as baseline data for comparison with those of sick term and preterm neonates. Also, systolic BP before postnatal 24 hours showed significant decreases compared with those after postnatal 24 hours in our study (Table 5). The increase of systolic BP after postnatal 24 hours is associated with the hemodynamic closure of PDA as BP was observed at the (left) leg in our study. Actual BP of lower extremity can be decreased due to shunt blood although SV and CO can be increased in condition with opened PDA. Therefore, increase of systolic BP after postnatal 24 hours is inevitable outcome according to the physiological closure of PDA.
Hemodynamic closure of PDA usually occurs within 48 hours after birth.2 Our study showed the similar pattern with previous studies because PDA sizes were decreased and PDA peak velocities were increased due to ductal constriction before postnatal 48 hours (Table 3). However, the critical time of hemodynamically physiological closure of PDA is not identical compared with previous study with postnatal 48 hours. PDA size showed gradually chronological decreases through postnatal 0–24 hours but it did not show significant changes after postnatal 24 hours in our study (12–24 hours vs. 24–36 hours, P = 0.001; 24–36 hours vs. 36–48 hours, P = 0.669). It needs to focus on the period of postnatal 24 hours in our study. PDA sizes after postnatal 24 hours showed significantly chronological and dramatic decreases compared with those before postnatal 24 hours (Tables 2 and 5). Peak velocities of PDA also showed the same patterns as PDA sizes. Therefore, our results suggest strongly that postnatal 24-hour is hemodynamically critical time for physiologic closure of PDA instead of postnatal 48 hours.
Aortic VTI is needed to calculate SV and CO because SV = maximal VTI at the aortic valve (AV) level × the cross-sectional area of the AV and CO = SV × HR.15 If ductus arteriosus is hemodynamically open, left-sided volume overload can occur. Left-sided structures and parameters associated with LA, LV, and aorta are then enlarged. Therefore, aortic VTI, LA/Ao, SV, and CO can be significantly increased by hemodynamic PDA.1617 Aortic VTIs before postnatal 24 hours showed significant increases compared with those after postnatal 24 hours chronologically and dramatically (Tables 2 and 5). Our results suggest that aortic VTI shows the same change at postnatal 24 hours simultaneously with physiologic change of PDA at postnatal 24 hours. The hemodynamic closure of PDA decreased extra-volume of pulmonary venous return and it decreased LV SV or LV CO in a cascading pattern. Therefore, the decrease of aortic VTI after postnatal 24 hours was associated with the hemodynamic closure of PDA. However, anatomical parameters such as AV annulus and LA/Ao in comparison with functional parameters such as aortic VTI, SV, and CO did not show changes according to hemodynamically physiologic change of PDA. Whether anatomical parameters will significantly change with hemodynamic change of PDA needs to be determined in further studies.
SV and CO of LV (per body weight) before postnatal 24 hours showed significant increases compared with those after postnatal 24 hours in our study. Changes of these parameters are due to transient left-sided volume overload caused by increased PDA flow during the transitional period.18 Our results suggest that LV SV and LV CO are significantly decreased at postnatal 24 hours according to the time of physiological closure of PDA. The chronological and dramatic changes of LV SV, LV CO, and LV CI after postnatal 24 hours showed the same change simultaneously with physiological closure of PDA after postnatal 24 hours (Tables 2 and 5). Our study is meaningful in terms of stratifying chronological and dramatic changes of LV SV, LV CO, and LV CI according to physiologic closure of PDA within early postnatal period with short-term intervals.
Diastolic parameters of MV E/A show inversed values (< 1) during fetal life and normal value (> 1) during neonatal period. They show increased normal values with advancing ages.1920 In our study, MV E, A, and E/A showed normal transition from fetal to neonatal life. MV E/A within postnatal 12 hours showed inversed value and it then returned to normal value after 12 hours. These results suggest that MV E, A, and E/A as diastolic parameter can be used as baseline data of normal transitional hemodynamics from fetus to neonate.
TV pulsed Doppler and TDI studies have been performed for preterm and term neonates. A tricuspid E/A ratio < 0.8 suggests impaired relaxation while an E/A ratio of 0.8–2.1 with an E/E′ ratio > 6 suggests pseudo-normal filling in adults.212223 During the neonatal period, RV has 13%–25% thicker wall than LV wall. However, neonatal cardiac muscle is less compliant than that of adults.1 In our study, TV E/A and TV E/E′ median ranges were 0.77–0.79 and 6.72–7.51, respectively. They could be considered as normal transitional patterns based on neonatal reference. However, they could be considered as abnormal relaxation or pseudo-normal filling based on adult reference. These results suggest that less compliance of neonatal RV can influence transient changes of TV E/A, E/E′, and impaired RV relaxation.
Decreases of E′, A′, and S′ reflect global systolic and diastolic function while an elevated E/E′ ratio indicates diastolic dysfunction.2425 A previous study has revealed that peak velocities of E′, A′, and S′ in LV TDI are lower than those in RV TDI while LV E/E′ is significantly higher than RV E/E′.26 Our result also showed the same pattern. It can be interpreted that the LV during early transitional period represents a relative diastolic dysfunction in term neonates.
MPI is a well-known parameter reflecting global cardiac function. Increased MPI is correlated with global ventricular dysfunction.27 Our results revealed that MPI in both LV and RV before postnatal 24 hours showed significant increases compared with those after postnatal 24 hours chronologically and dramatically (Tables 2 and 5). This suggests that increased MPIs in LV and RV can signify transient adaptive dysfunction during the early transitional period. They might be associated with changes of PDA, aortic VTI, SV, and CO within postnatal 24 hours.
SVC flow is a novel marker of systemic blood flow at time of closed PDA.28 Our result showed that SVC flow/LV CO during 24–72 hours showed significantly increases compared with postnatal 0–24 hours although each SVC flow and LV CO did not show significant differences. Therefore, the increase of SVC flow/LV CO after postnatal 24 hours was associated with the hemodynamically physiologic closure of PDA.
SVC flow, SVC VTI, EF, FS, SV, LV CO, and ratio of SVC/LV CO have been investigated in term and preterm neonates through cardiac magnetic resonance imaging and echocardiography.29303132 These values were slightly different but grossly similar patterns compared with results of our study. It is known that they can show differences by multiple causes, including gestational age, birth weight, medical conditions, PDA flow, and imaging modalities.3334 Our results are meaningful in that chronologic neonatal changes of systolic, diastolic, and TDI parameters are represented within early postnatal period with short-term intervals. They can be used to compile normal baseline data of neonates.
Aortic VTI, LA/Ao, and EDV in open PDA group showed significant increases compared with those in closed PDA group but other parameters associated with hemodynamically significant PDA were not prominent during postnatal 24–48 hours. PDAs during postnatal 24–48 hours are located in the process of gradually physiological closure and only some parameters such as aortic VTI, LA/Ao, and EDV showed significant changes. It should be investigated more whether those parameters can be the markers of physiological closure of PDA.
The main limitation of the study was that we did not have enough time to observe hemodynamics beyond the transitional period but we have observed echocardiographic changes during the short period of postnatal 0–72 hours. However, we have considered postnatal 0–72 hours as enough time to observe the changes of hemodynamics associated with PDA. Longer observation time should be contributed in further studies. In addition, 12-hour interval during transitional period might not be enough to deal with detailed changes. More detailed intervals should be used in future studies.
In conclusion, postnatal 24 hours can be used as a new critical time for hemodynamic closure of PDA instead of postnatal 48 hours. The increase of systolic BP after postnatal 24 hours is inevitable outcome according to the physiological closure of PDA. Functional parameters of aortic VTI, LV SV, LV CO, LV CI and SVC flow/LV CO after postnatal 24 hours showed significantly chronological and dramatic decreases compared with those before postnatal 24 hours according to physiological closure of PDA at the same time as postnatal 24 hours. However, anatomical parameters such as AV annulus or LA/Ao did not show changes according to physiological closure of PDA. MV E/A, TV E/A, and TV E/E′ have showed similar pattern with normal transition from fetal to neonatal life and these results can be used as baseline data of normal transitional hemodynamics from fetus to neonate. Increased MPI in LV and RV can signify transient adaptive dysfunction and they might be associated with physiological closure of PDA during the early transitional period. Chronological and dramatic changes of systolic, diastolic, and TDI parameters which are presented during early postnatal period can be used to compile normal baseline data of healthy full-term neonates.
 XML Download