I. Introduction
Modern society is characterized by the trend of rapid increase in the number of sleep disorder patients due to stress and obesity as well as rapid increase in the number of aged people. According to the analysis of data on the payment of cost of health insurance treatment from 2006 to last year by Korean National Health Insurance Corporation, the number of patients treated for sleep disorder increased nearly twofold for the last 5 years. There is a wide range of sleep disorders including insomnia, sleep apnea, paroxysmal sleep, sleep-wake disorder, and hypersomnia. The most common types of sleep disorders are insomnia and sleep apnea
1,
2.
The sleep apnea syndrome (SAS) is a disorder characterized by abnormal breathing during sleep and sleep fragmentation. At least 30 episodes of apnea occur during 7 hours of nocturnal sleep in these patients
3,
4. Apnea is defined as the cessation of airflow through the nostrils and mouth for at least 10 seconds. Bickelmann et al.
5 first described the Pickwickian syndrome characterized by obesity, hypersomnia, periodic apnea, and hypopnea in 1956. In 1966, Gastaut et al.
6 were the first investigators to demonstrate repeated apnea in patients with Pickwickian syndrome during sleep.
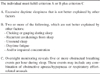
Sleep apnea patients have various symptoms and clinical manifestations. Almost all patients or their bed partners have a history of heavy, loud snoring. Patients with sleep apnea most often complain of excessive daytime sleepiness (EDS); they may be experiencing serious social, economic, and emotional problems as well as fatigue, depression, personality changes, and impotence.
SAS is associated with one or more of these systemic symptoms.
Central sleep apnea, obstructive sleep apnea (OSA), and mixed sleep apnea are the variations of apnea. In central sleep apnea, respiratory muscle activity ceases simultaneously with airflow at the mouth and nostrils. On the other hand, OSA is characterized by sleep-induced obstruction of the upper airway, resulting in the cessation of airflow with preservation of respiratory effort, respiratory center drive, and diaphragmatic contraction. As a combination of central and obstructive apnea, mixed sleep apnea begins with an episode of central apnea with no airflow detectable at the mouth and nostrils and no respiratory muscle activity. The pattern ends with an episode of obstructive apnea with only the cessation of airflow at the mouth and nostrils
7. Accounting for 80-95% of sleep apnea cases
8, OSA is frequently manifested in males older than middle age and by 6-10 times compared to females. Its prevalence rate is approximately 1-10%
9,
10.
Nocturnal polysomnography remains the golden standard for establishing the diagnosis of sleep apnea, quantifying its severity and determining the success of treatment modalities. Polysomnography is the simultaneous and continuous monitoring of several parameters during sleep to study normal and abnormal sleep. The study includes monitoring brain waves and assessing sleep stages and other physiological variables such as breathing, eye movements, and blood oxygen levels, which exhibit a disrupted pattern with sleep disturbances.
A diagnostic evaluation includes thorough history and physical examination, acoustic reflection technique, fiberoptic endoscopy, radiological evaluation, and polysomnography.
Lateral cephalometry and computed tomography (CT) were routinely obtained in the radiological evaluation of sleep apnea patients. Lateral cephalometric analysis is performed to check for any possible skeletal and soft tissue abnormality. The advantages of lateral cephalometry include easy access, low cost, and minimal radiation exposure. Note, however, that there are obvious limitations in the evaluation of a three-dimensional area with two-dimensional lateral cephalometry. CT scan has several disadvantages such as radiation exposure, high cost. As an alternative to cephalometry, however, it has been used to provide quantitative assessment of the upper airway at various levels.
Since the tendency of obstruction of the upper respiratory tract in OSA patients is greatly influenced by the anatomical state of respiratory tract, finding out the location of obstruction of the upper respiratory tract is extremely important in the diagnosis and treatment of OSA. Although there have been numerous research studies that analyzed the indices of each of the OSA patients and lateral cephalometric radiograph and CT in OSA patients, and the specific anatomical state of the respiratory tract of OSA patients is well-known thanks to existing research for this purpose, research studies examining the relevance by comparing the 3 diagnostic tools together - polysomnography, lateral cephalometric radiograph, and CT - are rare.
Therefore, this study sought to measure various anatomical items through physical measurements, lateral cephalometric radiograph, and CT on the upper respiratory tract areas, analyze the correlation between apnea-hypopnea index (AHI) of polysomnography, breathing disorder index, and lowest oxygen saturation level, and ultimately determine the diagnostic values of these indices for patients who visited the hospital with complaints of snoring and symptoms of sleep apnea.
IV. Discussion
OSA is characterized by cessations of airflow or apneas caused by a recurrent collapse of the upper airway during sleep. Intermittent airway obstruction causes repetitive alveolar hypopnea with long-term sequelae including systemic and pulmonary hypertension, cardiac arrhythmias, and even sudden death. Sleep fragmentation as a result of continuous arousals is responsible for neuropsychiatric disorders such as EDS, personality changes, mental deterioration, and impotence.
The causes of obstruction of the respiratory tract are largely divided into obesity factor and non-obesity factor. The obesity factor causes an increase in the tendency toward obstruction of the respiratory tract due to the rear movement of the tongue as a result of the excessive accumulation of fat under the chin or reduction in the diameter of the respiratory tract owing to an increase in the volume of soft tissues around the respiratory tract. The non-obesity factor causes an increase in the tendency toward obstruction of the rear respiratory tract space because the low jaw bone is in the lower rear position as attributed to the increase in age and use of alcohol and drugs (muscle relaxant, etc.).
The pathological cause of obstruction of the respiratory tract in OSA patients has yet to be defined. Currently, the tendency toward obstruction of the respiratory tract during sleep is known to increase due to a reduction in the tension of throat muscles by pathological factors, increase in age, consumption of alcohol, and administration of drugs such as anesthetics, muscle relaxant, and sedatives. Anatomical abnormalities such as adenotonsillary hypertrophy, retrognathia, micrognathia, macroglossia, large base of the tongue, deviated nasal septum, thick and short neck of obese people, and masses or tumors in the nasopharynx or hypopharynx may contribute to or produce airway obstruction during sleep
4. In such case, apnea during sleep is manifested due to the obstruction of the respiratory tract attributed to the negative pressure instantaneously generated as a result of the remarkable increase in air flux in the narrowest section of the upper respiratory tract when air passes through the upper respiratory tract at the time of inhalation during sleep in accordance with Bernoulli's theorem. As such, since the tendency toward the obstruction of the upper respiratory tract in OSA patients is greatly influenced by the anatomical state of the respiratory tract
16,
17, finding the section of obstruction of the upper respiratory tract is a very important procedure in the diagnosis and treatment of OSA
4.
Polysomnography is an essential examination for the diagnosis of sleep disorder patients. As indices of obstructive breathing disorder, apnea per hour, AHI as the measure of the frequency of hypopnea, and RDI as the indication of frequency of respiratory event-related arousals (RERA) are frequently used. In particular, RDI was used as diagnostic standard for OSA since it is deemed to show more accurate symptoms of respiratory disturbance as an index combining AHI and RERA
4. In applying RDI as the diagnostic standard for sleep apnea, although RDI of less than 10 was set as the diagnostic standard for OSA since the positive ratio in aged people over 60 was found to be very high, there were a small number of patients over the age of 60; considering the fact that patients over the age of 60 all had severe cases of OSA, setting the diagnostic standard of RDI value to 5 for this study was deemed to cause no problem. Given the small number of specimens in this study, comparison with various indices in radiographic images was done by categorizing RDI of less than 30 as moderate and more than 30 as severe case of OSA.
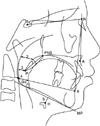
There were significant differences between the 2 groups with regard to NAS, MP-H, and ANB in the lateral cephalometric radiograph scanned in central occlusion position. In the severe group with RDI of more than 30, the NAS value was low, whereas ANB and MP-H were much larger. The narrowest section of the respiratory tract found in this study was the rear section of the soft palate and rear section of the root of the tongue; this finding was consistent with that of previous research studies
18,
19, suggesting that the narrowest anteroposterior diameter of the respiratory tract in comparison to the other indices of the upper respiratory tract found in the cephalometric radiograph had a close relationship with the intensity of the RDI. Rivlin et al.
20 reported OSA patients with posterior displacement of the mandible. Riley et al.
21,
22 determined that OSA patients had inferiorly positioned hyoid bone, longer-than-normal soft palate, and narrowing at the base of the tongue. In this study, based on the finding that ANB values were high in the severe RDI group, OSA was deemed to be severer if the lower jaw was at the rear in comparison to the upper jaw. The position of the hyoid bone is important because it serves as a central anchor for the muscles of the tongue, thereby helping partly determine the tongue position. The mean MP-H distance for normal subjects is 15.4±3 mm. In this study, MP-H in the severe RDI group was 22.69±5.21 mm, which was longer than the mean value. Therefore, the thickness of the narrowest respiratory tract in the lateral cephalometric radiograph scanned in central occlusion position, position of the lower jaw against the upper jaw, and location of hyoid bone can be said to be related to the severity of OSA.(
Table 6)
As a result of the analysis of correlation between RDI and various indices of radiographic scan, significant correlation was found between NSA and PNS-P in the lateral cephalometric radiograph taken in central occlusion position. As RDI increased, NSA in central occlusion position decreased, and PNS-P in central occlusion position, i.e., length of the soft palate, was found to increase. This is related to the results of previous research studies including that by Riley et al.
21,
22 who reported that OSA patients displayed longer soft palate than normal subjects.
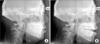
The polysomnography of OSA patients shows that they often sleep with their mouth open. Therefore, various indices and RDI values were compared by taking lateral cephalometric radiograph, with the respiratory tract during sleeping reproduced by slightly opening the mouth.(
Fig. 1) Significant changes were observed in all indices except SPAS when compared with the lateral cephalometric radiograph in central occlusion position.(
Table 8) Among these, the most significant changes were observed for NAS and MP-H. MAS, IAS, NAS, and MP-H were found to decrease based on the lower rear direction movement of the tongue when opening the mouth. Since the extent of obstruction can be said to worsen if the patients change to supine posture for sleep, such will provide useful diagnostic value. Although no statistically significant difference in RDI was found between 2 groups for all indices, the authors believe that indices with statistical significance can be found if the number of research subjects is increased. Therefore, continuous research analysis is deemed to be essential in the future.
Most of the publications on the effect of body posture on sleep apnea have suggested that sleeping in supine posture contributes to the severity of sleep apnea
23. Cartwright
24 divided the OSA patients into two groups - positional OSA patients (PP) and non-positional OSA patients (NPP) - according to the body posture, whereas sleeping has an effect on the OSA severity and events. Oksenberg et al.
25 recently confirmed Cartwright's data in a large, unselected OSA population (574 consecutive patients) diagnosed in their sleep unit and found that 55.9% were positional. In other words, PP represents the majority of the OSA patients. Thinner and younger than NPP on the average, PP had fewer, less severe breathing abnormalities than NPP, and their nocturnal sleep quality was better preserved
24,
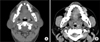
25. This is due to the fact that there is a difference in the transverse section of the respiratory tract between the 2 patient groups. The shape of the transverse section of the upper respiratory tract is categorized as elliptical if the ratio of the lateral diameter against the anteroposterior diameter is more than 1.5, and as circular if less than 1.5.(
Fig. 3) Although there are more elliptical types in positional patients, the more circular type is found in non-positional patients. Such difference is induced because the lateral diameter of the upper respiratory tract in positional patients is greater, although there is no difference in the anteroposterior diameter of the upper respiratory tract between the 2 patient groups
26. During sleep in supine position, both PP and NPP will have breathing abnormalities due mainly to the gravitational effect on upper airway soft tissues; this in turn reduces the anteroposterior diameter significantly. When the PP group adopts the lateral position, the anteroposterior diameter increases since the lateral walls are sufficiently far apart, thereby preserving sufficient airway space to avoid a complete collapse of the upper airway. In the NPP group, changing to lateral position will continue to cause pharyngeal collapse since the lateral diameter in these patients is not sufficiently large to prevent such. Fairburn et al.
27 reported that OSA worsened with the decrease in the ratio of lateral diameter against the anteroposterior diameter. According to Saigusa et al.
28, the most significant difference lies in the volume of soft tissue of the lateral pharyngeal wall of positional and non-positional patients. A collapse of the respiratory tract is manifested as the difference in pressure within the respiratory tract and pressure of soft tissues. Since the non-positional patients frequently had high body mass index with high volume of soft tissue on the lateral pharyngeal wall, collapse of the respiratory tract can occur in both supine and laterally reclined positions due to the increased gravitational effect. In positional patients with relatively low severity of OSA and body mass index, the transverse sectional shape of the respiratory tract becomes more like an ellipse; as the transverse sectional shape of the respiratory tract becomes more like a circle, the severity of OSA and body mass index increase. Therefore, since obesity and increased neck circumference induce an increase in the volume of soft tissues of the upper respiratory tract, these are factors that most directly affect the reduction of diameter of the upper respiratory tract.
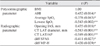
Body mass exhibited significant association with AHI, average oxygen saturation level, and lowest oxygen saturation level at the time of polysomnography. As BMI increased, AHI increased whereas the average oxygen saturation level and lowest oxygen saturation level decreased. Therefore, the severity of OSA can be said to increase as BMI increases. (
Table 9)
As BMI increased, the ratio of the lateral diameter against the anteroposterior diameter of the respiratory tract decreased in the CT transverse section scan of the narrowest respiratory tract section; thus causing the transverse sectional shape of the respiratory tract to become more like a circle and increasing the severity of OSA. The differences in SPAS and HP-H in central occlusion position and open states can be said to be large since BMI in the lateral cephalometric radiograph increases whereas IAS in open state decreases. (
Table 9) Therefore, the extent of decrease in the respiratory tract in open state can be said to be greater as BMI increases. The severity of OSA can be forecast through the appearance of reduction of the respiratory tract as displayed in the lateral cephalometric radiograph taken in open state based on this principle.
Since the lateral cephalometric radiograph is scanned in upright posture, such cannot be deemed to reflect accurately the upper respiratory tract of patients in lying-down posture during sleep. Nonetheless, Kim et al.
29 reported no significant difference in the measured value of the 2 groups in terms of sitting and lying position as a result of comparing the cephalometric radiograph images due to the level of muscular tension. In the clinical setting, it is difficult to reproduce the posture during sleep; since similar values can be obtained even if the cephalometric radiograph can be taken while the subject is standing comfortably as in scanning while lying down, this study also used the scanned images taken while the subjects are in standing position considering the ease of carrying out this study.
Since CT is taken while patients are in supine position to reproduce the posture during sleep, it has the disadvantage of taking the scan while the subject is in awakened state. According to Martin et al.
30, although OSA patients in seated position had smaller upper airway transverse section areas than normal subjects, there was no difference between the groups observed in lateral and supine postures. This suggests that OSA patients, at least in awakened state, may tend to protect themselves against upper airway collapse secondary to increased gravitational load on the tongue
30. Therefore, the CT scan poorly reproduces the airway in sleeping state. Accordingly, with the exception of polysomnography, all diagnostic tools have difficulties in accurately reproducing the state of sleep since the patients are scanned in awakened state. As such, an important task is to pursue research on observing the anatomical changes in the upper respiratory tract during sleep.
Based on the finding with regard to the association among the BMI of OSA patients, RDI as revealed through the results of polysomnography, and indices in the radio graph particularly the finding that the indices of the lateral cephalometric radiograph taken in central occlusion position and open states are related to the severity of OSA, more significant and useful indices may be discovered if the number of research subjects is increased. The lateral cephalometric radiograph is expected to be enormously helpful in confirming and diagnosing the sleeping status and location of obstruction of OSA patients since scanning is relatively convenient, economical, and reproducible.


 PDF
PDF ePub
ePub Citation
 Print
Print


 XML Download