This article has been
cited by other articles in ScienceCentral.
Nonparametric statistical methods
Parametric statistical methods are implemented based on definite assumptions. For example, an independent t-test requires conditions of normal distributions for each group. The normality of the population distribution from which the sample data was originated may be assessed by examining graphs, by formal normality test such as the Shapiro-Wilk test or Kolmogorov-Smirnov test, or by assessment using skewness and kurtosis, as discussed in a previous session. When a substantial departure is found in data with continuous outcomes, we may consider transformation of data, e.g., by taking logarithms. If transformed data satisfy the assumptions, usual parametric methods, such as t-test, ANOVA, or linear regression may be applied. However if transformed data do not satisfy the assumptions, we need to choose nonparametric methods.
Nonparametric methods are called as 'distribution-free tests' because generally they don't require any assumptions about underlying population distribution. Nonparametric methods may be applied when the data do not satisfy the distributional requirements of parametric methods. In nonparametric methods, ranks of observations are used instead of the measurements themselves, which may cause somewhat loss of information. While parametric methods estimate the key parameters of the distribution such as population means, nonparametric methods mainly test the pre-set hypothesis, e.g., whether two data differ or not. As the result, nonparametric methods usually don't provide any useful parameter estimates.
Nonparametric methods may be applied on a wide range of data which is not suitable for the parametric analysis. Severely skewed continuous data or continuous data with definite outliers may be analyzed using nonparametric methods. Small-sized samples which don't guarantee the exact normality need nonparametric methods. Also data with ordinal outcomes are often analyzed using nonparametric methods.
Advantages of nonparametric methods are as follows:
Disadvantages of nonparametric methods are as follows:
1) Applying nonparametric methods on data satisfying assumptions of parametric methods may result in less power. However loss of power may be little or none for analysis of data which cannot satisfy the assumptions.
2) Tied values can be problematic and appropriate adjustment may be required.
3) Limited flexibility in generalizing to more complex analytic methods compared to parametric methods.
Nonparametric methods for comparing two groups
Table 1 shows parametric methods and nonparametric methods for comparing independent two groups and correlated two groups. The Wincoxon rank-sum test (or the Mann-Whitney U test) is comparable to the independent
t-test as the Wilcoxon signed-rank test is to the paired
t-test.
1. Wilcoxon rank-sum test (or Mann-Whitney U test)
The Wilcoxon rank-sum test (or the Mann-Whitney U test) is applied to the comparison of two independent data whose measurements are at least ordinal. The null hypothesis is that two sets of scores are samples from the same population; therefore they do not differ systematically. Steps of the test are as follows:
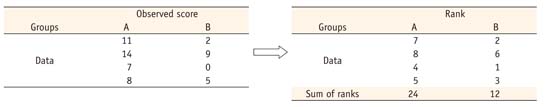
1st step: Transformation of observed scores into ranks
2nd step: W (Difference from the rank sum of A group to the rank sum of B group) = 24 - 12 = 12
3rd step: Calculation of the probability of the observed case or more extreme cases
a) Number of all possible cases when 4 observations were selected from the set with 8 observations: 8! / (4! * 4!) = 70
-
b) Number of cases with larger difference of rank sum from A group to B group = 4 cases
Rank combinations of A group with (5, 6, 7, 8), (4, 6, 7, 8), (3, 6, 7, 8), and (4, 5, 7, 8).
4th step: Calculation of probability
If sample size is large (> 20), asymptotic p value (below e) is used for the statistical determination.
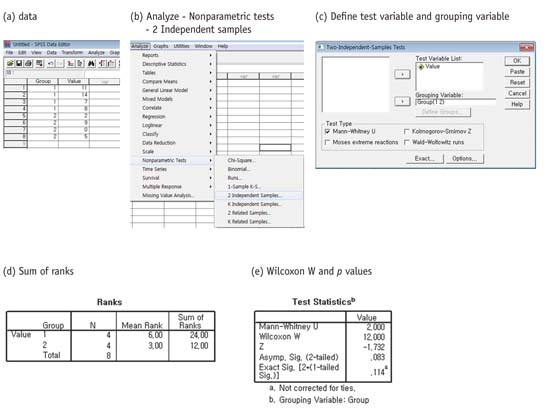
The Wilcoxon rank-sum test using the SPSS statistical package is according to following procedures:
2. Wilcoxon signed-rank test
The Wilcoxon signed-rank test is applied to the comparison of two repeated or correlated data whose measurements are at least ordinal. The null hypothesis is that there is no difference in two paired scores. Steps of the test are as follows:
1st step: Compute difference scores between two paired values
2nd step: Assign ranks from the smallest absolute difference to the largest one
3rd step: Provide signs, + or ., according to the direction of the differences and compute sum of positive and negative ranks, respectively.
4th step: Set T = Smaller absolute value of positive or negative rank sum. T = 4 (negative rank sum)
An example of calculating sum of positive and negative ranks is shown in the
Table 2.
5th step: Wilcoxon signed rank test
-
a) Small sample size (N < 20): find the p value for T value and sample size n in the table for the Wilcoxon signedrank test.
For this example, p value = 0.0017 for T = 4 when sample size = 12.
-
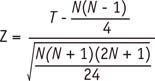
b) Larger ample size (N > 20): use z distribution approximation.
Statistical decision: reject null hypothesis if |z| > 1.96 at the significance level α = 0.05. If the sample size was larger than 20, the asymptotic p value 0.006 (below e) could be used.
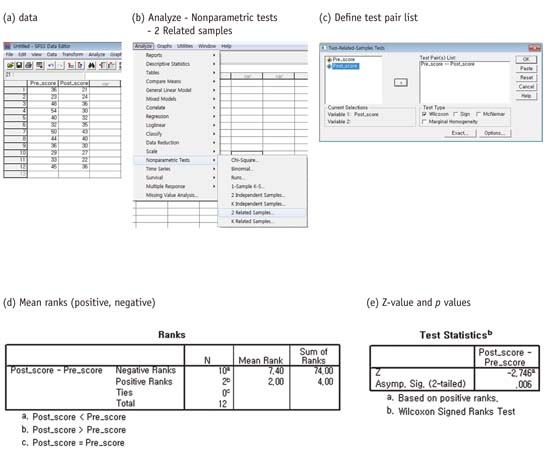
The Wilcoxon signed-rank test using the SPSS statistical package is according to following procedures:


 PDF
PDF ePub
ePub Citation
 Print
Print


 XML Download