

 PDF
PDF ePub
ePub Citation
 Print
Print


Introduction
Cephalometry was defined as the measurement of the head, and its up-to-date definition is refined as a scientific study of the measurement of the head with relation to specific reference points to assess facial growth and development.1,2 In particular, in order to evaluate facial asymmetry, the definition of the midline in two-dimension (2D) and the midsagittal plane (MSP) in three-dimension (3D) have been generally used to evaluate facial asymmetry in cephalometric analysis.3
With the recent advancement of computed tomography (CT), pre-surgical 3D analysis has been frequently used in surgery and orthodontics. The references with various planes, angles, and points have been proposed to develop 3D cephalometric analyses on CT with other studies.4,5 Recently a reference point defining the coordinate-system using 3D CT image was proposed.6 Olszewski et al showed the actual necessity to establish the appropriate reference on CT image like the conventional cephalometric radiograph.7 Even though the volumetric method was introduced, the practical use for cephalometric analysis has been limited. The quantification of 3D CT volume modeling was presented without a specific reference.8 This method cannot be actually applied to the 3D analysis of facial asymmetry without defining the MSP.
It was suggested that the evaluation of facial asymmetry may result differently according to the different references on 2D cephalometry.3 Therefore, it is presumed that the carefully selected references in 3D cephalometry may be as important as in 2D cephalometry. The MSP can vary according to the reference determination and therefore the appropriate determination of reference for MSP is indispensible in 3D cephalometry. Until now, none of the study has so far shown the inconsistency of cephalometric analysis according to the determination of reference on 3D CT.
The purpose of the present study was to investigate the disagreement of cephalometric analysis depending on the reference determination of midsagittal plane for evaluation of facial asymmetry of patients with class III dentofacial deformity using 3D CT. The amounts of jaw deviation relative to two differently determined MSPs were compared to suggest the importance of reference determination on 3D cephalometric analysis.
Materials and Methods
Patient selection
After the approval by the institutional review board in Seoul National University Dental Hospital, the subjects, who undertaken CT examination, were reviewed retrospectively from February of 2005 to May of 2010. The inclusion criteria were as follows: (1) the age ranged from 20 to 29 years (mean 21.551±2.644 years) (2) female adults (3) ANB angle less than 0°(mean -3.073±2.445°)on the lateral cephalometric radiograph (4) no disease affecting craniofacial growth. A total of 102 subjects from 920 patients matched with those criteria. In order to avoid any skewing effects such as sex, age, and skeletal classification, only young women with class III dentofacial deformity were included.
Image acquisition and analysis
Multi-detector spiral CT (Somatom Sensation 10, Siemens, Erlangen, Germany) was taken with the following specifications: 512×512 matrix, 0.75 mm slice thickness, 120 kVp, and 80 mA. The subjects were asked to close their mouth at maximum intercuspation. The acquired CT raw data were imported to 3D image software (InVivoDental, version 5.0, Anatomage Inc., San Jose, California) for the subsequent image analysis.
The subjects' Frankfurt (FH) plane was adjusted to the horizontal plane with the landmarks of bilateral porions and left orbitale in 3D image software. The landmarks were identified based on every cross-sectional view and 3D model by one examiner to acquire the coordinates (x, y, z) of the landmarks.9 The distance between two points was calculated with the distance formula in 3D Cartesian coordinate system.
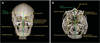
Table 1 and Fig. 1 show the definitions of the landmarks used. Crista galli (CG) was used as the common reference point of the face and cranium for MSP (Fig. 1). The facial MSP was defined as the sagittal plane which crossed CG and also vertically bisected a line formed by FZSs on both sides. The cranial MSP was defined as the sagittal plane crossing CG, the averaged point (apFO) of foramina ovale and the averaged point (apFS) of foramina spinosum on both sides (Table 1 and Fig. 1).
The jaw deviation was determined as the perpendicular distance from MSP to the midpoint (Table 2). The jaw deviation was measured respectively (Fig. 1A). Anterior nasal spine (ANS) and genial tubercle (GT) were used to indicate the midpoints of maxilla and mandible. The detailed definitions and abbreviations are presented in Table 2.
Statistical analysis
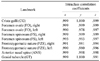
Landmark tracing was performed again two weeks apart by one examiner for the test of reproducibility according to intraclass correlation (ICC) coefficients.10 The coordinate of each axis in the landmark was used as a variable for ICC. The randomly selected 15 subjects were included for ICC.
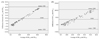
The null hypothesis was that the amounts of maxillary and mandibular deviations from two MSPs would be the same. The agreement was evaluated by two statistical methods, the paired t-test (2-tailed) and Bland-Altman plot. Firstly, the comparisons between DCmx and DFmx and between DCmd and DFmd were performed by paired t-test (2-tailed). Statistical significance was determined at P<.05. Then Bland-Altman plot was drawn to evaluate the agreement between DCs and DFs.11,12 The average of DCs and DFs (x-axis) was graphed versus the difference between DCs and DFs (y-axis) (Fig. 2).
All calculations were made with Excel2007 program (Microsoft Corporation, Redmond, Washington). All statistical analyses were performed using PASW (version 18.0, SPSS Inc., Chicago, Illinois).
Results
Table 3 reveals that the reproducibility of landmark tracing was excellent according to ICC (r≥.978),10 and Table 4 shows that DCs and DFs at both jaws were statistically different by paired t-test (P<.001). In addition, the mean values of DCs at both jaws were higher than that of DFs. DCmx was 24.865±21.263 mm which was 17 times higher than DFmx. On the other hand, DCmd was 40.881±34.325 mm which was 9.8 times higher than DFmd. This result indicated that the maxillary deviation was more likely to be changeable depending on the determination of MSP.
Bland-Altman plot showed that the differences between DCs and DFs were not normally distributed (Fig. 2). A low correlation and wide spread plots in Bland-Altman imply good agreement of the variables, while a high correlation automatically imply that there is no good agreement between two variables.11 The plot demonstrated that DCs were statistically higher than DFs depending on the distance from the midpoints to MSPs.
Discussion
The aim of this study was to verify that the determination of different MSPs could result in different 3D cephalometric analysis especially for the evaluation of facial asymmetry and therefore imply that appropriate landmarks would be prerequisite for the 3D cephalometric analysis.
Asymmetry of cranium and face was not an uncommon finding.13-16 However, there have been a few studies stating whether facial asymmetry was concurrent with cranial asymmetry or not.17 In addition there was no study on a possible error according to the determination of MSP in 3D analysis. Therefore, this study could be helpful in expanding clinicians' scope about 3D analysis for the selection of references.
Proffit et al stated that the main reason seeking a surgical-orthodontic treatment was facial asymmetry and also a long face and skeletal class III deformity.18 Accordingly, focusing on class III malocclusion was meaningful to aid in cephalometric analysis for patients with class III dentofacial deformity.
CG was generally accepted as the midpoint of cranium. The anterior cranial base was closely related with facial skeleton19 and also CG resulted from the sophisticated growth pattern of the anterior cranial base.20 Therefore, CG was regarded as linked to facial skeleton as well as cranium.
FO and FS were introduced as reproducible landmarks in both 2D and 3D analysis.4-6,21-24 The use of these landmarks was justified by the findings that the growth of cranial base was largely complete (>85%) by 5 years of age and therefore neural or vascular foramina on cranial base can be used as stable landmarks.25-27 As stated by Enlow et al, the anterior cranial base showed the different growth pattern and timing compared with the middle cranial base27 which encompassed FO and FS in the sphenoid bone. Therefore, FO and FS appeared to have different nature compared with CG and FZS. However, FO and FS were suitable for the cephalometric analysis because of their stability in growth pattern. In the present study, apFO and apFS were used as the landmarks of the middle cranial base.
In performing the cephalometric analysis of the face, the reference points or lines were recommended on the non-movable or stable parts. From this regard, the landmark, such as ANS,3 on the jaws was not a suitable reference for evaluation of facial asymmetry because it was possible to be altered during the surgical treatment. Some researchers have used the FZS in both 2D and 3D analysis.3,24,28 FZS showed the good possibility for the reference in the assessment of facial asymmetry,3 which confirmed the usage of FZS in the present study.
In spite of the lower absolute values of DCs and DFs on the maxilla than the mandible, the resultant variations of jaw deviation according to two MSPs were more prominent on the maxilla (Table 4). The reference determination probably affected the maxillary asymmetry to a greater extent, which was consistent with finding from Haraguchi et al.16 Although, theoretically, mandibular deviation would be likely to be affected by the different MSPs because of the longer distance from cranium, this result was contrary to that. Further study is needed to explain this finding.
Especially, when facial asymmetry was evaluated, the reference points or lines should be selected with caution.3 From the results of the present study, when the reference points on the middle cranial base with CG were used, the midpoints of jaws were more deviated compared with the reference points on the anterior cranial base and facial skeleton. One should consider the exaggerated results of facial asymmetry using the reference points distant from the facial skeletons. In contrast, jaw deviation relative to the facial MSP might result in unreasonably decreased amounts compared with the cranial MSP. For example, the surgical correction of facial asymmetry in relation to the cranial MSP may lead to the asymmetric facial skeletons in relation to the facial MSP. A corrective surgery possibly causes a different kind of asymmetry on facial structure depending on the MSP determination. Therefore, by using 3D CT, the appropriate reference for MSP should be assessed for the individual patient in treatment of facial asymmetry. Further study are needed to support a study on the discrepancy between the surgical outcomes from the different MSPs.
The reference points should be chosen according to the aim of study, the anatomical structure of interest, and methodology. Therefore, if the reference on the middle cranial base was selected with a specific need, it could be a reasonable landmark for cephalometric analysis. One example of this landmark is the mandibular condyle which is considerably consistent with the middle cranial base in growth pattern.22,27 However, one should consider the possible discrepancy originated from the reference points on the anterior and the middle cranial bases relatively.
Confining the subjects to patients with class III dentofacial deformity was the limitation of the present study. There has been no finding regarding the discrepancy of MSPs according to different skeletal types. Therefore the results of the present study cannot be applied to class I or II skeletal malocclusion. Although it was difficult to collect CT data of class I or II skeletal malocclusion because patients with class III dentofacial deformity were the ones who have mainly undergone the surgical treatment in our hospital, those skeletal types should be included.
The close structural connection and proximity between the cranial base and the facial skeleton were suggested.19,27 However, it was implied that the cranial center may not be corresponding to the facial center after the completion of growth by accepting the results of the present study in a broad sense from the anthropometric perspective.
In conclusion, the facial MSP was not in agreement with the cranial MSP in class III dentofacial deformity using three-dimensional computed tomography. The midpoints of the jaws were more deviated using the cranial MSP than the facial MSP. Therefore using the cranial MSP could exaggerate the result of the jaw deviation. The cephalometric analyses can be discrepant according to the reference determination of MSP in evaluating facial asymmetry of the same patient. With this regard the reference points on the cranial base and facial skeleton should be carefully selected for the cephalometric analysis of facial asymmetry in patients with class III dentofacial deformity.


 XML Download