

 PDF
PDF ePub
ePub Citation
 Print
Print


INTRODUCTION
The socioeconomic environment in South Korea has changed rapidly as it has become one of the fastest developing countries worldwide. South Korea's gross domestic product grew 30-fold between 1980 and 2010; it grew from US $ 651 billion in 2001 to US $1,173 billion in 2010 [1]. During that 30-year period, the prevalence of diabetes in South Korea also increased approximately 3-fold [2]. The prevalence of diabetes is also increasing in other developing countries in Asia, such as China [3,4,5] and India [6]. Although previous studies in developed countries have demonstrated an inverse relationship between socioeconomic status (SES) and the prevalence of type 2 diabetes [7,8,9], high SES was reported to be associated with an increased risk of diabetes in China [10] and India [11,12] in the 1990s, mainly due to decreased physical activity and a Westernized diet pattern among people with high SES. However, recent analyses in those countries show that the prevalence of diabetes in the low-SES population has increased markedly and that low SES is now a risk factor for diabetes [3,13]; this is concordant with findings from developed countries [7,8,9].
It is important to investigate the associations between SES and diabetes as well as other associated risk factors in order to plan for public healthcare; however, little is known about these associations in Korea. The prevalence of diabetes in South Korea remained stable in the 2000s, affecting 9% to 10% of Korean adults aged ≥30 years [2,14]. However, we recently reported that the prevalence of diabetes among women between 30 and 59 years of age exhibited a decreasing trend during 2001 to 2010, although the prevalence of diabetes has not changed much over the past decade among Korean adults over 30 years of age [15]. Because of these changes in the prevalence of diabetes in young adults in Korea [15], investigating whether there is a difference in the changes of the prevalence of diabetes with respect to SES may prove to be invaluable. Since 1998, the Korean Ministry of Health and Welfare has conducted a series of Korea National Health and Nutritional Examination Surveys (KNHANES) designed to be representative of the Korean population. We investigated and compared the association between economic status and the prevalence of diabetes mellitus (DM) among participants in the KNHANES between 2001 and 2010.
METHODS
Subjects
The KNHANES has been conducted on non-institutionalized Korean civilians using a stratified multistage probability-based sampling design. Subjects were selected for the survey according to sampling units based on geographical area, sex, and age group using household registries and economic status [14]. To ensure the results represent the entire Korean population, weights are assigned to each respondent. This weighting method guarantees unbiased point estimates of population parameters for the entire population and its subsets [16]. We selected and compared the data from 2001 to 2010 except KNHANES 2007, as the number of participants of KNHANES 2007 was too small to investigate the association between diabetes and economic status.
In KNHANES 2010, a total of 10,938 individuals (from 3,840 families) aged ≥1 year were sampled as subjects for the health survey; 8,958 subsequently participated in the health examination survey (participation rate, 81.9%). The numbers of participants in KNHANES 2009, 2008, 2005, and 2001 were 10,078 (participation rate, 79.2%), 9,308 (participation rate, 74.3%), 7,597 (participation rate, 70.2%), and 9,770 (participation rate, 77.3%), respectively. Subjects aged 30 to 59 years were included among the participants in each survey; they were selected for the present study on the basis of the working age in Korea. After excluding subjects whose income information was unavailable, 3,580 (98.6% of subjects aged 30 to 59 years), 4,156 (99.0% of subjects aged 30 to 59 years), 3,803 (97.7% of subjects aged 30 to 59 years), 3,461 (99.2% of subjects aged 30 to 59 years), and 3,893 (94.0% of subjects aged 30 to 59 years) participants from the KNHANES 2010, 2009, 2008, 2005, and 2001, respectively, were finally included in our study.
Metabolic parameter measurement
In each study, anthropometric measurements were conducted by well-trained examiners in the same manner. Weight was measured to the nearest 0.1 kg using a calibrated balance beam scale (Giant-150N; Hana, Seoul, Korea). Waist circumference (WC) was measured to the nearest 0.1 cm from the narrowest point between the lower borders of the rib cage and the iliac crest at the end of normal expiration. Venous blood samples were drawn after a 12-hour overnight fast, and plasma was separated immediately by centrifugation. Fasting plasma concentrations of glucose and lipids were measured enzymatically in a central laboratory; a Hitachi Automatic Analyzer 7600 (Hitachi, Tokyo, Japan), an Advia 1650/2400 (Siemens, New York, NY, USA), and a 747-chemistry analyzer (Hitachi) were used in the KNHANES 2008 to 2010, the KNHANES 2005 and KNHANES 2001, respectively. To confirm and compare the accuracy and consistency of each survey in the KNHANES, commutable frozen serum samples (n=40) were sent to the Centers for Disease Control and Prevention (Atlanta, GA, USA) and analyzed using the standard method according to the Clinical and Laboratory Standards Institute guidelines (www.clsi.org/); with these data, the conversion rate was obtained using Passing-Bablok regression. The conversion rate for the KNHANES was obtained using the following method: (1) revised high-density lipoprotein cholesterol (HDL-C; mmol/L)=0.860×HDL-C (KNHANES 2008 to 2010)+0.075; (2) revised HDL-C (mmol/L)=1.160×HDL-C (KNHANES 2005)+1.800; and (3) revised HDL-C (mmol/L)=0.712×HDL-C (KNHANES 2001)+0.320.
Cases of DM were defined as subjects who were using antidiabetic medication including insulin at the time of the survey, had hemoglobin A1c ≥48 mmol/mol (6.5%), or had 8 hours fasting plasma glucose levels ≥7.0 mmol/L. In cases with <8 hours fasting, plasma glucose levels <7.0, 7.0 to 11.1, and ≥11.1 mmol/L were classified as non-diabetes, unknown at present, and diabetes, respectively. Hypertriglyceridemia was defined as triglyceride level ≥150 mg/dL after at least 12 hours fasting; low HDL-C was defined as <40 and <50 mg/dL in men and women, respectively, according to National Cholesterol Education Program criteria [17]. Abdominal obesity was defined as WC >90 and >80 cm in men and women, respectively, using the International Obesity Task Force criteria for the Asian-Pacific population [18], and hypertension was defined as blood pressure ≥140/90 mm Hg or use of antihypertensive medication.
SES classification
Economic status was classified into quartiles according to standardized monthly family income with equivalence scaling as follows: equivalent income=mean monthly family income/(family size)1/2. As sex and age are very important determinants of family income, each quartile (Q) was calculated independently for each sex and age group; Q1 and Q4 were the lowest and highest equivalent income quartiles, respectively. The mean monthly family equivalent income in each quartile was published previously [19,20,21]. Education level was categorized into two groups: high school graduate or higher (≥12 years of schooling) and less than high school graduate (<12 years of schooling).
Statistical analyses
All data were analyzed using SPSS version 18.0 (SPSS Inc., Chicago, IL, USA). The results are presented as the mean±standard error (SE) or prevalence (% and SE). Sampling weights were used to account for complex sampling, and all analyses were conducted independently for each sex. Age standardization was not performed because this study was performed mainly to compare the effect of economic status on diabetes prevalence in each survey year, focusing on subjects aged 30 to 59 years. Logistic regression analysis adjusted for age and body mass index (BMI) was used to identify differences in the prevalence of diabetes with respect to economic status in each survey. Linear regression analysis was used to analyze the associations between continuous variables and economic status adjusting for age. Logistic and linear regression analyses for categorical variables were used for trend analysis according to economic status, applying the equivalent income quartiles as a continuous covariate. The level of significance was set at P<0.05.
RESULTS
The prevalence of diabetes mellitus according to economic status
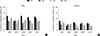
The crude prevalence of DM in the study population aged 30 to 59 years of the KNHANES 2010, 2009, 2008, 2005, and 2001 was 6.9% (SE, 0.5%), 6.6% (SE, 0.5%), 6.5% (SE, 0.5%), 5.9% (SE, 0.5%), and 7.6% (SE, 0.6%), respectively. In 2008 to 2010, the prevalence of diabetes in the lowest quartile (Q1) was 12.1% (SE, 2.1%) in 2008, 11.2% (SE, 1.7%) in 2009, and 11.4% (SE, 1.8%) in 2010 (Table 1, Fig. 1), which are significantly higher than the other quartiles in each year (age and BMI-adjusted odds ratio [OR], 1.846; 95% confidence interval [CI], 1.126 to 3.027; P=0.015 in 2008; OR, 1.706; 95% CI, 1.094 to 2.661; P=0.019 in 2009; OR, 1.560; 95% CI, 1.024 to 2.377; P=0.039 in 2010). In contrast, in 2001 to 2005, there was no association between the prevalence of diabetes and economic status in men (Table 1). In the case of women, although the prevalence of diabetes exhibited a trend of being lower according to higher economic status in 2008 to 2010 (P for trend=0.001 in 2008, 0.175 in 2009, and 0.083 in 2010, respectively), Q1 showed no difference in the prevalence of diabetes compared to the others (Table 1). The association between economic status and the prevalence of diabetes was not significant in either 2001 or 2005 in women.
Clinical characteristics according to economic status
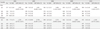
We subsequently compared the anthropometric and biochemical parameters according to economic status in each KNHANES (Table 2). Although Q1 of men showed a significantly higher prevalence of diabetes in 2008 to 2010, there was no such trend with respect to WC, triglyceride level, HDL-C level or prevalence of hypertension according to economic status in those years (Table 2). Furthermore, the association between BMI and economic status in men in 2010 was contrary to that of diabetes and economic status; BMI was higher as economic status was higher (age-adjusted P=0.021). This positive correlation between BMI and economic status was also found in men in KNHANES 2005 (age-adjusted P=0.001) (Table 2). In contrast, the data from women showed higher BMI and WC as economic status decreased, irrespective of survey year (Table 2).
Risk factors of diabetes mellitus in the multivariate model using KNHANES 2008 to 2010
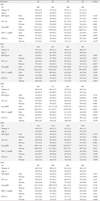
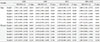
Considering the other risk factors of DM such as dyslipidemia, hypertension, and education level, we investigated whether economic status was associated with diabetes independently using a multivariate model. Even after adjusting for age, BMI, hypertriglyceridemia, low HDL-C, abdominal obesity, hypertension, and low education level, placement in the lowest income quartile was a significant risk factor of diabetes in men of KNHANES 2010 (OR, 1.755; 95% CI, 1.074 to 2.869; P=0.025; model 6) (Table 3). As classification in the lowest income quartile was significantly associated with diabetes in the analysis adjusting for age and BMI in men of KNHANES 2008 to 2010, we subsequently analyzed combined data from KNHANES 2008 to 2010 and found that the association between diabetes and economic status in men was significant in diverse multivariate models (Table 3). Other than lowest income status, hypertriglyceridemia (OR, 1.461; 95% CI, 1.038 to 2.057; P=0.030), low HDL-C (OR, 1.477; 95% CI, 1.075 to 2.030; P=0.016), hypertension (OR, 1.601; 95% CI, 1.174 to 2.184; P=0.003), age (P<0.001), and BMI (P=0.023) were also associated with DM in a multivariate model in men of KNHANES 2008 to 2010. However, neither education level nor abdominal obesity was significantly associated with diabetes. In the case of women during the same period, DM was associated with abdominal obesity (OR, 2.562; 95% CI, 1.581 to 4.149; P<0.001), hypertriglyceridemia (OR, 3.326; 95% CI, 2.177 to 5.082; P<0.001), hypertension (OR, 2.133; 95% CI, 1.493 to 3.049; P<0.001), and age (P<0.001), but not with income status, education level or low HDL-C. As postmenopausal status is independently associated with abdominal obesity [22,23] and metabolic syndrome [24], we additionally adjusted menopausal state in the analysis of the women of KNHANES 2008 to 2010 and confirmed that only abdominal obesity (OR, 2.557; 95% CI, 1.576 to 4.151; P<0.001), hypertriglyceridemia (OR, 3.333; 95% CI, 2.186 to 5.081; P<0.001), hypertension (OR, 2.181; 95% CI, 1.523 to 3.123; P<0.001), and age (P<0.001) were associated with diabetes.
DISCUSSION
Our analysis of data from population-based surveys in Korea carried out 10 years apart indicates that the association between economic status and the prevalence of diabetes in men was more prominent in 2008 to 2010 than 2001 or 2005. Lowest income status was a significant risk factor for DM in men of KNHANES 2008 to 2010 even after adjusting for other risk factors of diabetes. Interestingly, in that period, although hypertriglyceridemia, low HDL-C, hypertension, and BMI were also associated with DM in men, there was no difference in WC, triglyceride level, HDL-C level, or prevalence of hypertension across economic status in men. Furthermore, in men of KNHANES 2010, BMI was significantly lower as economic status was lower. In women, BMI was significantly higher as economic status was lower throughout the study period. However, the association between economic status and DM in women was less prominent than in men. After adjusting for age and BMI, there was no significant association between economic status and DM in women. Even using the combined data of KNHANES 2008 to 2010, abdominal obesity, hypertriglyceridemia, and hypertension were associated with DM in women, but economic status was not.
We could not determine the exact cause of the recent inequality in the prevalence of diabetes with respect to economic status due to the combined cross-sectional study design; however, many previous studies have reported health inequality according to SES. People at the lower end of the social hierarchy had higher morbidity and mortality rates than their counterparts [25,26]. Health inequality according to SES was associated with maternal health [27], adverse childhood circumstances [27], unemployment [28], and lower social support at work [29], along with unhealthy behavior such as smoking [26] and alcohol consumption [26]. Depression [30,31] and stress [32] have been reported to be risk factors for diabetes. An imbalance in effort-reward [33] and psychosocial stress at work [34], both of which are frequently found in low-paid jobs, are independent risk factors for type 2 diabetes. The high prevalence of such risk factors in the low-income group might play a role in the associated high prevalence of diabetes.
South Korea experienced an economic crisis in 1997, which occurred in the midst of rapid economic growth and had strong sociological impacts. Since then, the proportion of households in Korea living below the poverty threshold increased dramatically from 3.1% to 11.6% [35]. Along with this change in the economic environment, socioeconomic health inequality has increased in the Korean population [36,37]. Recent reports show that from 2007 to 2008, Korean women in low-income and low-education groups were twice as likely to suffer from metabolic syndrome as their high-income and high-education counterparts [38], which is also consistent with a recent report in China [3]. Such changes in the social and economic environment and the consequent stress of these changes might result in the close association between SES and diabetes in that cohort.
In addition, previous longitudinal studies show that SES is clearly related to subsequent changes in physical activity, which result in disparities in the prevalence of metabolic diseases with respect to SES in both developed [27] and developing countries [13].
In the present study, economic status was significantly associated with abdominal obesity, hypertriglyceridemia, and low HDL-C in women; these metabolic dysfunctions were more common among women with lower economic status. Although there was also a significant association between diabetes and the lowest income level in women of KNHANES 2008 to 2010 using monovariate analysis, the statistical significance disappeared after adjusting for other metabolic risk factors, which suggests that the unfavorable metabolic risk in the lowest income group increases the prevalence of diabetes. It is well-known that obesity is one of the most important risk factors for diabetes in women.
The first limitation of the present study is that family monthly income information is based on self-reported questionnaires. It has been reported that self-reported family income and health surveys affect each other significantly [39,40]. Furthermore, we only used equivalent income as a marker of economic status, while other studies have compared various socioeconomic markers such as education level [3,38]. Our preliminary analysis revealed that age inequality in education level was very prominent throughout the survey; younger populations have higher education levels. In particular, in 2001, the proportion of subjects with ≤9 years of schooling was 10.1%, 37.6%, and 64.1% in respondents in their 30s, 40s, and 50s, respectively (detailed data not shown). Although we did not include education level as a socio-economic marker, we adjusted education level when using multivariate analysis. The second limitation is that our study is based on a cross-sectional database. Although low economic status was a risk factor for DM in men between 30 and 59 years of age in the Korean population in recent years, we can establish neither a causal relationship nor an underlying mechanism for this association. Finally, a relatively small number of study subjects might weaken the statistical power of the analysis. Only 300 to 500 subjects per each economic quartile in each KNHANES were included for analysis. However, we used large nationwide datasets with high participation rates and observed that the effect of economic status on the prevalence of diabetes in the Korean population changed over the last 10 years. This finding could have very important implications in national public health policy planning.
A recent epidemiologic study shows that diabetes approximately doubles the risk of cerebrovascular diseases and cardiovascular diseases such as angina and myocardial infarction in the Korean population [41]. Furthermore, diabetes-related mortality in Korea has increased 3-fold over the past 20 years [42]. Given the large economic burden of diabetes-related health problems, policymakers should consider health inequalities when planning national public health strategies. Early detection of diabetes increases opportunities for effective management. The high risk of diabetes among populations with lower economic status warrants public health strategies such as improved access to diabetes screening. Poorer and less-educated people have inadequate access to primary prevention, early diagnosis and appropriate management [43,44], which can be overcome as it has in some countries [9,27]. Health promotion aimed at encouraging exercise or other lifestyle modifications to reduce obesity represents another possible strategy for preventing diabetes in populations with lower economic status; this strategy has proven successful in India [13].
In conclusion, Korean men between 30 and 59 years of age with the lowest economic status had a significantly higher prevalence of DM between 2008 and 2010, even after adjusting for other metabolic risk factors. Given the economic burden of diabetic complications, improved access to diabetes screening is warranted in this population.
 XML Download