

 PDF
PDF ePub
ePub Citation
 Print
Print


INTRODUCTION
Among gynecologic cancers, ovarian cancer is the second leading cause of death worldwide and the leading cause in developed countries [1]. In patients diagnosed with advanced stage III-IV ovarian cancer (International Federation of Gynecology and Obstetrics [FIGO] classification), the 5-year survival rate is ~30%, whereas in those diagnosed at an early stage the 5-year survival rate is ~90% [2]. The overall survival (OS) of patients with ovarian cancer has been extensively researched and many risk factors have been explored, including the serum cancer antigen 125 (CA-125) levels.
CA-125 is the most commonly used biomarker for diagnosis and follow-up of ovarian cancer. It is a high molecular weight glycoprotein with an elevated serum level (>35 U/mL) in 50-90% of patients with ovarian cancer, depending on the cancer stage [3]. Many features of CA-125 have been explored for an association with OS, such as the absolute value of CA-125 at different time points during treatment, and pharmacokinetic parameters, including CA-125 half-life [4]. However, the majority of survival studies have only considered a single CA-125 measurement or a limited number at well-defined time points. However, patients usually have CA-125 measurements taken repeatedly (longitudinally) over time, and the number of measurements, as well as the intervals between measurements, vary between patients for different reasons such as different responses to chemotherapy or unexpected loss to follow-up [5]. Therefore, longitudinal and often misaligned measurements contain information that cannot be represented by single values or characteristics, and it would be beneficial to develop a model that takes into account all longitudinal measurements to give a clear indication of patient-specific CA-125 profiles for the analyses of an association with OS.
Here, a recently published joint model, which couples the Cox proportional hazards and the mixed-effects models, was applied to assess the relationship between longitudinal CA-125 and OS [6]. The aim was to flexibly analyze repeated CA-125 measurements over time, including misaligned observations of CA-125, to provide a simple and reliable OS prediction model in a patient-specific manner. FIGO stage and residual tumor size were included as variables in the model because they are important prognostic factors [2,7].
MATERIALS AND METHODS
1. Data collection
A retrospective chart review was performed in the Kaohsiung Veterans' General Hospital (KSVGH), a public teaching medical center in south Taiwan. Data were collected from 275 patients who were admitted to KSVGH with ovarian cancer between June 1995 and January 2012. A total of 6 cycles of primary chemotherapy with an interval of 3-4 weeks was planned for the patients, with all completing at least one cycle. At each cycle of chemotherapy, as well as before and after surgery, at least one measurement of the CA-125 serum level was taken. A complete list of CA-125 has at least 8 values, spanning 4-6 months. However, patients may often suffer from adverse events after chemotherapy, resulting in treatment interruptions and postponement of the next cycle of chemotherapy. Some patients completed >6 cycles, but their CA-125 values beyond the primary chemotherapy were not included. In addition, some patients may have fewer cycles of chemotherapy due to various reasons such as disease progression or informed personal decision. FIGO stage and residual tumor size were included as covariates. The disease stage was obtained from the pathologic report of each patient, and the residual tumor size was obtained from their surgical notes.
The acquisition of patient data was approved of by the Institutional Review Board (IRB) of KSVGH. All patient information was retrieved from the hospital records, including electronic data and chart data. The extracted data included demographic and prognostic information such as age, blood tests, surgical notes, and pathologic reports.
2. Definitions
The end point of interest was OS, defined as the time from surgery to death or last follow-up. Those whose end point was the date of the last follow-up were defined as censored. Prediction of OS was achieved by calculating the survival probability of a patient at any given time point. A patient was defined as being at a high risk of death at a specific time point if the calculated survival probability was lower than the threshold, and at low risk if the probability was higher than the threshold. The threshold was dynamically estimated with each model fitting.
3. Statistical methods
All statistical analyses were conducted with the statistical computing and graphic drawing language, R [8]. A joint model, that coupled the Cox proportional hazards and the mixed-effects models, was constructed based on a freely available package, JM [9], to assess longitudinal measurements of CA-125 and OS data. The Cox proportional hazards model explores the association between each patient's OS and longitudinal CA-125 profile [10], while the mixed-effects model, often used in longitudinal data analyses, models the time trend of CA-125 profiles [11]. The advantage of using the mixed-effects model is that it can handle patients' misaligned observations of CA-125 across time. The CA-125 profiles of the patients were smoothed using lowess (locally weighted scatterplot smoothing) regression [12], which is a non-parametric regression method that uses locally-weighted polynomials to smooth the data.
To test the accuracy of the prediction, we performed validation based on 3-year survival probabilities. Two-hundred and eighteen patients were used in this part of the study after excluding 57 patients who were censored within 3 years. In order to have a well-fitted model, we unevenly divided these 218 patients by randomly selecting 50 patients as the validation cohort so that a majority (168 patients, or roughly 3/4) were left to train the model and for an estimation of the optimal threshold of high or low risk stratification. Once the model was fitted and an optimal threshold was estimated, we applied it to the 50 patients in the validation cohort to calculate their 3-year survival probabilities. We determined that the prediction was accurate if a patient died within 3 years and was grouped as high risk, and vice versa. The validation course was repeated 10 times, with 50 randomly selected patients each time.
RESULTS
1. CA-125 profiles
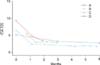
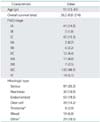
A total of 1,601 CA-125 values were collected, representing all the available CA-125 measurements of the 275 patients from the time of diagnosis of ovarian cancer to the completion of the primary chemotherapy. The cut-off date of follow-up was July 31, 2012. At the time, 81 patients had expired and 194 had been censored. Patient and tumor characteristics are summarized in Table 1. CA-125 profiles of the patients were extremely heterogeneous, ranging from 2-14 measurements, spanning over 2-10 months. Some typical examples of the CA-125 profiles are shown in Fig. 1.
2. The relationship between longitudinal CA-125 and OS according to FIGO stage and residual tumor size
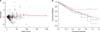
The joint model was adapted to evaluate the relationship between longitudinal CA-125 and OS according to FIGO stage and residual tumor size as covariates. Residual plots showed that the model fit the data very well (Fig. 2). It could flexibly fit all the various CA-125 profiles, regardless of the number of CA-125 measurements including early-censored patients who only had 2-3 measurements. All the collected CA-125 measurements (n=1,601) were fitted to the model, and the results showed that the longitudinal CA-125 values were significantly associated with OS (p<0.001).
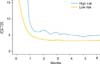
To further address the relationship between longitudinal CA-125 and OS, we plotted lowess curves (Fig. 3) for those patients who died within 3 years (the high-risk curve) and those who survived for at least 3 years (the low-risk curve). It is obvious that those patients at high-risk had a higher CA-125 curve. It is also interesting to note that the two curves are farthest apart not at the initial phase, but in the later time period post one month. This is in line with our suggestion that CA-125 changes over time have a significant predictive power.
Stage and residual disease are both important prognostic factors of OS, and we included them as variables in the model to adjust for the possible confounding effect they may have on estimating OS with longitudinal CA-125. Stage was treated as a binomial variable labeled as early (FIGO I and II) or advanced (FIGO III and IV) stage. Residual tumor size was also treated as a binomial variable with a cut-off value of 1 cm [7]. Our model showed that they were both significantly associated with OS (p=0.004 for stage, and p<0.001 for residual tumor size; data not shown).
3. Prediction of OS and validation
Based on the joint model described above, survival probability could be predicted at any given point of time for a new patient, provided that the CA-125 profile, FIGO stage (early or late), and residual tumor size was available. The patient-specific prediction is flexibly available for new patients even those with only 2-3 measurements of CA-125 over any time frame during the course from diagnosis to the completion of primary chemotherapy, and the survival probability could be calculated with the model at any time point, i.e., 1, 2, 3, 4, 5 years, and so on. The higher the probability, the lower the risk of death is at that time point. (For a program to calculate subject-specific survival probabilities, please go to http://www.math.nsysu.edu.tw/~cchang/predict_survival/.)
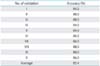
The average accuracy of the prediction was 85.4%, ranging from 80.0% to 88.0% (Table 2). These stable results showed that the model could give reliable prediction according to the high and low risk groups.
4. Comparison with CA-125 pharmacokinetic factors
The predicative value of the longitudinal CA-125 was compared with the CA-125 half-life and time-to-nadir predictive values as described previously [13]. Using the Cox proportional hazards model, the survival probability for each patient can also be calculated using CA-125 half-life or time-to-nadir with FIGO stage and residual tumor size as covariates. We ran the same validation course 10 times as described in the above section. The average accuracy of prediction with CA-125 half-life and time-to-nadir were both 82.2%. Compared to the average accuracy of 85.4% of longitudinal CA-125, the longitudinal CA-125 showed a better predictive value than a single kinetic factor (Table 3).
DISCUSSION
CA-125 is widely used as a tumor marker for the diagnosis and prognosis of ovarian cancer. However, the exact relationship between CA-125 and OS is still unclear [14,15]. Many of the related studies focus on specific values of CA-125. For example, studies on absolute CA-125 values have shown that the CA-125 levels after surgery, after 2, 3, or 6 cycles of chemotherapy are important prediction factors for OS [16-20], but the preoperative CA-125 may not correlate with OS [21]. The results presented here also suggested that those patients survived <3 years had an overall higher CA-125 curve compared to those who survived 3 years or more, even in the first month of treatment, which typically represents the CA-125 changes after the first couple of chemotherapy cycles.
There have also been studies on changes of CA-125 levels as kinetic parameters such as half-life and doubling time of CA-125, time to reach CA-125 nadir, and CA-125 area under the curve (AUC) [13,22-24]. However, focus on single CA-125 values at specific time points may only reveal a limited relationship to OS. A notable feature of CA-125 is that it is measured repeatedly over time. Here, a comparison of the predicative values of using CA-125 half-life and time-to-nadir with longitudinal CA-125 revealed that longitudinal CA-125 performed better in predicting OS. This suggests that longitudinal measurements contain valuable information that cannot be fully represented by examining a single value or a kinetic factor. In addition, studies that considered CA-125 over a period of time treated multiple CA-125 levels individually [20,25,26], and there is so far no report that has taken all the measurements and fitted them concurrently to a survival model.
In contrast, here all available CA-125 measurements of patients regardless of whether a patient has missing data or not were used. Furthermore, the model was constructed based on an assembly of patients regardless of factors such as tumor type, stage, and chemotherapeutic agent, which enabled the model to be applicable to a wide population without recruitment restrictions. This approach would be potentially helpful to gynecologic oncologists to make better informed decisions in patient counseling with all the available information.
No other effort has achieved OS prediction with longitudinal CA-125, which has obvious medical applications. In the management of many diseases, there are important markers that are taken repeatedly over time to monitor prognosis, such as CA 19-9 in pancreatic cancer [27] and CA15-3 in breast cancer [28]. Our model provides a simple alternative to investigating how OS is related to those longitudinally measured markers and is accessible online (http://www.math.nsysu.edu.tw/~cchang/predict_survival/).
We included FIGO stage and residual tumor size as covariates in our model. Patients at an early stage (FIGO I and II) usually have a much better prognosis than those at an advanced stage (FIGO III and IV) [2], and their CA-125 profiles may also be quite different. Similarly, patients who had a small residual tumor size (<1 cm) after surgery had a better prognosis than those with larger residual tumor (≥1 cm) [7]. Inclusion of these covariates could adjust for potential confounding effects, and the validation result confirmed that prediction with CA-125, stage and residual tumor size could reach a high accuracy.
Another prominent feature of our model is that it could give prediction of a future patient's survival probability at any time point with patient-specific CA-125 observations. To test the performance of our prediction, we performed validation based on 3-year survival probability. The accuracy in the multiple validation efforts was very stable, with an average accuracy of 85.4%, ranging from 80.0% to 88.0%. This result confirmed that longitudinal CA-125 could be used as a reliable prediction factor for OS. The fact that multiple validation based on random selections gave stable results suggests that this model could be applied to various patient populations. However, it is necessary to validate the model in a large, heterogeneous external population in the future. It should be noted that since we based the OS prediction on longitudinal CA-125, the survival probability of a patient, who does not show elevated levels of CA-125 throughout the course, might be overestimated in our model. About 20% ovarian cancer patients have low CA-125 concentration [29]. Fitting the model with a low CA-125 patient pool could solve the potential problem, and this relies on acquisition of more patient information.
In conclusion, longitudinal CA-125 measurements from the time of diagnosis to the completion of primary chemotherapy are significantly associated with and can reliably predict OS in patients with ovarian cancer. Future studies should be directed to explore other prognostic factors in their relation to OS, and the model should be tested in a large, external, and heterogeneous population.

 XML Download