

 PDF
PDF ePub
ePub Citation
 Print
Print


INTRODUCTION
Curative surgery for gastric cancer fundamentally consists of gastrectomy and lymphadenectomy [12]. However, despite the favorable oncological outcomes, gastrectomy alters the patient's food reservoir and dietary habits, which may negatively affect their nutritional status [345].
Quality of life (QoL) represents the patient's perception of their status in life, which is affected by both their illness and its treatment [6789]. Various tools are used to assess QoL [10111213]; the emergence of multi-scale QoL tools, which assign a numerical value for each scale, has facilitated the collection of data regarding QoL from various perspectives [1415]. A recent study on the changes in QoL after gastrectomy revealed significant postoperative QoL deterioration in scales related to food intake and dietary habits, as well as indicating a correlation between QoL and nutritional status [16]. However, to the best of our knowledge, no studies have evaluated the association between nutritional status and QoL in detail. This type of study may facilitate QoL assessments that can guide personalized nutritional treatments rather than simply provide impersonal research data.
The clinical applicability of QoL assessments must be considered in order to facilitate their use to guide personalized treatments in the clinical setting. However, attempts to use QoL assessments in the clinical setting have been unsuccessful. This may be related to the fact that researchers prefer multi-scale QoL tools, which provide continuous numerical values that enable statistical comparisons. However, the transformation from patient responses to these continuous values is a complex process and the interpretation of the transformed values without comparative reference values is impossible. In this context, categorical variables with descriptions that reflect the patient's self-perception regarding their status may be more useful in the clinical setting. Therefore, the present study aimed to identify QoL scales with nutritional relevance that might be used to support personalized treatment, such as nutritional assessment and support, upon their deterioration after gastrectomy. The present study used data obtained from the European Organisation for Research and Treatment of Cancer (EORTC) Quality of Life Questionnaire-Core 30 (QLQ-C30) and Quality of Life Questionnaire-Stomach (QLQ-STO22) to evaluate categorical values from their constituent items (rather than continuous values from their scales). These values were used to create healthy and poor QoL groups for each scale and we evaluated the changes in nutritional status (e.g., body composition and nutritional profile) based on the QoL item-level analysis in order to determine whether they might facilitate personalized treatment for individual QoL respondents.
MATERIALS AND METHODS
Study groups
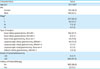
This study's retrospective design was approved by the institutional review board of Kyungpook National University Hospital (No. 201604018). Between January 2008 and December 2010, 1,315 patients underwent curative gastrectomy for gastric cancer at the Kyungpook National University Hospital. Their QoL, body composition, and nutritional profile data were obtained during the preoperative period and their annual follow-ups after surgery. Among the 1,315 patients, a complete dataset from the preoperative and postoperative 5-year periods was available for 513 patients. However, 184 patients were excluded because they had co-morbidities (e.g., cardiovascular disease, cerebrovascular disease, chronic hepatic disease, chronic respiratory disease, and diabetes mellitus) that could have influenced their QoL, while 31 were excluded because they had undergone other operations. Therefore, 298 patients were included in the analysis; their demographic characteristics are shown in Table 1.
Table 1
Characteristics of the 5-year survivors (n=298)
To identify groups with and without QoL deterioration, based on the item scores for each scale of the EORTC QLQ-C30 and QLQ-STO22, we used the concept of QoL vulnerability. All constituent items, except for 2 items related to global health status/QoL, have numerical scores from 1–4, where scores of 1, 2, 3, and 4 represent “not at all”, “a little”, “quite a bit”, and “very much”, respectively (Supplementary Table 1). Respondents with a preoperative item score of 1 and a 5-year postoperative score of 2–4 were defined as vulnerable respondents. In other words, patients with pre-postoperative response shifting from “not at all” to “a little,” “quite a bit,” or “very much” were considered to have QoL vulnerability. Respondents with preoperative and postoperative item scores of 1 were defined as non-vulnerable respondents. For global health status/QoL, the 2 constituent items have numerical scores of 1–7, where 1 represents “very poor” and 7 represents “excellent”. Respondents with preoperative item scores of 5–7 and postoperative scores of 1–4 were defined as vulnerable respondents. Respondents with preoperative and postoperative item scores of 5–7 were defined as non-vulnerable respondents (Table 2). Respondents with a poor baseline QoL (preoperative item score of ≥2 or global health status scale/QoL score of ≤4) were excluded from the analyses. For each QoL scale, the vulnerable and non-vulnerable respondents were identified and their postoperative changes in body composition and nutritional profile were compared.
Table 2
Verification of QoL vulnerability based on item response analysis of 5-year survivors for each scale on the EORTC QLQ-C30 and QLQ-STO22
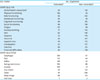
QoL = quality of life; EORTC = European Organisation for Research and Treatment of Cancer; QLQ-C30 = Quality of Life Questionnaire-Core 30; QLQ-STO22 = Quality of Life Questionnaire-Stomach.
*Patients with item response shifts of 1 to 2–4 for any constituent items of the scale; †Patients with item response shifts of 1 to 1 for all constituent items of the scale; ‡Adjusted vulnerability criteria with vulnerable and non-vulnerable responses represented as 5–7 to 1–4, and 5–7 to 5–7 shifts in item responses, respectively.
QoL assessment
The EORTC has cancer-specific multi-scale QoL measures that are available in various languages for QoL assessment in different cultural settings [1718192021]. The present study used the Korean versions of the EORTC QLQ-C30 and its gastric cancer-specific module (EORTC QLQ-STO22) [22]. The EORTC QLQ-C30 and QLQ-STO22 are self-administered tools that include a total of 52 items. Preoperative QoL was assessed upon admission for surgery and the 5-year postoperative QoL was assessed at the fifth annual follow-up.
Assessment of body composition and nutritional profile
Direct segmental multi-frequency bioelectrical impedance analysis (InBody 3.0; Biospace, Seoul, Korea) was used to assess body composition before and 5 years after surgery, based on the manufacturer's instructions. This analysis provided data on the following variables: body weight, body mass index, total body water, soft lean mass, body fat mass, percent body fat, waist-hip ratio, and degree of obesity. Blood tests before and 5 years after surgery were also used to measure the values for hemoglobin, total lymphocyte count, albumin, iron, and total cholesterol. The 5 blood and 8 body composition variables were combined into a set of 13 metabolic-nutritional indices.
Statistical analysis
The preoperative and 5-year postoperative values for the 13 metabolic-nutritional indices were compared for all patients using paired t-tests. Student's t-tests were used to compare changes in the metabolic-nutritional indices (baseline vs. 5-year follow-up) for the vulnerable and non-vulnerable respondents who were identified using each QoL scale. Differences with P-values of <0.05 were considered statistically significant. All statistical analyses were performed using IBM SPSS Statistics for Windows, version 22.0 (IBM Corp., Armonk, NY, USA).
RESULTS
Overall nutritional characteristics
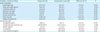
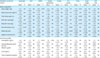
The baseline and follow-up body composition and nutritional data for all patients are shown in Table 3. Significant postoperative decreases were observed for all body composition variables and for 2 nutritional variables. A significant postoperative increase was observed for iron.
Table 3
Comparisons of body composition and nutritional profiles assessed at preoperative and postoperative 5-year periods for all patients (n=298)
Nutritional changes based on vulnerability according to the EORTC QLQ-C30
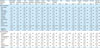
No significant differences were observed in the metabolic-nutritional index changes when the vulnerable and non-vulnerable respondents were compared based on the global health status scale/QoL of the EORTC QLQ-C30 (Table 4). However, comparisons according to QoL vulnerability based on the 5 functional scales of the EORTC QLQ-C30 revealed a significant difference in the metabolic-nutritional changes for a single index in each of the physical and emotional functioning scales. For the symptom scales and single items of the EORTC QLQ-C30, significant differences between the vulnerability counterparts were observed for changes in multiple metabolic-nutritional indices, including the nausea/vomiting (waist-hip ratio, P=0.006; degree of obesity, P=0.025), dyspnea (hemoglobin, P=0.048; iron, P=0.036), and constipation (body fat mass, P=0.044; percent body fat, P=0.031) scales. In these comparisons, the vulnerable groups all exhibited significant metabolic-nutritional shortcomings. Based on the pain scale, the vulnerable group exhibited a significant deterioration in a single metabolic-nutritional index.
Table 4
Changes in body composition and nutritional profiles after surgery among 5-year survivors with vulnerable and non-vulnerable responses to items on the EORTC QLQ-C30
Nutritional changes based on vulnerability according to the EORTC QLQ-STO22
Comparison of the metabolic-nutritional changes among the vulnerable counterparts for each scale of the EORTC QLQ-STO22 based exhibited significant decreases in multiple indices on the taste scale (vs. the non-vulnerable group), including body weight (P=0.001), total body water (P=0.023), soft lean mass (P=0.018), and body fat mass (P=0.045) (Table 5). Multiple shortcomings in metabolic-nutritional indices were also observed among the vulnerable groups, including dysphagia (body fat mass, P=0.042; percent body fat, P=0.032), reflux (body weight, P=0.037; hemoglobin, P=0.004), and dry mouth (percent body fat, P=0.026; waist-hip ratio, P=0.003). Based on eating restriction scale, the vulnerable group scale exhibited a significant deterioration in a single measure.
Table 5
Changes in body composition and nutritional profiles after surgery among 5-year survivors with vulnerable and non-vulnerable responses to items on the EORTC QLQ-STO22
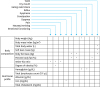
The QoL scales with significant differences in metabolic-nutritional changes, thus exhibiting nutritional shortcomings among vulnerable QoL responders, are summarized in Fig. 1.
Fig. 1
QoL scales with significant differences in metabolic-nutritional changes, exhibiting the nutritional shortcomings of the vulnerable QoL responders to the EORTC QLQ-C30 and QLQ-STO22.
QoL = quality of life; EORTC = European Organisation for Research and Treatment of Cancer; QLQ-C30 = Quality of Life Questionnaire-Core 30; QLQ-STO22 = Quality of Life Questionnaire-Stomach.
*P<0.05; †P<0.01.
DISCUSSION
At 5 years after gastrectomy, shortcomings in metabolic-nutritional indices were observed among specific QoL vulnerable groups, including the emotional functioning, nausea/vomiting, pain, dyspnea, and constipation scales of the EORTC QLQ-C30 and the dysphagia, reflux, eating restrictions, dry mouth, and taste scales of the EORTC QLQ-STO22. Among these groups, vulnerable responses to the taste scale were associated with the greatest number of shortcomings in the metabolic-nutritional indices (4 of the 13 tested measures).
QoL deterioration after gastrectomy for gastric cancer has been reported [121323]; thus, there is a need for continued efforts to manage these deteriorations and restore QoL [162425]. Nutritional support has been frequently suggested, along with symptomatic, social, economic, and psychiatric support. However, these suggestions were made based on interpretations of the names of the QoL items or scales, which contain words or phrases related to the patient's nutritional status, food habits, and digestive ability. Nevertheless, to the best of our knowledge, there are no specific data regarding QoL vulnerabilities that could lead to nutritional deprivation or that could indicate nutritional deprivation, which might indicate the need for additional nutritional support. Our investigation revealed that metabolic-nutritional status was related to specific QoL vulnerabilities (e.g., nausea/vomiting in the EORTC QLQ-C30 and dysphagia and reflux in the EORTC QLQ-STO22). In this context, interpretation of the names of these scales and items suggests that nutritional support may be needed if there are deteriorations in these scales and items. However, there was no relationship between metabolic-nutritional status and the scales of physical functioning, fatigue, appetite loss, and diarrhea from the EORTC QLQ-C30, despite the fact that the interpretation of these scales' names could suggest a close association with metabolic-nutritional status. Furthermore, significant associations were observed between metabolic-nutritional status and scales of specific symptoms (constipation and dyspnea in the EORTC QLQ-C30 and dry mouth and taste in the EORTC QLQ-STO22), which have names that could be argued as being related to the patient's metabolic-nutritional status.
In the clinical setting, the rationales for specific clinical treatments after gastrectomy have been unclear for patients who report experiencing dry mouth or abnormal taste. Therefore, our findings suggest that, if patients experience ongoing QoL deterioration based on these scales, it is appropriate to conduct nutritional assessments and provide nutritional support if needed. One may still suspect the influence of chemotherapy on QoL related to taste even 5 years after the surgery. However, in our study, the chemotherapy/non-chemotherapy ratios among the vulnerable and non-vulnerable groups regarding the taste scale were 1:4.7 and 1:9.3, respectively, without a significant statistical difference. Our findings also suggest that patients may complain of constipation after gastrectomy, which is based not only on functional deterioration in the defecation process but also on a decreased intake of food, which is needed to form feces. Moreover, symptomatic treatment is needed for patients with QoL deterioration in the nausea/vomiting, dysphagia, and reflux scales. Prolonged and uncorrected deterioration in these scales may lead to nutritional deprivation requiring nutritional assessment and support.
The results of a previous study suggested that additional nutritional support can provide QoL benefits, as measured by physical and role functioning in the EORTC QLQ-C30 and body image in the EORTC QLQ-STO22 [16]. However, the vulnerable groups identified based on these scales did not exhibit nutritional shortcomings in the present study. In this context, the physical functioning scale reflects a subjective evaluation of the patient's physical strength, which is altered after gastrectomy. Therefore, as our findings do not indicate that additional nutritional support is useful for patients with QoL deterioration in this scale, it may be appropriate to recommend regular exercise to these patients. Furthermore, the role functioning scale reflects the patient's self-assessed ability to perform their daily and leisure activities; thus, institutional assistance regarding these activities may be useful in these patients. Moreover, body image reflects the patient's self-confidence, which can be negatively affected by both gastric cancer and gastrectomy. Therefore, because a vulnerability in body image was not strongly associated with nutritional status, further studies are needed to evaluate psychiatric counseling as a method to help restore self-confidence and self-esteem.
The features that need to be addressed include accessibility and construability. The analyses of metabolic-nutritional status were based on bioelectrical impedance analyses and blood tests. Unlike these objective parameters evaluated additionally for research purposes, the subjective presentation of the patient's status, as assessed the QoL scales, could easily be determined in clinical settings. In other words, regarding the accessibility of the measures, the subjective presentation of the patients should have practical advantages over objective parameters and QoL vulnerability in certain items should trigger metabolic-nutritional assessment. Construability is critical to the personalized clinical use of QoL outcomes. In this context, the EORTC QLQ-C30 and QLQ-STO22 scores scale from 0–100 to describe QoL status, which allows researchers to perform statistical comparisons between different groups. However, these numerical scale scores are not readily available in clinical practice and complicated transformation processes are needed to convert the item scores into scale scores. Moreover, there are no uniform reference values for each QoL scale and it is impossible to assign a measure of clinical significance to a numerical scale score without these reference values. In contrast, categorical responses from the scales' constituent items provide a measure of the patient's status with descriptive notes that can be easily understood by both patients and clinicians. Therefore, categorical responses to QoL items provide a construability advantage compared to numerical values from the QoL scales, which may facilitate personalized clinical treatments based on individual patient QoL responses. Thus, the present study evaluated QoL vulnerability based on item responses, rather than scale scores, in an effort to enable clinicians to provide personalized treatment to patients based on their personal self-reported QoL status.
Before discussing the strengths and limitations of this study, the cause of the unexpected increase in iron level in the postoperative 5-year period should be explored. Unless patients were receiving regular checkups after gastrectomy, an asymptomatic general population with low iron levels would have less chance of having its iron levels checked. Our institutional treatment strategy is to regularly check iron levels after gastrectomy and to provide iron supplementation regardless of symptoms. This may be related to the controversial increase in iron level after gastrectomy.
This study has several strengths. First, previous QoL research has only affected practice trends without providing personalized benefits to participants, while the present study's findings may help to facilitate personalized treatments for specific QoL responses. Second, the present study's findings suggest the need for; 1) nutritional assessment and additional nutritional support (if needed) for patients who experience prolonged QoL deterioration based on emotional functioning, nausea/vomiting, pain, dyspnea, constipation, dysphagia, reflux, eating restrictions, dry mouth, and taste scales, and 2) the timely management of symptoms that might otherwise result in nutritional shortcomings. Finally, while it has been challenging for clinicians to provide specific clinical actions based upon patient complaints of taste abnormality, the results of the present study suggest that taste abnormality is an important clinical presentation of the nutritional status in patients after gastrectomy.
This study also has several limitations. First, this is an exploratory study with retrospective single-center design; thus, it is associated with well-known risks of bias. Further studies are needed to verify the chronological associations between each identified QoL item and the patient's metabolic-nutritional status and to establish connections between specific metabolic-nutritional outcomes and clinical/nutritional needs. Second, despite the large number of patients included in the present study, only 13 and 5 were considered non-vulnerable based on anxiety and hair loss, respectively, in the EORTC QLQ-STO22. This small subset limits the validity of any related statistical analysis. Third, our definition of QoL-vulnerable captured patients with relatively minor deteriorations (e.g., based on global health status scale/QoL scores of 1 to 2, or from 5 to 4). Therefore, future research is needed to generate a larger and more robust pool of QoL and metabolic-nutritional data.
Prolonged QoL deteriorations in emotional functioning, nausea/vomiting, pain, dyspnea, constipation, dysphagia, reflux, eating restrictions, dry mouth, and taste after gastrectomy should motivate clinicians to consider nutritional assessment and additional nutritional support if needed. Despite the seemingly generic nature of taste abnormality, it must not be neglected as it is an important clinical presentation of nutritional status after gastrectomy. Furthermore, QoL item-level analysis rather than scale-level analysis may help to facilitate personalized treatment based on patient QoL responses after gastrectomy.
 XML Download