

 PDF
PDF ePub
ePub Citation
 Print
Print


INTRODUCTION
Type 2 diabetes mellitus (T2DM) as a metabolic disorder has features such as dyslipidemia, insulin resistance, and loss of mass and function of beta-cells.1 Several reports indicate that insulin resistance as a compensatory response leads to a boost in the number of pancreatic beta-cells via the action of circulating growth factors.23 Several studies taking advantage of human and mouse models have shown that hepatocyte-derived growth factors stimulate beta-cell division and therefore confirm the involvement of liver and pancreas in the adaptive increased beta-cell division as a compensatory response in insulin resistance.45 Recently, betatrophin (alternatively referred as ANGPTL8, TD26, IRFL, and lipasin) has been characterized as a new hormone that is expressed mainly in fat and liver tissues. In pharmacologic and genetic mouse models of insulin resistance, it has been shown that hepatic overexpression of betatrophin leads to increased beta-cell proliferation, islet size, insulin content, and improved glucose homeostasis.3 Therefore, based on its role in beta-cell proliferation in insulin resistance, betatrophin is a new candidate for therapeutic applications, such as beta-cell re-proliferation in diabetes.67 In line with these observations, Gusarova et al.8 found that mice that do not produce betatrophin owing to a diet with a high fat content or insulin receptor antagonists develop insulin resistance but their beta-cell proliferation is still normal.
Besides the pivotal role of betatrophin in beta-cell proliferation, previous studies have shown its correlation with altered lipid metabolism.910 In accordance with these reports, a lower serum triacylglycerol (TG) level was observed in betatrophin-null mice in response to refeeding,11 and a significant relationship was found between betatrophin levels and an atherogenic lipid profile.1213 Indeed, betatrophin affects the lipid profile through the regulation of very low density lipoprotein (VLDI) secretion from the liver and the inhibition of lipoprotein lipase activity. In addition to the direct role of betatrophin in lipid metabolism, it may also act along with other angiopoietin-like protein (ANGPTL) family members such as ANGPTL33,5 which regulates cholesterol metabolism in mice and humans.612 Therefore, in this study we intended to investigate the circulating betatrophin concentration and its association with the lipid profile in Iranians with T2DM and in healthy controls.
MATERIALS AND METHODS
1. Subjects
Seventy-five subjects were recruited in the current study, including 40 patients with T2DM (mean age, 58.6 ±7.6 years) and 35 body mass index (BMI)-matched healthy controls (mean age, 59.8±8.06 years). For the diagnosis of T2DM, the American Diabetes Association protocol was used.14 All patients with T2DM received oral hypoglycemic agents. Patients with gestational diabetes, chronic liver and kidney diseases, malignancy, or thyroid disorders and those who used insulin were excluded from the study. Control subjects were selected from those referred to health centers for routine checkups with no history of diabetes and no first-degree relative having diabetes. The study was confirmed by the university ethics committee and written informed consent was obtained from all participants.
2. Laboratory measurements
Blood samples were taken from all subjects after they had fasted for nearly 12 hours. In the next step, serum samples were separated by centrifugation at 2,800×g for 10 min. Subsequently, the lipid profile including total cholesterol, triacylglycerol (TG), high-density lipoprotein cholesterol (HDL-C), and fasting blood sugar (FBS) was assayed by use of a Hitachi-912 Autoanalyser. Low-density lipoprotein cholesterol (LDL-C) levels were measured according to the Friedewald formula. Glycated hemoglobin (HbA1c) was determined by using a BioSystems kit according to the manufacturer's protocol. The concentration of serum betatrophin was measured by using an ELISA kit (Aviscera Bioscience). The ELISA was carried out according to the manufacturer's protocol. All samples were tested in duplicate, and samples with a coefficient of variation (CV) greater than 15% were excluded. Insulin concentration was determined by use of an immunoassay kit (Monobind Inc) and resistance to insulin was evaluated according to the homeostatic model assessment (HOMA-IR) formula [insulin (µU/mL)×glucose (mmol/L)/22.5].15
3. Statistical analysis
Analysis of data was carried out by use of SPSS version 13 (SPSS, Inc, Chicago, IL, USA). Results were reported as means±SDs, and p values less than 0.05 were considered to be significant. Statistical significance was tested with Student's t-tests. Correlations between serum betatrophin concentrations and other biochemical factors were determined by Pearson's correlation. To control for the influence of age and sex on the relationship between betatrophin and FBS, HbA1c, TG, and cholesterol, partial correlation tests were applied.
RESULTS
1. Characteristics of the population
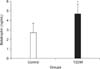
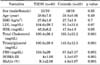
The characteristics of the 75 subjects (40 patients and 35 controls) are summarized in Table 1. Diabetic patients included 52.5% men (n=21) and 47.5% women (n=19), whereas controls included 45.71% men (n=16) and 54.29% women (n=19). The mean ages of the control group and of the patients with T2DM were 59.8±8.06 and 58.6±7.6 years, respectively, whereas the mean BMI was 27.7±1.9 for controls and 27.6±1.6 for patients. The distribution of age, sex, and BMI in the studied groups was not statistically significant as indicated in Table 1. The betatrophin concentration was significantly higher in patients with T2DM than in the control subjects (p=0.001, Fig. 1). Furthermore, the distribution of total cholesterol and TG was significantly different between the patients and control subjects (p=0.001). In addition, HbA1c, FBS, and HOMA-IR were significantly higher in the patients than in the controls (p=0.001), as expected.
2. Correlation of betatrophin with biochemical characteristics
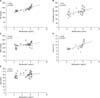
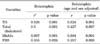
The correlation between betatrophin concentrations and the other parameters was also determined in this study. A significant and positive correlation was found between betatrophin concentration and age (r=0.31, p=0.04), FBS (r=0.35, p=0.02), TG (r=0.82, p=0.001), total cholesterol (r=0.5, p=0.001), and HbA1c (r=0.69, p=0.001) in T2DM patients as shown in Fig. 2. In addition, in the control group, a significant and positive correlation was found between betatrophin concentrations and age (r=0.39, p=0.02), but no correlation was observed between betatrophin and other variables. To prevent the influence of age and sex on the association of betatrophin with TG, cholesterol, HbA1c, and FBS, a partial correlation test was performed. The results as listed in Table 2 showed that there was no effect of age and sex on the aforementioned relationships.
DISCUSSION
Our results demonstrated an increased circulating betatrophin level in patients with T2DM compared with healthy controls. In the current study, in both the T2DM and control groups, there was a positive and significant correlation between betatrophin concentration and age. In addition, in the T2DM patients, significant direct correlations were found between betatrophin and HbA1c, FBS, TG, and total cholesterol. Betatrophin, a novel hormone derived from liver and adipose tissue, was found to stimulate beta-cell proliferation in animal models. It may also regulate TG and total cholesterol metabolism through the inhibition of lipoprotein lipase (LPL) activity and cleavage of ANGPTL3. Our finding is the first report so far indicating a remarkably increased level of betatrophin in Iranian patients with T2DM. Although the betatrophin level has been investigated in several studies, the results are inconsistent and inconclusive. Although there is convincing evidence showing increased betatrophin in T2DM and type 1 diabetes,161718 no elevation in the betatrophin level12 and even its reduction in youth-onset T2DM19 and T2DM have also been reported.20 Considering the literature to date, our observation in Iranian patients with T2DM is in line with recent studies indicating increased betatrophin levels in patients with T2DM and type 1 diabetes.161718
This disparity in the literature may be due to the duration of disease, patient medications, and differences in applied ELISA/EIA kits based on the reactivity of the antibody with the C- or N-terminus of betatrophin.13 The mechanism of increased betatrophin levels in patients with T2DM is still unknown. However, a study by Yi et al.3 in an animal model showed that insulin resistance stimulates upregulation of the betatrophin gene.
Our results also showed a positive correlation of FBS and HbA1c with circulating betatrophin in T2DM. Our finding is supported by the results of Fu et al.,13 which showed a positive correlation of betatrophin with fasting glucose. Indeed, through a transcription factor known as ChREBP (carbohydrate response element binding protein), glucose regulates the expression of several genes involved in carbohydrate metabolism.2122 This transcription factor regulates gene expression by binding to the carbohydrate response element on the target gene. The interesting point is a nucleotide sequence similarity (from -398 to -382) between the transcriptional start site of human betatrophin and the carbohydrate response element. It has also been found that in Hep G2 cells, ChREBP binds to the promoter of the betatrophin gene.23 Thus, considering these points and given that in T2DM, high blood glucose increases the formation of glycosylated hemoglobin on one hand and betatrophin expression on the other, a positive relationship between betatrophin and FBS and HbA1c in T2DM is not unexpected.
In the correlation analysis, we showed that in T2DM and controls, age is positively correlated with circulating betatrophin. The results of studies conducted by Espes et al.18 and Fenzl et al.12 are consistent with our result. In the study by Saisho et al.24 in 167 nondiabetic subjects aged 20 to 120 years, aging was not shown to have a significant effect on beta-cell mass. However, nuclear beta-cell diameter increased with age, and no change was observed in the proportion of apoptotic beta-cells. Therefore, the increased betatrophin levels with age may be due to the compensatory response to aging.
Based on the association of T2DM with an atherogenic lipid profile and the risk of cardiovascular disorders in these patients, we studied the relationship between betatrophin and the lipid profile. In this study, we showed that circulating betatrophin positively correlated with TG and total cholesterol. Betatrophin affects TG metabolism by inhibiting LPL activity and thereby increasing the TG level.925 This finding is in line with the results of work in betatrophin knockout mice, which had a lower serum TG concentration than did the wild type.11 However, the absence of any correlation between betatrophin and TG in newly diagnosed T2DM has also been reported.17 On the other hand, a study conducted on patients with type 1 and type 2 diabetes showed a significant relationship between circulating betatrophin and TG.26 A similar positive correlation was also found between betatrophin and TG or cholesterol in insulin-resistant subjects.12 Age and gender are the most important factors that affect physiological conditions. In this study, in order to eliminate the possible effects of these factors on the observed relationships, partial correlation analysis was performed. Similar to what was reported by Hu et al.,17 our results showed that these relationships were not affected by age and sex. Despite an adequate sample size in this study, however, it seems that studies on a larger number of samples are required.
Overall, the proposed mechanism for the relationship between betatrophin and TG and/or cholesterol is that betatrophin, both directly by inhibition of LPL and indirectly by stimulation of ANGPTL3 cleavage, can affect TG and cholesterol metabolism. In summary, our results showed that in Iranian patients with T2DM, circulating betatrophin levels were significantly increased and there was a high correlation between betatrophin amounts and pathologic lipid levels. Therefore, betatrophin might be considered as a novel therapeutic target in diabetic patients.
 XML Download