Abstract
Purpose:
We attempted to develop a more accurate set of tools for predicting the composition of urinary stone with using Hounsfield units (HUs) in non-enhanced spiral computed tomography (NESCT).
Materials and Methods:
We evaluated 141 stones, and each of which was determined to contain the predominant stone component more than 70% (84 calcium oxalate, 35 uric acid, 16 carbonate apatite, 4 cystine and 2 brushite). NESCT was conducted at different collimations that varied between 3.75mm, 5mm and 7mm through the stones. One region of interest (ROI) was acquired for the plane that passed through the widest transverse diameter of the stone at the bone window setting. The mean size of the ROI in which the highest attenuation area was located was determined to be 2.0±0.5mm2, and we recorded the mean and maximum HU values. In order to assess the partial volume effects, we used the S/C ratio (stone size/collimation ratio).
Results:
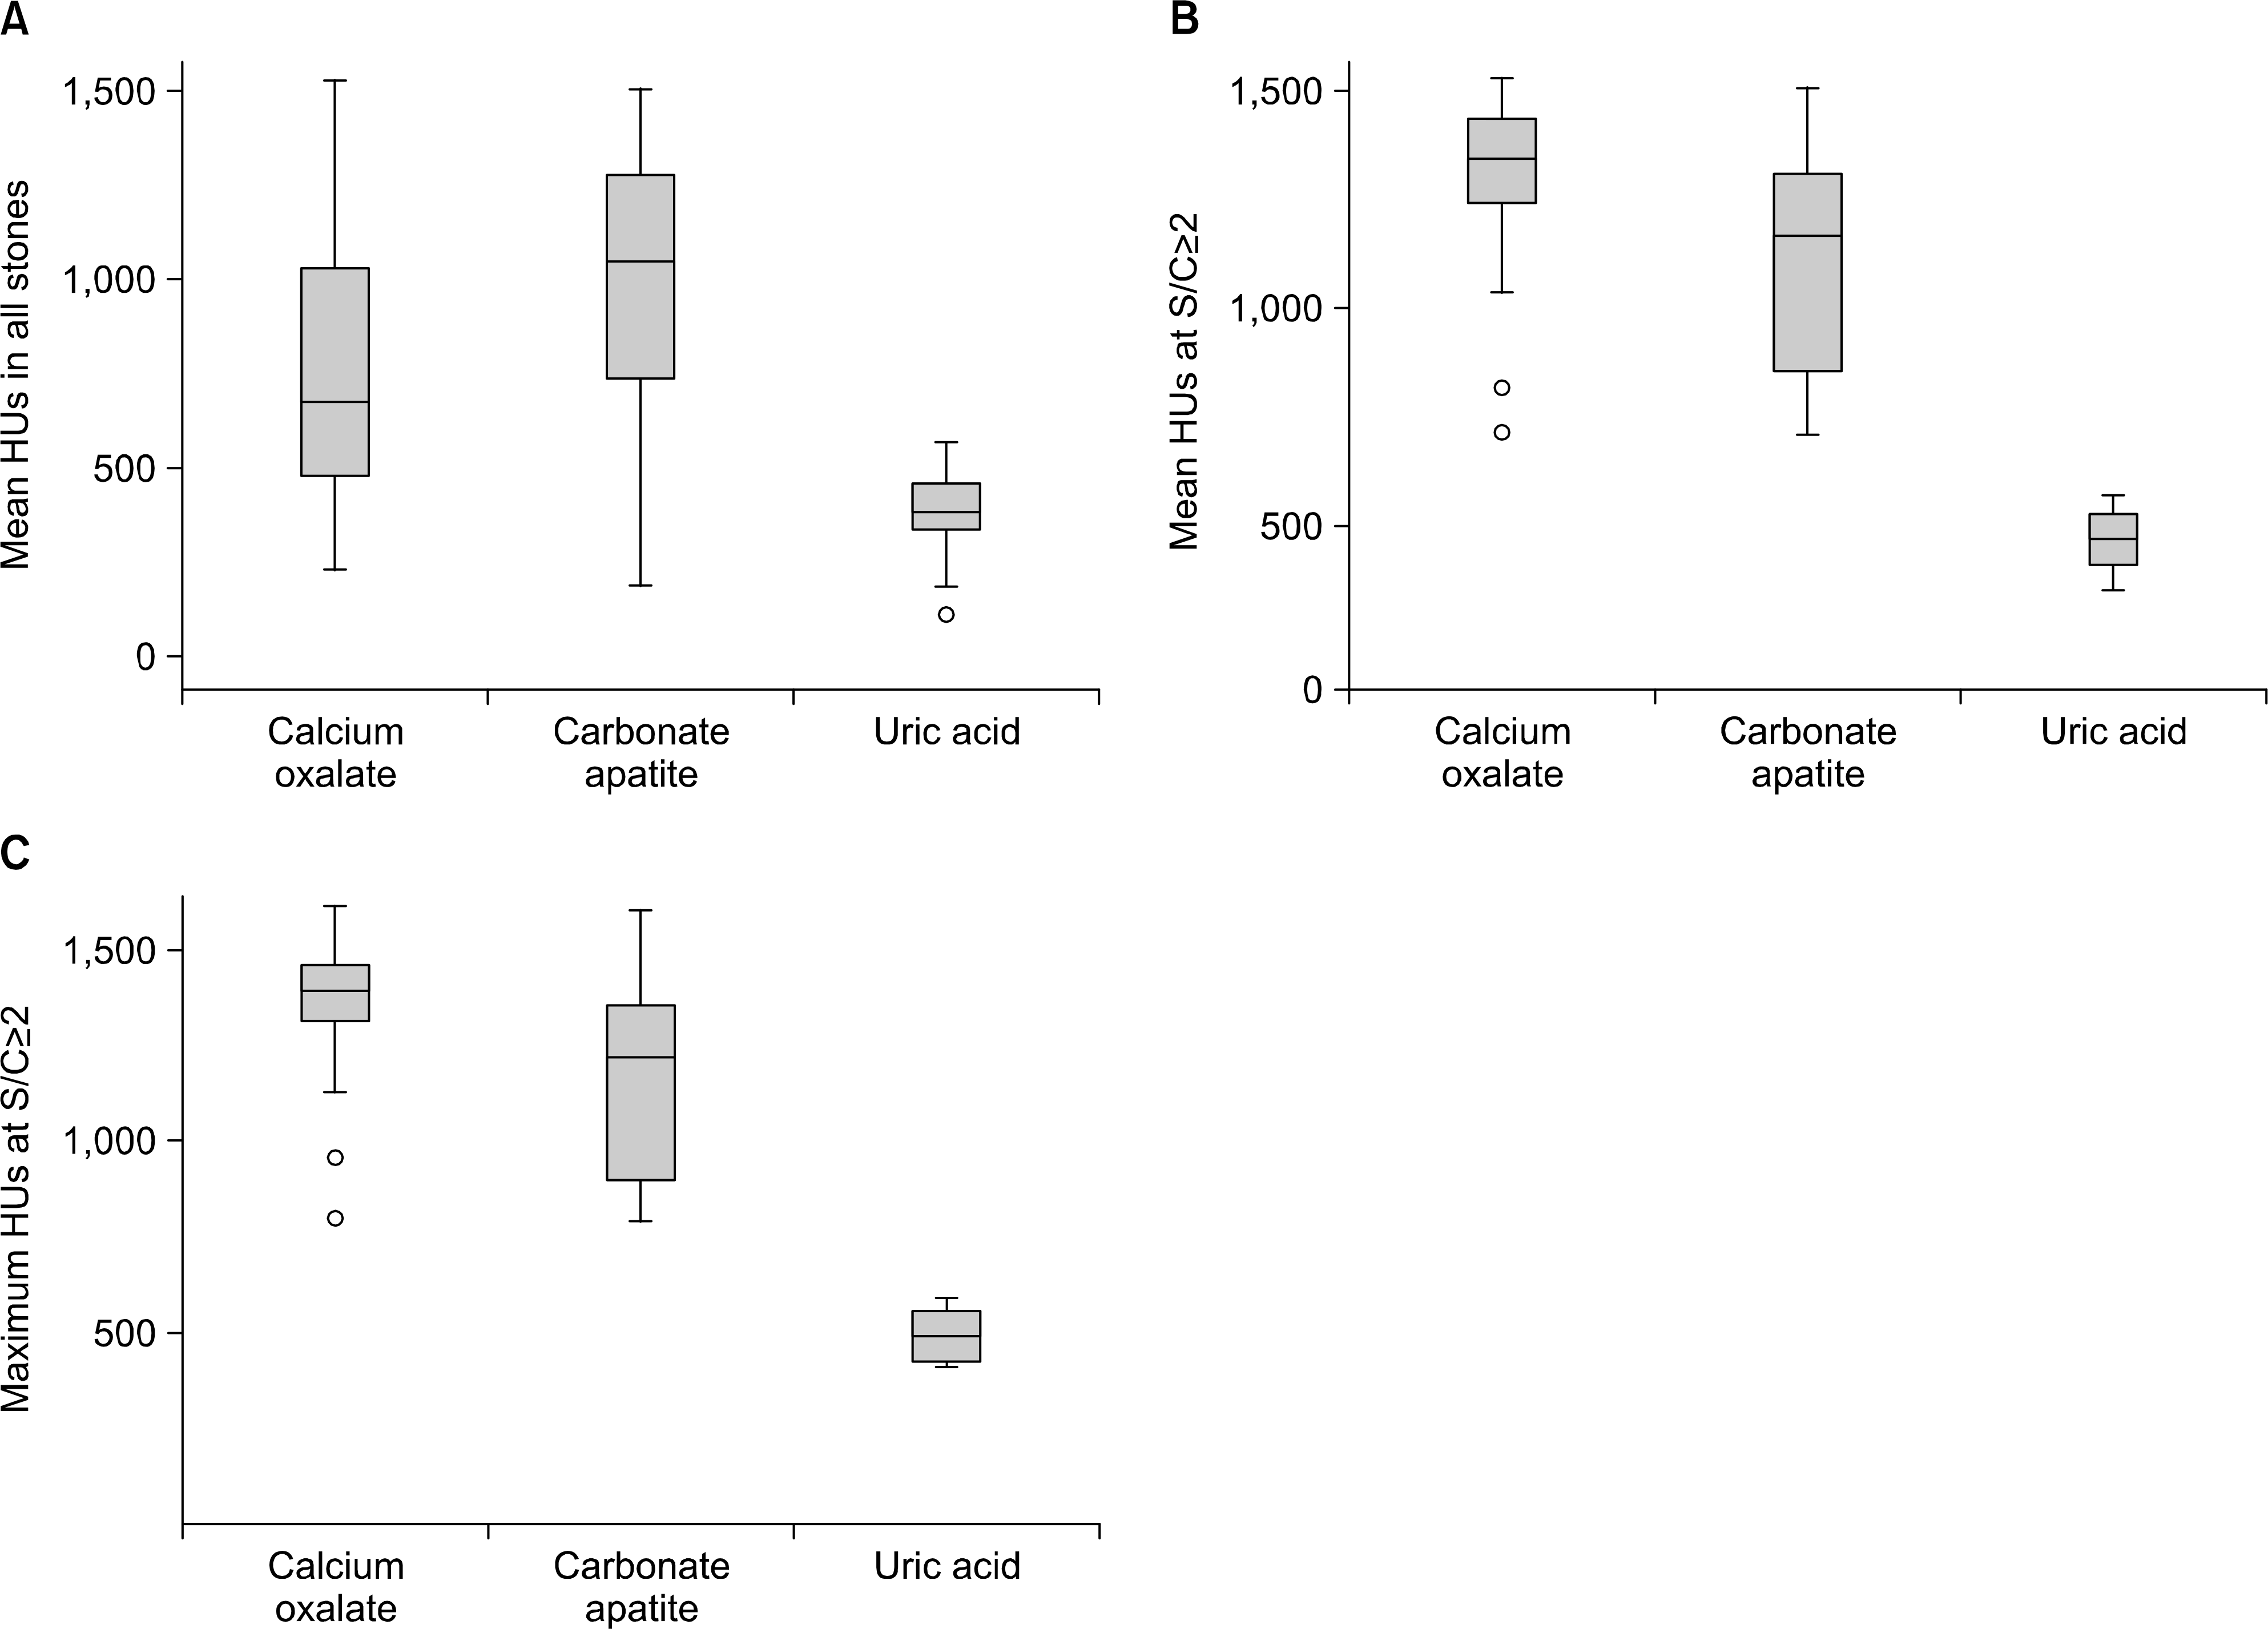
As the S/C ratio increased, both mean and maximum HU values increased, as did the ability to differentiate between different stone compositions. Also, under conditions in which the S/ C ratio exceeded 2, we proved to be able to differentiate uric acid stones from other stones, with no overlap in attenuation. Maximum HU values also proved to be effective tools for determining stone composition, as compared with the mean HU values.
REFERENCES
1.Preminger GM., Vieweg J., Leder RA., Nelson RC. Urolithiasis: detection and management with unenhanced spiral CT– a urologic perspective. Radiology. 1998. 207:308–9.
3.Chae HS., Lee SH. Hounsfield units of urinary calculi as a predictor of the therapeutic effect of extracorporeal shockwave lithotripsy. Korean J Urol. 2006. 47:70–4.

4.Saw KC., McAteer JA., Fineberg NS., Monga AG., Chua GT., Lingeman JE, et al. Calcium stone fragility is predicted by helical CT attenuation values. J Endourol. 2000. 14:471–4.

5.Mitcheson HD., Zamenhof RG., Bankoff MS., Prien EL. Determination of the chemical composition of urinary calculi by computerized tomography. J Urol. 1983. 130:814–9.

6.Nakada SY., Ho伴DG ., Attai S., Heisey D., Blankenbaker D., Pozniak M. Determination of stone composition by noncontrast spiral computed tomography in the clinical setting. Urology. 2000. 55:816–9.

7.Saw KC., McAteer JA., Monga AG., Chua GT., Lingeman JE., Williams JC Jr. Helical CT of urinary calculi: effect of stone composition, stone size, and scan collimation. AJR Am J Roentgenol. 2000. 175:329–32.
8.Mostafavi MR., Ernst RD., Saltzman B. Accurate determination of chemical composition of urinary calculi by spiral computerized tomography. J Urol. 1998. 159:673–5.

9.Kuwahara M., Kageyama S., Kurosu S., Orikasa S. Computed tomography and composition of renal calculi. Urol Res. 1984. 12:111–3.

10.Motley G., Dalrymple N., Keesling C., Fischer J., Harmon W. Hounsfield unit density in the determination of urinary stone composition. Urology. 2001. 58:170–3.

11.Yilmaz S., Sindel T., Arslan G., Ozkaynak C., Karaali K., Kabaalioglu A, et al. Renal colic: comparison of spiral CT, US and IVU in the detection of ureteral calculi. Eur Radiol. 1998. 8:212–7.

12.Dalrymple NC., Verga M., Anderson KR., Bove P., Covey AM., Rosenfield AT, et al. The value of unenhanced helical computerized tomography in the management of acute flank pain. J Urol. 1998. 159:735–40.

13.Smith RC., Verga M., McCarthy S., Rosenfield AT. Diagnosis of acute flank pain: value of unenhanced helical CT. AJR Am J Roentgenol. 1996. 166:97–101.

14.Newhouse JH., Prien EL., Amis ES Jr., Dretler SP., Pfister RC. Computed tomographic analysis of urinary calculi. AJR Am J Roentgenol. 1984. 142:545–8.

15.Deveci S., Coskun M., Tekin MI., Peskircioglu L., Tarhan NC., Ozkardes H. Spiral computed tomography: role in determination of chemical compositions of pure and mixed urinary stones-an in vitro study. Urology. 2004. 64:237–40.

16.Demirel A., Suma S. The efficacy of non-contrast helical computed tomography in the prediction of urinary stone composition in vivo. J Int Med Res. 2003. 31:1–5.

17.Zarse CA., McAteer JA., Tann M., Sommer AJ., Kim SC., Paterson RF, et al. Helical computed tomography accurately reports urinary stone composition using attenuation values: in vitro verification using high-resolution micro-computed tomography calibrated to fourier transform infrared microspectroscopy. Urology. 2004. 63:828–33.

Fig. 1.
Stone composition and Hounsfield unit distributions. (A) Mean Hounsfield unit distributions of each the stone component in all the stones. (B, C) Mean (B) and maximum (C) Hounsfield unit distributions of each stone component on the condition that the S/C was >2.

Fig. 2.
Schematic illustration that shows the relationship between stone size and the collimation width of the computed tomography. (A) In the case in which the stone is smaller than the collimation width (S/C ratio < 1). (B, B’) In the cases in which the stone is larger than the collimation width, but smaller than double the collimation width(1<S/C ratio <2). (C, C’) In the cases in the which the stone is larger than double the collimation width (S/C ratio >2).

Table 1.
Patient and stone characteristics
Table 2.
Mean and maximum Hounsfield unit (HU) of each stone's components


 PDF
PDF ePub
ePub Citation
 Print
Print


 XML Download