

 PDF
PDF ePub
ePub Citation
 Print
Print


Abstract
Background
Although many studies on vitamin D have been conducted, they have not been consistent regarding the method of measurement, the individuals investigated, and the season of blood sampling. Thus, this study was performed to investigate 25-hydroxy vitamin D [25(OH)D] levels and the prevalence of 25(OH)D deficiency by age, region, and season using the standard method for vitamin D measurement.
Methods
A total of 17,252 health examinees (9,180 men and 8,072 women) who were administered the vitamin D test at 16 health promotion centers in 13 cities in Korea from January to December 2013 were selected for this study. Measurements of 25(OH)D2 and 25(OH)D3 were performed by liquid chromatography-tandem mass spectrometry (LC-MS/MS) using the MSMS Vitamin D Kit.
Results
The levels of 25(OH)D were significantly lower among women than men. The median 25(OH)D value was lowest among men and women in their 20s when compared to other age groups. We observed the lowest levels in January and February and the highest levels in August, September, and October. The prevalence of 25(OH)D deficiency (having levels of <10 ng/mL) was significantly higher among women than men. When different age groups were analyzed, the highest rates of 25(OH)D deficiency were found in their 20s, and prevalence decreased with age (up to an age of 60 years). Lastly, the prevalence of 25(OH)D deficiency was highest in Seoul and the Gyeonggi area when compared to other regions.
Figures and Tables
Fig. 1
Distribution of serum 25-hydroxy vitamin D [25(OH)D] levels by age groups (men and women). The bottom and top horizontal lines of the box represent the 25th and 75th percentiles, respectively. The band near the middle of the box represents the median value, and the horizontal lines represent the 5th and 95th percentiles. Kruskal-Wallis test, P<0.001.
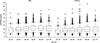
Fig. 2
Distribution of serum 25-hydroxy vitamin D [25(OH)D] levels by month of examination. The bottom and top horizontal lines of the box represent the 25th and 75th percentiles, respectively. The band near the middle of the box represents the median value, and the horizontal lines represent the 5th and 95th percentiles. Kruskal-Wallis test, P<0.001.
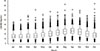
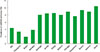
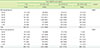
Table 1
The 25-hydroxy vitamin D2 [25(OH)D2], 25-hydroxy vitamin D3 [25(OH)D3], and total 25-hydroxy vitamin D [25(OH)D] levels
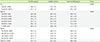
Values are shown as means±standard deviations.
The P value was derived from the Student t-test and one-way ANOVA.
*P<0.001 derived from posthoc comparisons (Dunnett's test) between the 20-29 years age group and the other age groups; †P<0.001 derived from posthoc comparisons (Dunnett's test) between the Dec - Feb group and the other months groups.
Table 2
Prevalence of 25-hydroxy vitamin D [25(OH)D] deficiency, insufficiency, and sufficiency among the study participants by age groups
References
1. Parfitt AM, Gallagher JC, Heaney RP, Johnston CC, Neer R, Whedon GD. Vitamin D and bone health in the elderly. Am J Clin Nutr. 1982; 36:1014–1031.

2. Wengreen HJ, Munger RG, West NA, Cutler DR, Corcoran CD, Zhang J, et al. Dietary protein intake and risk of osteoporotic hip fracture in elderly residents of Utah. J Bone Miner Res. 2004; 19:537–545.
3. Lips P. Vitamin D deficiency and secondary hyperparathyroidism in the elderly: consequences for bone loss and fractures and therapeutic implications. Endocr Rev. 2001; 22:477–501.
4. Bischoff-Ferrari HA, Dietrich T, Orav EJ, Dawson-Hughes B. Positive association between 25-hydroxy vitamin D levels and bone mineral density: a population-based study of younger and older adults. Am J Med. 2004; 116:634–639.
5. Gagnon C, Lu ZX, Magliano DJ, Dunstan DW, Shaw JE, Zimmet PZ, et al. Serum 25-hydroxyvitamin D, calcium intake, and risk of type 2 diabetes after 5 years: results from a national, population-based prospective study (the Australian Diabetes, Obesity and Lifestyle study). Diabetes Care. 2011; 34:1133–1138.
6. Pittas AG, Lau J, Hu FB, Dawson-Hughes B. The role of vitamin D and calcium in type 2 diabetes. A systematic review and meta-analysis. J Clin Endocrinol Metab. 2007; 92:2017–2029.
7. Giovannucci E. Vitamin D and cancer incidence in the Harvard cohorts. Ann Epidemiol. 2009; 19:84–88.
8. Ahonen MH, Tenkanen L, Teppo L, Hakama M, Tuohimaa P. Prostate Cancer risk and prediagnostic serum 25-hydroxyvitamin D levels (Finland). Cancer Causes Control. 2000; 11:847–852.
9. Leu M, Giovannucci E. Vitamin D: epidemiology of cardiovascular risks and events. Best Pract Res Clin Endocrinol Metab. 2011; 25:633–646.
10. Wang TJ, Pencina MJ, Booth SL, Jacques PF, Ingelsson E, Lanier K, et al. Vitamin D deficiency and risk of cardiovascular disease. Circulation. 2008; 117:503–511.
11. Holick MF. Sunlight and vitamin D for bone health and prevention of autoimmune diseases, cancers, and cardiovascular disease. Am J Clin Nutr. 2004; 80:S6. S1678–S1688.
12. Kamen D, Aranow C. Vitamin D in systemic lupus erythematosus. Curr Opin Rheumatol. 2008; 20:532–537.
13. Wilkinson RJ, Llewelyn M, Toossi Z, Patel P, Pasvol G, Lalvani A, et al. Influence of vitamin D deficiency and vitamin D receptor polymorphisms on tuberculosis among Gujarati Asians in west London: a case-control study. Lancet. 2000; 355:618–621.
14. Norman AW. From vitamin D to hormone D: fundamentals of the vitamin D endocrine system essential for good health. Am J Clin Nutr. 2008; 88(2):S491–S499.
15. Holick MF. Vitamin D deficiency. N Engl J Med. 2007; 357:266–281.
16. Ministry of Health and Welfare. Korean health statistics 2010: Korea National Health and Nutrition Examination Survey (KNHANES V-1). Seoul: Ministry of Health and Welfare;2011.
17. Ganji V, Zhang X, Tangpricha V. Serum 25-hydroxyvitamin D concentrations and prevalence estimates of hypovitaminosis D in the U.S. population based on assay-adjusted data. J Nutr. 2012; 142:498–507.
18. Langlois K, Greene-Finestone L, Little J, Hidiroglou N, Whiting S. Vitamin D status of Canadians as measured in the 2007 to 2009 Canadian Health Measures Survey. Health Rep. 2010; 21:47–55.
19. Koivula MK, Matinlassi N, Laitinen P, Risteli J. Four automated 25-OH total vitamin D immunoassays and commercial liquid chromatography tandem-mass spectrometry in Finnish population. Clin Lab. 2013; 59:397–405.
20. Hilger J, Friedel A, Herr R, Rausch T, Roos F, Wahl DA, et al. A systematic review of vitamin D status in populations worldwide. Br J Nutr. 2014; 111:23–45.
21. Batieha A, Khader Y, Jaddou H, Hyassat D, Batieha Z, Khateeb M, et al. Vitamin D status in Jordan: dress style and gender discrepancies. Ann Nutr Metab. 2011; 58:10–18.
22. Heaney RP. Vitamin D endocrine physiology. J Bone Miner Res. 2007; 22:V25–V27.
23. Prevention and Management of Osteoporosis. World Health Organ Tech Rep Ser. 2003; 921:1–164.
24. Bischoff-Ferrari HA, Giovannucci E, Willett WC, Dietrich T, Dawson-Hughes B. Estimation of optimal serum concentrations of 25-hydroxyvitamin D for multiple health outcomes. Am J Clin Nutr. 2006; 84:18–28.
25. MacLaughlin J, Holick MF. Aging decreases the capacity of human skin to produce vitamin D3. J Clin Invest. 1985; 76:1536–1538.
26. Mithal A, Wahl DA, Bonjour JP, Burckhardt P, Dawson-Hughes B, Eisman JA, et al. Global vitamin D status and determinants of hypovitaminosis D. Osteoporos Int. 2009; 20:1807–1820.
27. Prentice A. Vitamin D deficiency: a global perspective. Nutr Rev. 2008; 66:S153–S164.
28. Ginde AA, Liu MC, Camargo CA Jr. Demographic differences and trends of vitamin D insufficiency in the US population, 1988-2004. Arch Intern Med. 2009; 169:626–632.
29. Goswami R, Gupta N, Goswami D, Marwaha RK, Tandon N, Kochupillai N. Prevalence and significance of low 25-hydroxyvitamin D concentrations in healthy subjects in Delhi. Am J Clin Nutr. 2000; 72:472–475.
30. Mishal AA. Effects of different dress styles on vitamin D levels in healthy young Jordanian women. Osteoporos Int. 2001; 12:931–935.
31. Van der Wielen RP, Löwik MR, van den Berg H, de Groot LC, Haller J, Moreiras O, et al. Serum vitamin D concentrations among elderly people in Europe. Lancet. 1995; 346:207–210.
32. Lips P, Duong T, Oleksik A, Black D, Cummings S, Cox D, et al. A global study of vitamin D status and parathyroid function in postmenopausal women with osteoporosis: baseline data from the multiple outcomes of raloxifene evaluation clinical trial. J Clin Endocrinol Metab. 2001; 86:1212–1221.
33. Hagenau T, Vest R, Gissel TN, Poulsen CS, Erlandsen M, Mosekilde L, et al. Global vitamin D levels in relation to age, gender, skin pigmentation and latitude: an ecologic meta-regression analysis. Osteoporos Int. 2009; 20:133–140.
34. Lips P. Vitamin D status and nutrition in Europe and Asia. J Steroid Biochem Mol Biol. 2007; 103:620–625.
35. Nakamura K, Nashimoto M, Hori Y, Yamamoto M. Serum parathyroid hormone in healthy Japanese women in relation to serum 25-hydroxyvitamin D. Int J Vitam Nutr Res. 2000; 70:287–292.
36. Agarwal KS, Mughal MZ, Upadhyay P, Berry JL, Mawer EB, Puliyel JM. The impact of atmospheric pollution on vitamin D status of infants and toddlers in Delhi India. Arch Dis Child. 2002; 87:111–113.
37. National Osteoporosis Foundation. Clinician's guide to prevention and treatment of osteoporosis. Washington, DC: National Osteoporosis Foundation;2010.
38. The Korean Society of Bone Metabolism. Physician's guide for diagnosis & treatment of osteoporosis. Seoul: The Korean Society of Bone Metabolism;2011.
 XML Download