Abstract
Study design
The degenerative changes in plain X - ray and bone mineral density of the lumbar spine of postmenopausal women was evaluated retrospectively.
Objective
We analyzed the correlation between degenerative arthritis and osteoporosis of lumbar spine, which are common senile spinal disorders in old age.
Summary of literature Review
Inverse relationship has been reported between osteoporosis and osteoarthritis in the studies of hip fractures
Materials and methods
For 108 female patients older than 50 years of age, the degenerative change of lumbar spine was evaluated by scoring with Kellgren's classification of disc degeneration and with Nathan's classification of osteophyte from radiographs of lumbar spine. Bone mineral density of lumbar spine was measured with dual energy X - ray absorptiometry. Osteoporotic fracture of vertebral body was scored by Renier's index. The correlation between the data of degenerative changes and bone mineral density was analyzed.
REFERENCES
1). Byers PD, Contepomi CA, Farkas TA. A post mortem study of the hip joint. Including the prevalence of the features of the right side. Ann Rheum Dis. 29:15–31. 1970.

2). Dequeker J. The relationship between osteoporosis and osteoarthritis. Clin Rheum Dis. 11:271–296. 1985.

3). Dai L. The relationship between vertebral body deformity and disc degeneration in lumbar spine of the senile. Eur Spine J. 7:40–44. 1998.

4). Foss MVL, Byers PD. Bone density, osteoarthrosis of the hip, and fracture of the upper end of the femur. Ann Rheum Dis. 31:259–264. 1972.

5). Grampp S, Jergas M, Gluer CC, Lang P, Brastow P, Genant HK. Radiological diagnosis of osteoporosis: Current methods and perspectives. Radiol Clin North Am. 31:1133–1145. 1993.
6). Grynpas MD, Huckell CB, Reichs KJ, Derousseau CJ, Greenwood C, Kessler MJ. Effect of age and osteoarthritis on bone mineral in rhesus monkey vertebrae. J bone Miner Res. 8:909–917. 1993.

7). Harada A, Okuizumi H, Miyagi N, Genda E. Correlation between bone mineral density and intervertebral disc degeneration. Spine. 23:857–862. 1998.

8). Hasson T, Roos B. The relation between bone mineral content and ultimate compression fractures and disc degeneration in lumbar vertebrae. Spine. 2:147–153. 1981.
9). Healey JH, Vigorita VJ, Lane JM. The coexistence and characteristics of osteoarthritis and osteoporosis. J Bone Joint Surg. 67A:586–592. 1985.

10). Kellgren JH. A tlas of Standard radiographs of arthritis in the epidemiology of chronic rheumatism. 2. Oxford: Blackwell;1963.
11). Margulies JY, Payzer A, Nyska M, Neuwirth MG, Flo-man Y, Robin GC. The relationship between degenerative changes and osteoporosis in the lumbar spine, Clin Orthop. 324:145–152. 1996.
13). Pogrund H, Makin M, Robin G, Menczel J, Stein-berg R. Osteoporosis of the spine, pelvis and Hand. A comparative study in a femoral neck fracture series. Clin Orthop. 139:156–163. 1979.
14). Radin EL, Paul IL, Lowy M. A comparison of the dynamic force transmitting properties of subchondral bone and articular cartilage. J Bone Joint Surg. 52A:444–456. 1970.

15). Renier JC, Bernat M, Fallah N. Etude correlative de osteoporose et de la discarthrose. Rev Rhum. 48:323–330. 1981.
16). Riggs BL, Wahner HW, Dunn WL, Mazess RB, Offord KP, Melton LJ 3rd. Differential changes in bone mineral density of the appendicular and axial skeleton with aging: relationship to spinal osteoporosis. J Clin Invest. 67:328–335. 1981.

17). Saville PD. A quantitative approach to simple radiographic diagnosis of osteoporosis: Its application to the osteoporosis of rheumatoid arthritis. Arthritis Rheum. 10:416–422. 1967.

18). Silberberg R. Histologic and morphometric observations on vertebral bone of aging sand rats. Spine. 13:202–208. 1988.

19). Smith RW Jr, Rizek J. Epidemiologic studies of osteoporosis in women of Puerto Rico and southeastern Michigan with special reference to age, race, national origin and to other related or associated findings. Clin Orthop. 45:31–48. 1966.

20). Verstraeten A, Van Ermen H, Haghebaert G, Nijs J, Geusens P, Dequeker J. Osteoarthrosis retards the development of osteoporosis: Observation of the coexistence of osetoarthrosis and osteoporosis. Clin Orthop. 64:169–177. 1991.
Figures and Tables%
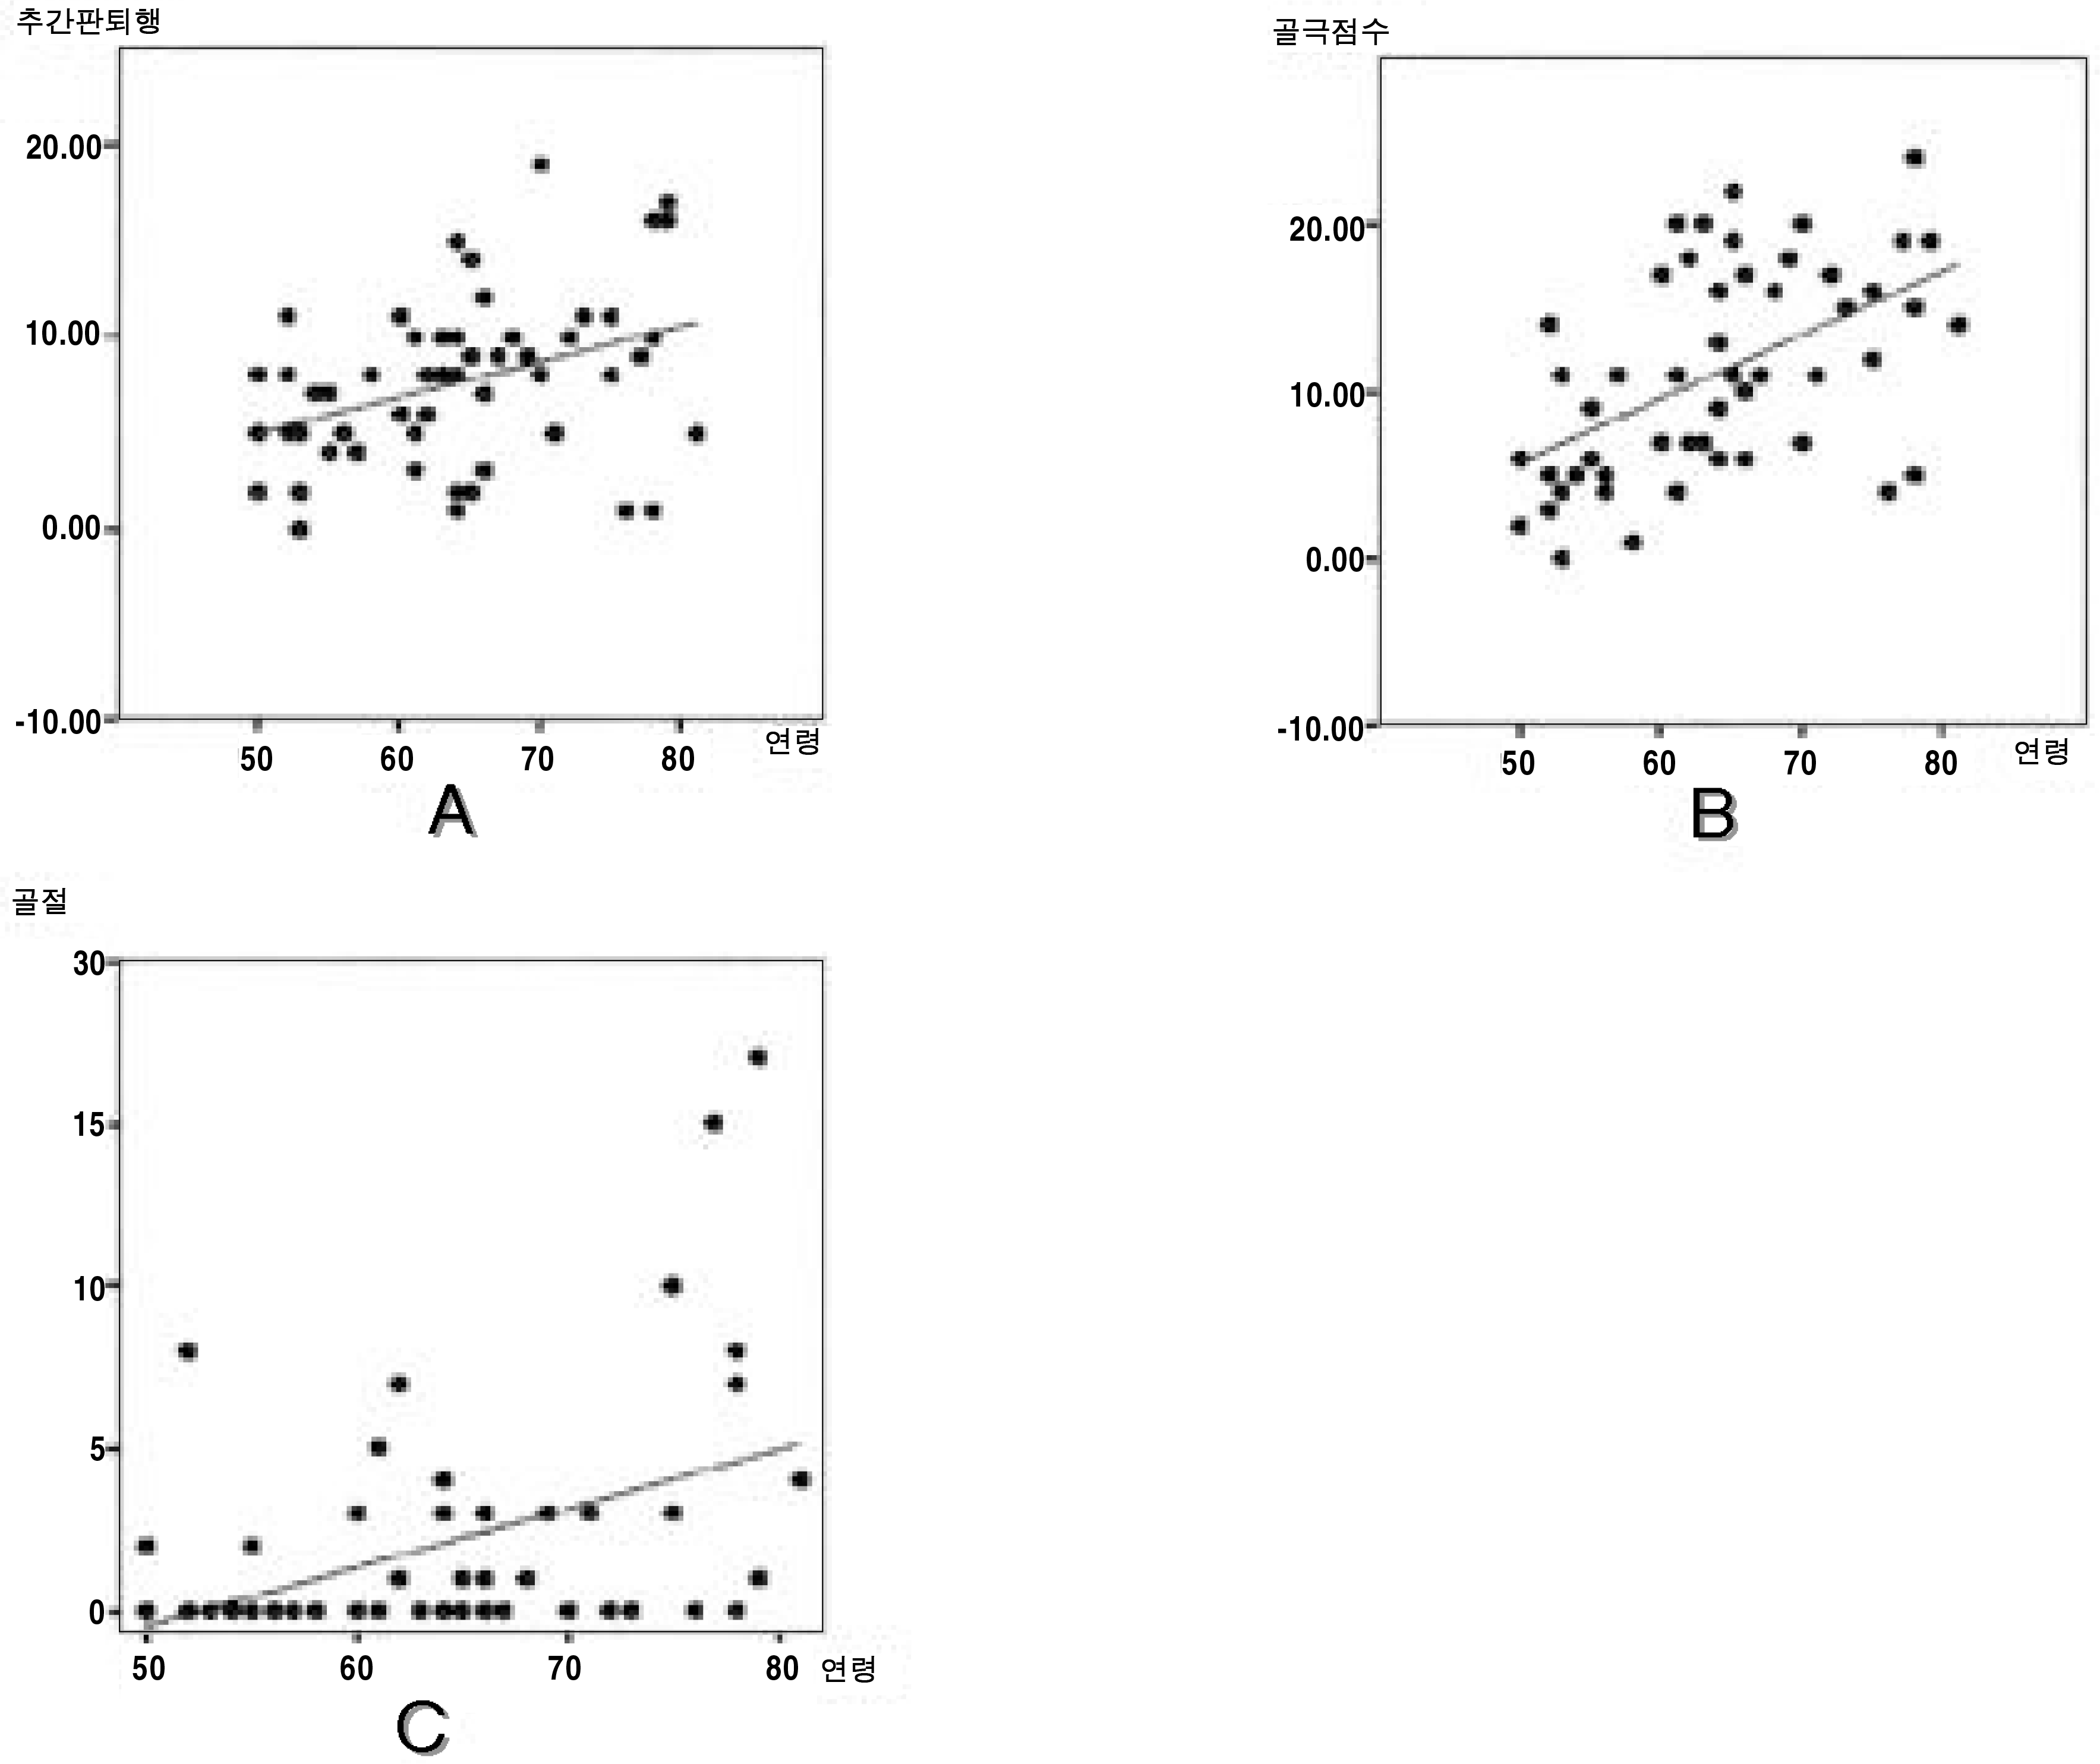
Fig. 1.
Pearson's linear correlation coefficient. A: Positive correlation between age and disc degeneration, B: Positive correlation between age and Nathan osteophyte, C: Positive correlation between age and fracture.

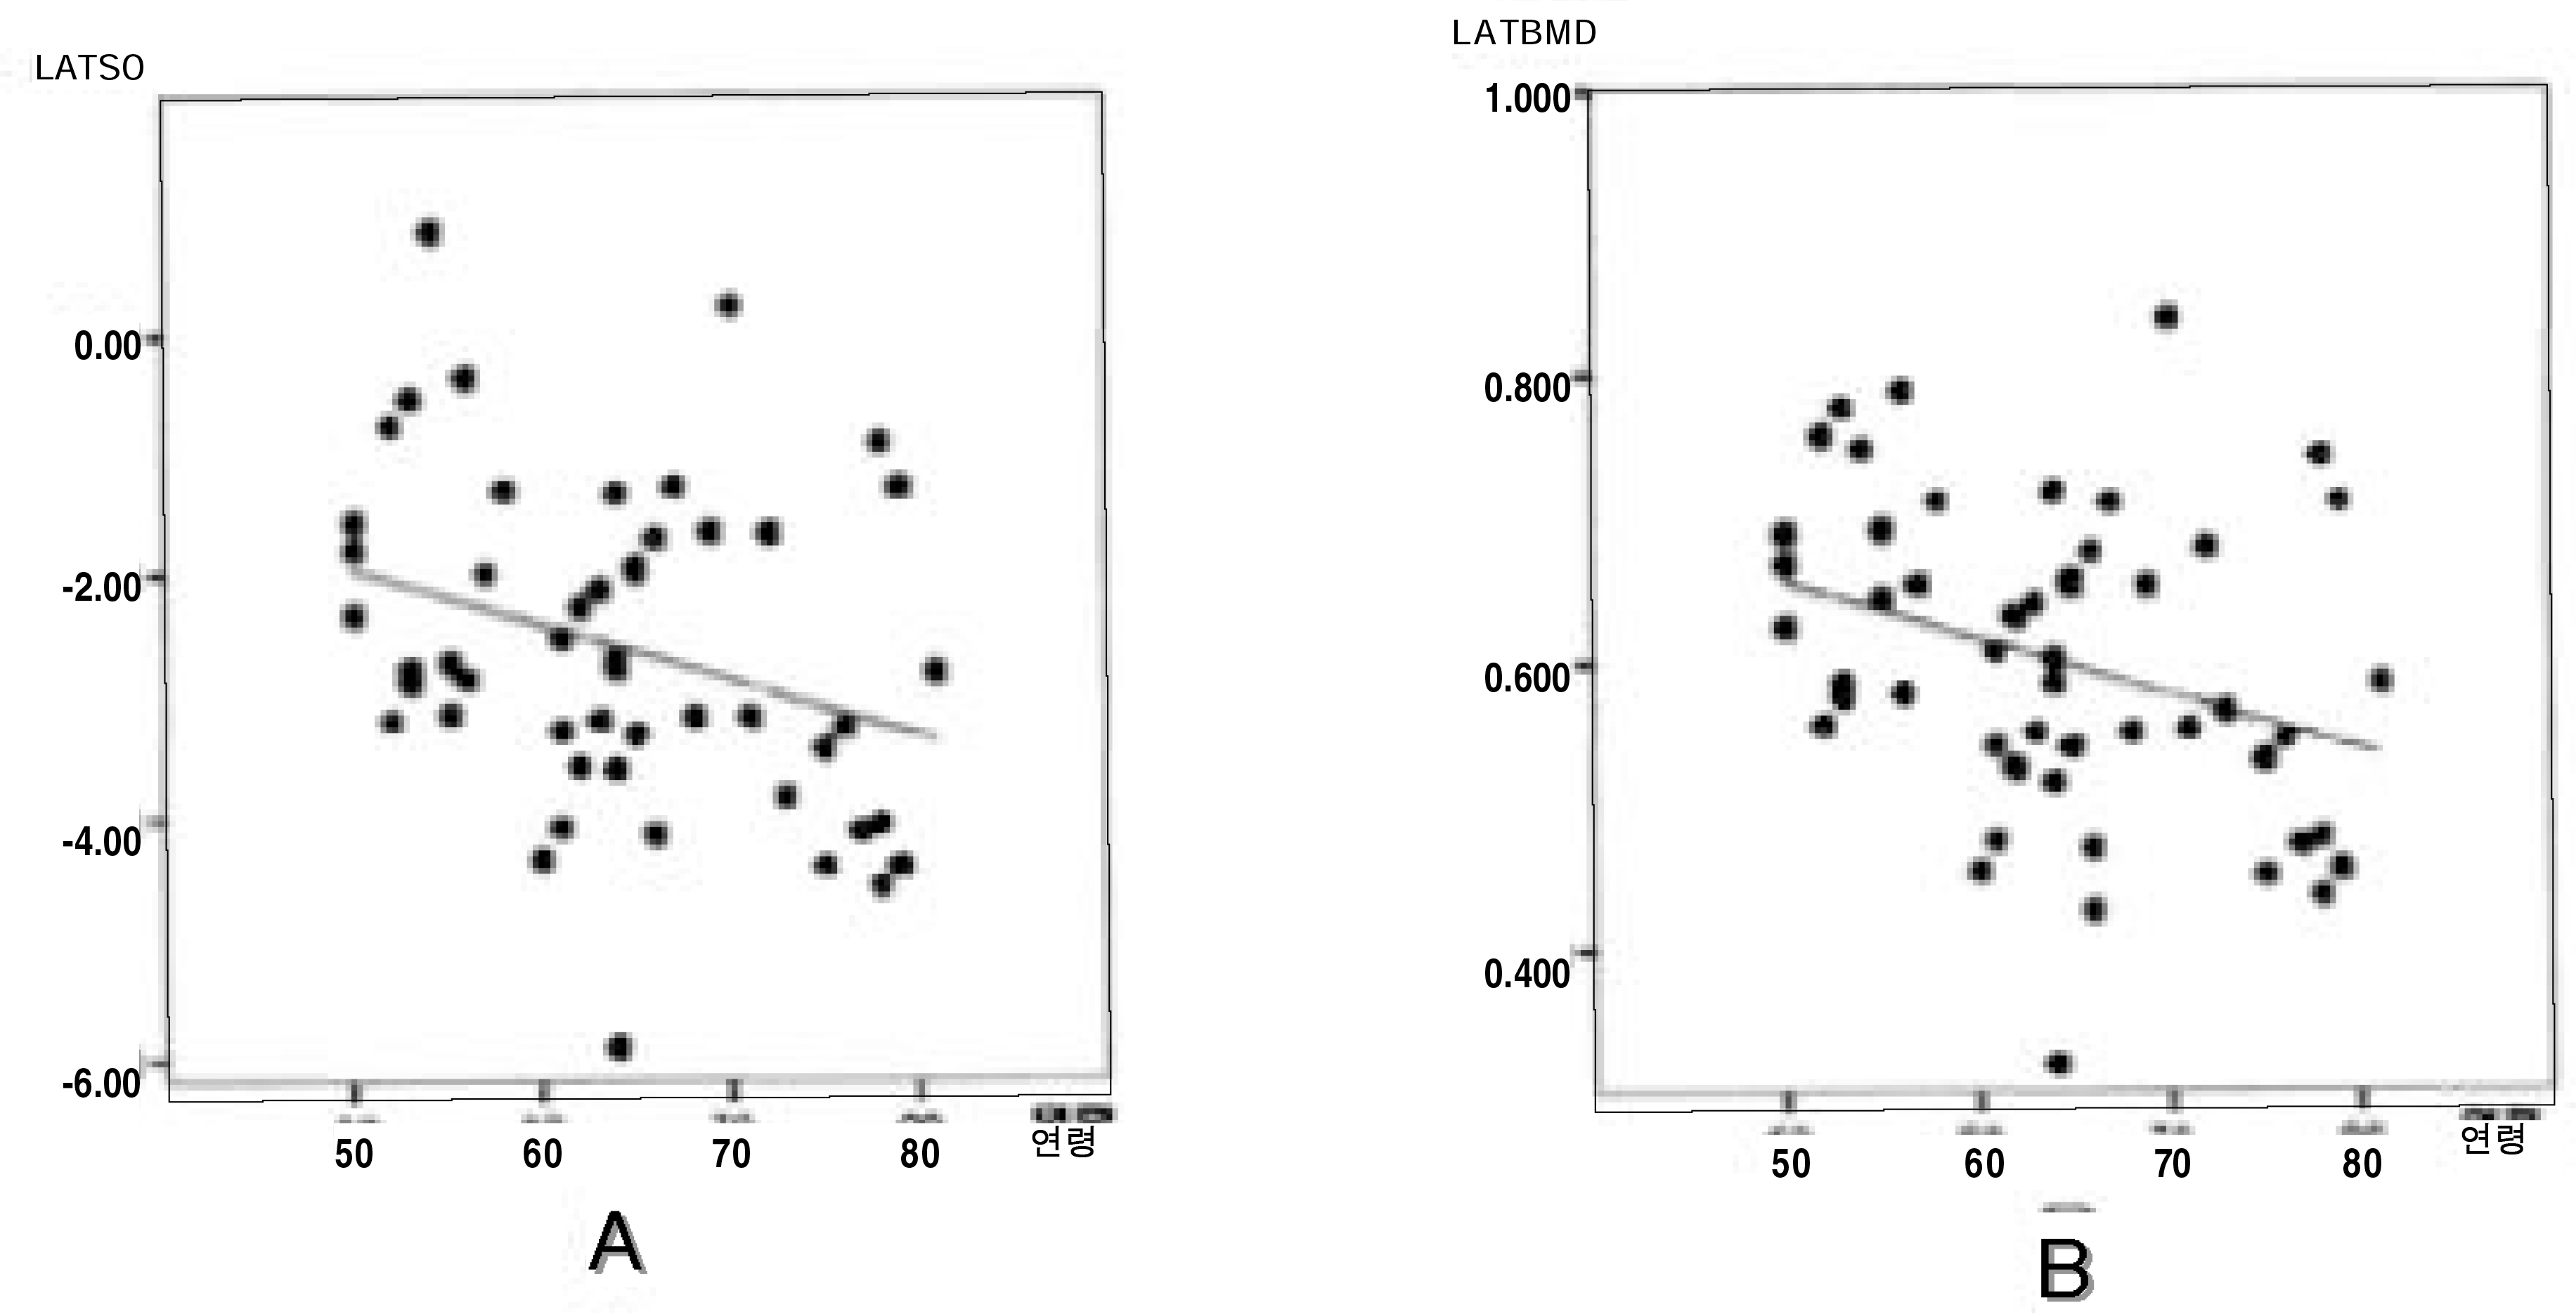
Fig. 2.
Pearson's linear correlation coefficient. A: Negative correlation between age and lumbar spine lateral SD*, B: Negative correlation between age and lumbar spine lateral BMD #. *SD, Mean standard deviation of T score of DEXA; # BMD, Mean bone mineral density(mg/cm2) of T score.

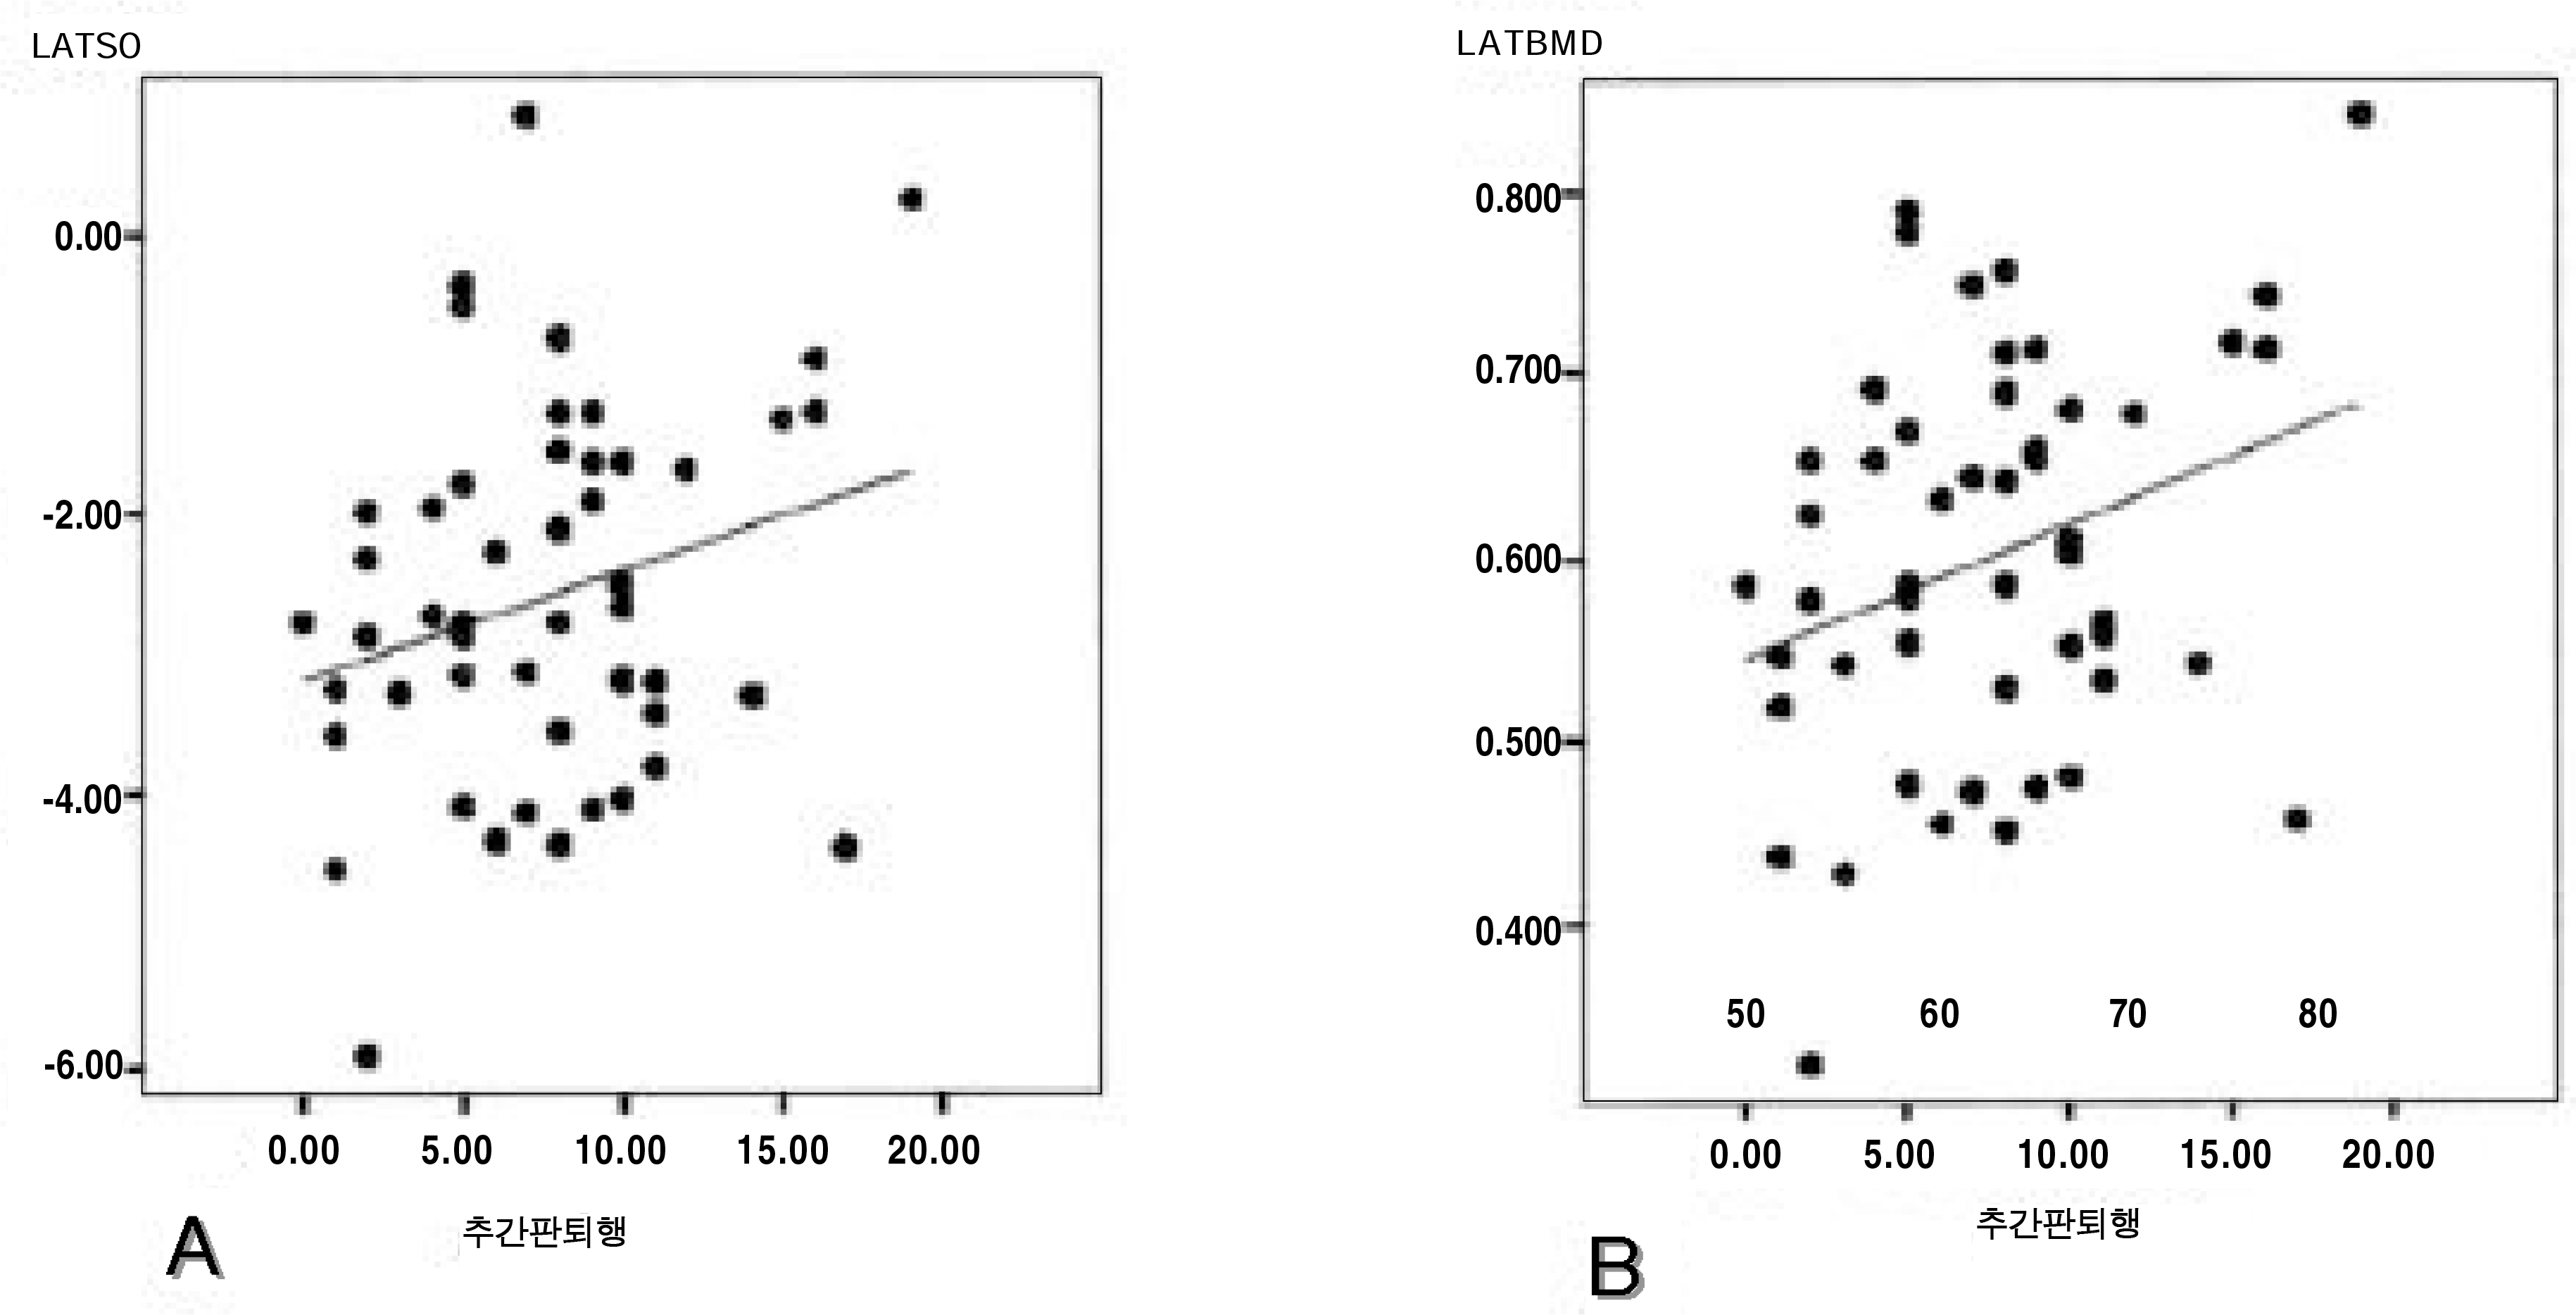
Fig. 3.
Pearson's linear correlation coefficient. A: Positive correlation between disc degeneration and lumbar spine lateral SD*, B: Positive correlation between disc degeneration and lumbar spine lateral BMD#. *SD, Mean standard deviation of T score of DEXA; #BMD, Mean bone mineral density(mg/cm2) of T score.

Table 1.
The distributions of each parameter of patient's age, degenerative change, bone mineral density and fracture of lumbar spine.
| Mean | Max | Mean | SD | |
|---|---|---|---|---|
| Age | 50.00 | 81.00 | 64.04 | 8.80 |
| Disc degeneration score | 0.00 | 19.00 | 7.61 | 4.34 |
| Osteophyte score | 0.00 | 24.00 | 11.17 | 6.16 |
| AP SD∗ | -5.21 | 1.25 | -2.06 | 1.37 |
| AP BMD# | 0.41 | 1.18 | 0.78 | 0.17 |
| Lat SD∗ | -5.29 | 0.86 | -2.60 | 1.34 |
| Lat BMD# | 0.32 | 0.84 | 0.60 | 0.11 |
| Fracture score | 0.00 | 17.00 | 2.07 | 3.70 |
Table 2.
The correlation between each parameters of the age, disc degeneration and bone mineral density.
| Age | Disc degeneration A | Osteophyte& | Lat SD# | Lat BMD| | Fracture$ | ||
|---|---|---|---|---|---|---|---|
| a. Age | r∗ | 0.377 | 0.544 | -0.302 | -0.315 | 0.429 | |
| p | 0.000 | 0.000 | 0.002 | 0.001 | 0.000 | ||
| b. Disc | r | 0.712 | 0.258 | 0.299 | 0.165 | ||
| b. degeneration | p | 0.000 | 0.010 | 0.002 | 0.088 | ||
| c. Osteophyte | r | 0.041 | 0.078 | 0.225 | |||
| p | 0.687 | 0.434 | 0.019 | ||||
| d. Fracture | r | 0.429 | 0.165 | 0.225 | -0.478 | -0.497 | |
| p | 0.000 | 0.088 | 0.000 | 0.000 | 0.000 |
Table 3.
The difference of each parameters between the group with BMD under -2.5 SD and the group with BMD above -2.5 SD.
| Age Mean± SD | Disc degereration^ Mean± SD | Osteophyte& Mean± SD | Lat BMD| Mean± SD | |
|---|---|---|---|---|
| <-2.5 SD$ | 65.86± 8.73 | 6.93± 4.18 | 10.72± 5.67 | 0.53± 7.22E-02 |
| >-2.5 SD | 61.90± 8.77 | 8.71± 4.58 | 12.24± 6.87 | 0.70± 5.68E-02 |
| t-value | 2.233 | 2.022 | -1.205 | -12.544 |
| p-value | 0.028 | 0.046 | 0.231 | 0.000 |
Table 4.
The difference of each parameter between the groups with fracture and without fracture.
| N | Age Mean± SD | Disc d N | degeneration^ Mean± SD | N | Osteophyte& Mean± SD | N | Lat BMD| Mean± SD | |
|---|---|---|---|---|---|---|---|---|
| With fracture | 46 | 67.70± 8.90 | 46 | 7.70± 3.89 | 46 | 12.6± 5.05 | 46 | 0.54± 8.41E-02 |
| Without fracture | 62 | 61.32± 7.73 | 62 | 7.75± 4.67 | 62 | 10.10± 6.71 | 56 | 0.65± 0.10 |
| t-value | 3.972 | 0.174 | 2.129 | -5.447 | ||||
| t-value p-value | 3.972 0.000 | 0.174 0.862 | 2.129 0.036 | -5.447 0.000 |


 PDF
PDF ePub
ePub Citation
 Print
Print


 XML Download