

 PDF
PDF ePub
ePub Citation
 Print
Print


INTRODUCTION
Pulmonary nodules are a common finding detected by computed tomography (CT) of the chest. Multidetector CT (MDCT) has especially increased the detection rate of pulmonary nodules (1, 2). It is important to differentiate between benign and malignant nodules in a practical workup of pulmonary nodule (3). In addition to morphological characteristics, a diagnosis of pulmonary nodules by CT requires an accurate assessment of nodule growth (4, 5). In detecting lung nodule growth and in determining tumor doubling time, three-dimensional (3D) volumetry is known to be more sensitive and reliable than axial diameter measurement (6, 7).
The volume coverage speed of CT affects the temporal and spatial resolution of chest CT imaging. Using early-generation single-slice CT scanner, chest CT image might be associated with deterioration in image quality due to the limited volume coverage speed of CT. Recently introduced dual-source computed tomography (DSCT), as a type of MDCT, is characterized by two 128-slice detectors mounted onto a rotating gantry at an angular offset of 94°. It can provide a faster volume coverage speed in the high-pitch mode (HPM; pitch parameter of 3 or greater). So, a chest DSCT scan in HPM reduces the image acquisition time required for covering the entire chest to less than 1 second (8), and it can help to effectively prevent artifacts from unsuspended respiration or heart pulsations (9).
It has been well known that the 3D volumetry of pulmonary nodules from an MDCT data-set can be affected by the MDCT data acquisition method (10, 11). However, to the best of our knowledge, the influence of HPM in chest DSCT scan on the 3D volumetry for pulmonary nodule has not been studied thoroughly. Therefore, the purpose of our study was to compare the accuracy of 3D volumetry between HPM and conventional pitch mode (CPM; pitch parameter of 1) and to evaluate the variability of 3D volume measurements between HPM and CPM, by using a lung phantom and artificial pulmonary solid nodules of known diameter and volume that were scanned by DSCT in HPM and CPM.
MATERIALS AND METHODS
Chest Phantom and Artificial Solid Nodules
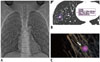
This study used a multipurpose anthropomorphic chest phantom (LUNGMAN; Kyoto Kagaku Co., Ltd., Kyoto, Japan). The chest phantom measures 43 × 40 × 48 cm (width × length × height). Figure 1 shows a picture of the chest phantom. We used 45 spherical solid nodules with a density of 90 Hounsfield units (HU) and diameters of 4 mm, 6 mm, and 8 mm (n = 15 for each diameter). The reference volumes of artificial pulmonary nodule volumes were 33.5 mm3 for the 4-mm nodule, 113.0 mm3 for 6-mm nodule, and 267.9 mm3 for 8-mm nodule. All nodules were attached to the phantom pulmonary vessels using double-sided tape.
The DSCT Protocol
All chest CT examinations were performed by a second-generation 128-slice DSCT system (Somatom Definition Flash; Siemens Healthcare, Forchheim, Germany). Forty-five artificial nodules within the chest phantom were examined using a slice acquisition of 2 × 64 × 0.6 mm, a gantry rotation time of 280 msec, a pitch parameter of 1 or 3, a tube voltage of 120 kV, and an attenuation-based tube current modulation. The DSCT dose sets included the reference tube current-time product of 24 mAs (i.e., low-dose set) or 100 mAs (i.e., high-dose set) per gantry rotation. The chest scans were performed in the craniocaudal direction and covered the apices of the lungs to the pleural recesses. Depending on the pitch parameter, the DSCT pitch modes were classified into 2 types: HPM (pitch parameter of 3) and CPM (pitch parameter of 1). All chest DSCT images were reconstructed with a field of view of 330 mm, an image matrix of 512 × 512 pixels, a slice thickness of 1 mm, and a slice increment of 1 mm, by using a medium sharp convolution kernel (B50) with the lung window settings (width, 1200 HU; center, -600 HU). All reconstructed DSCT images were transferred to external workstations for quantitative assessment.
DSCT Data Analysis
All chest DSCT images were transferred to a dedicated workstation with software for image analysis (LungCARE; Siemens Medical Solutions, Forchheim, Germany). This software contains an algorithm for the automatic assessment of the lung nodule volume. To obtain the 3D volume measurement of pulmonary nodules, the mark of target nodules were performed by 2 readers who each had more than 10 years of experience in the chest CT imaging. The 3D volume of interest around the marked nodule was automatically generated. We did not perform a manual correction. Based on the automatic segmentation of the pulmonary nodule from the DSCT data sets, the 3D volumetry of pulmonary nodule was eventually measured and recorded (Figs. 1, 2).
To evaluate the DSCT image noise, 3 regions of interest (ROIs) were placed in the air surrounding the chest phantom. The ROIs were defined as large as possible. Image noise was defined as the average of the standard deviation (SD) of the attenuation value in the 3 ROIs (12). To evaluate the radiation dose, the effective radiation dose delivered at each DSCT protocol was calculated by applying a method proposed by the European Working Group for Guidelines on Quality Criteria for Computed Tomography, using the dose-length-product (DLP) and the conversion coefficient of 0.017 mSv/(mGy·cm) for the chest. The DLP was obtained from an electronic protocol that summarized the individual radiation exposure parameters of the DSCT scan.
Statistical Analysis
All continuous data were expressed as the mean ± SD. The relative percentage volume error (RPE) was calculated by the following formula (13): RPE = 100 × |Vm - Vr|/ Vr in which Vm represents the 3D volume measurement and Vr represents the reference nodule volume. The intermode volume variability (IVV) between the HPM and CPM was calculated by the following formula: IVV = 200 × |VHPM - VCPM|/ (VHPM + VCPM) in which VHPM represents the 3D volume measurement in HPM, and VCPM represents the 3D volume measurement in CPM. According to the IVV of each pulmonary nodule, every nodule was assigned into two measurements: the comparable measurement (with the IVV of < 25%) and the inaccurate measurement (with the IVV of ≥ 25%) (14). Difference of RPE between the HPM and CPM in each of all pulmonary nodules was assessed by using a paired t test. In addition, the IVVs between the HPM and CPM were compared among the 3 different nodule diameters by analysis of variance with the Tukey's test. Statistical calculations were performed by SPSS software, version 19.0 (IBM, Somers, NY, USA). A p value of less than 0.05 was considered to be statistically significant.
RESULTS
Table 1 summarizes the acquisition time, image noise, and effective radiation dose for chest DSCT protocols. The image acquisition times in CPM and HPM were 4.2 seconds and 0.9 seconds, respectively. In addition, the HPM showed similar radiation dose, compared to the CPM, for each DSCT dose set.
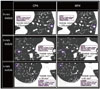
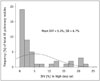
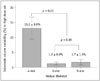
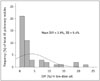
In the high-dose DSCT scan for pulmonary nodules, the paired comparisons of 3D volume measurement and RPE between CPM and HPM are summarized in Tables 2 and 3. Only the 4-mm nodule showed a significant difference in the 3D volume measurement between the CPM and HPM (39.6 ± 1.7 mm3 vs. 45.2 ± 2.4 mm3, p < 0.01). Furthermore, the 4-mm nodule showed a significantly greater RPE in the HPM than in the CPM (35.1 ± 7.4% vs. 18.4 ± 5.3%, p < 0.01). In the 6-mm and 8-mm nodules, however, the 3D volume measurement and RPE showed no significant difference between the HPM and CPM (p > 0.05 for both). In the comparison of a corresponding pulmonary nodule between HPM and CPM (Fig. 2), mean IVV of a total of 45 pulmonary nodules was 5.3 ± 6.7% (Fig. 3). There was no pulmonary nodule assigned into the inaccurate measurement with IVV of ≥ 25%. The mean IVVs for the 4-mm, 6-mm, and 8-mm nodules were 13.1 ± 6.6%, 1.2 ± 0.9%, and 1.7 ± 1.5%, respectively (Fig. 4). The 6-mm and 8-mm nodules showed no significant difference in the IVV (p = 0.94). The mean IVV of the 4-mm nodule was significantly greater than the mean IVV of the 6-mm and 8-mm nodules (p < 0.01).
In the low-dose DSCT scan for pulmonary nodule, the paired comparisons of the 3D volume measurement and the RPE between CPM and HPM are summarized in Tables 4 and 5. Only the 4-mm nodules showed a significant difference in the 3D volume measurement between the CPM and HPM (41.8 ± 2.6 mm3 vs. 45.7 ± 2.5 mm3, respectively; p < 0.01). Furthermore, the 4-mm nodules showed a significantly greater RPE in the HPM than in the CPM (36.5 ± 7.5% vs. 25.0 ± 7.8%, p < 0.01). In the 6-mm and 8-mm nodules, however, the 3D volume measurement and RPE showed no significant difference between the HPM and CPM (p > 0.05 for both). In the comparison of the corresponding pulmonary nodules between the HPM and the CPM (Fig. 5), mean IVV of a total of 45 pulmonary nodules was 3.9 ± 5.4%. There was also no pulmonary nodule assigned into the inaccurate measurement with IVV of ≥ 25%. The mean IVVs for the 4-mm, 6-mm, and 8-mm nodules were 9.2 ± 6.7%, 1.1 ± 1.8%, and 1.5 ± 1.1%, respectively (Fig. 6). The 6-mm and 8-mm nodules showed no significant difference in the IVV (p = 0.97). The mean IVV of the 4-mm nodule was significantly greater than the mean IVV of the 6-mm and 8-mm nodules (p < 0.01).
DISCUSSION
The aim of this study was to demonstrate the influence of the HPM on the 3D volumetry of pulmonary nodules by using DSCT, which provides subsecond image acquisition times to cover the entire chest. In comparing the accuracy of volume measurement between the HPM and CPM, we conducted a phantom experiment to eliminate the adverse effects of respiratory and cardiac motion artifacts which might have confounded in vivo assessment of nodule volume. In addition, we used synthetic lung nodules with known volume to calculate the RPE. From our results using DSCT, there was no remarkable difference in effective radiation dose between the CPM and HPM, in contrast to the image acquisition time. The HPM overestimated the 3D volume measurement of the 4-mm nodule, compared to the CPM. The HPM consequently resulted in a significantly greater RPE, especially for the 4-mm nodule. However, the 6-mm and 8-mm nodules showed no significant difference in the 3D volume measurement and its accuracy between the HPM and CPM. In the assessment of variability for 3D volumetry between the HPM and CPM, although the mean IVV of the 4-mm nodule was significantly greater than the mean IVV of the 6-mm and 8-mm nodules, in no individual nodules did the IVV exceed 25%. In other words, the 3D volumetric assessments in the HPM were comparable to those in the CPM for all solid nodule sizes.
The precision of volumetric measurement is an important prerequisite for using 3D volumetry in CT images for detecting the growth of small pulmonary nodules. Previous studies (13, 15) reported that the volumetry of a small nodule with 5-mm diameter was less accurate compared to the 3D volumetry of larger nodules. Willemink et al. (16) reported that the CT volumetry errors of larger nodules (volume ≥ 65.4 mm3; diameter ≥ 5 mm) were within 25%, even when the tube voltage and tube current-time product were reduced for acquisition of CT data. We also found the low mean RPE (< 15%) in the volumetry of large nodules (6 mm and 8 mm in diameter) and the difficulty in the accurate volume measurement of 4-mm nodules, regardless of the DSCT protocols. The 3D volume measurements of the 6-mm and 8-mm nodules were more reliable and comparable between the HPM and CPM.
In the 3D volumetry by using DSCT, we can consider one assumption to understand the adverse effect of HPM. Although the improvement in scan time by HPM improves visualization of the lung parenchyma, particularly in the basal region with a reduction in the cardiac pulsation artifact, the HPM also may result in higher image noise (9). If a pulmonary nodule is small, accurate segmentation of small nodule may be strongly interrupted by prominent image noise from the HPM. The inaccurate segmentation of a small lung nodule by the image noise can be another important cause of a volumetric error (6, 13). By using DSCT, we evaluated the phantom nodules attached to the pulmonary vessels. The calculated volume of 4-mm nodules may therefore contain pulmonary vessels and lead to overestimation in the HPM. The evaluation of small pulmonary nodule volume by DSCT in HPM must be performed carefully and can require manual correction of the nodule contour determined by the 3D volumetry software.
In practice, the follow-up CT examination for detecting pulmonary nodule growth can be performed by different MDCT scan protocols. Earlier studies (10, 17) reported that various MDCT technical factors (e.g., tube current, reconstruction kernel and slice thickness) can affect the edge detection of pulmonary nodule in the 3D volume measurements from the MDCT dataset. However, Christe et al. (18) showed that nodule measured on low-dose CT was not significantly different from that measured on standard dose CT. In the present study, although we did not perform the direct comparison of 3D volumetry by two different dose set images, the effect of HPM on the 3D volumetry of pulmonary nodule was similar between the high-dose and low-dose sets. This finding showed that an increase of the tube current for DSCT scan cannot be a solution to overcome the adverse effect by HPM on the 3D volumetry of small pulmonary nodule.
An appropriate detection threshold for volume increase is important to determine the propriety for practical purpose. An in vivo study (14) showed that a clinically significant increase in volume can be detected when there is a change in nodule volume of at least 25% between the initial and follow-up CT examinations. If the difference in 3D volumetry is greater than 25% for the same pulmonary nodule between different DSCT scan protocols, the DSCT scan protocols cannot be considered as an alternative for evaluating a pulmonary nodule volume. In our study, no phantom nodule had an IVV of greater than 25%, and the mean IVVs for entire pulmonary nodules in the high-dose and low-dose sets were 5.3 ± 6.7% and 3.9 ± 5.4%. We think that an alternative use of the HPM for the follow-up DSCT evaluations of the pulmonary nodule can be accepted, because the IVV between the HPM and CPM may consequently be less than the size change threshold required in diagnosing significant nodule growth.
We acknowledge some limitations in the present study. First, in 3D volumetry by DSCT, we used particularly homogeneous nodules, which had a sharp margin and a solid spherical appearance. These simulated nodules were attached to vessel structures within the chest phantom. In addition to the DSCT parameters, various nodule features such as margin, attenuation, and deformity would remarkably affect 3D volumetry. To widen the clinical use of DSCT in the HPM, the various pulmonary nodule features will need to be clarified in future studies. Second, we emphasize that the present study was performed in a phantom model, which likely hid the clinical effectiveness of the HPM for nodule 3D volumetry in vivo. However, we believed that the fast speed of chest volume scan by DSCT in the HPM can help overcome the nodular deformation due to heartbeats or breathing, and it can improve the error of 3D volumetry. Third, the influence of heterogeneity in the surrounding lung from emphysema, pneumonia, or infiltrative lung disease was not considered in the present study.
In conclusion, the results in the present study demonstrated an adverse effect by the HPM on the accuracy of 3D volumetry for small pulmonary nodules of less than 5 mm in diameter, compared to the CPM. However, the difference between the HPM and CPM for 3D volumetry of a corresponding pulmonary solid nodule is within an acceptable degree to allow the direct comparison of 3D volume measurement between the two different pitch methods in the early detection of solid pulmonary nodule growth.


 XML Download