

 PDF
PDF ePub
ePub Citation
 Print
Print


INTRODUCTION
Portal hypertension (PH) is the result of increased hepatic vascular resistance and portal blood flow. PH leads to serious complications, such as variceal bleeding, portal hypertensive enteropathy, ascites, spontaneous bacterial peritonitis, hepatorenal syndrome, and hepatic encephalopathy. PH is responsible for significant morbidity and mortality in patients with decompensated cirrhosis (1, 2). For patients with compensated cirrhosis, the diagnosis and grading of clinically significant portal hypertension (CSPH) enable the prediction of prognoses such as the possibility of progression to decompensated cirrhosis and mortality (3).
Thus, the precise grading of PH is essential for appropriate treatment and follow-up of patients with cirrhosis (3, 4). The measurement of the hepatic venous pressure gradient (HVPG) has served as the gold standard for assessing the degree of PH (5). This parameter reflects disease severity and has a strong prognostic value with regard to survival and decompensation in patients with compensated cirrhosis (6). However, the widespread routine clinical use of this method has been limited by the procedure's invasive nature and the requirements for skilled expertise and special equipment (7, 8).
Therefore, many investigators have undertaken efforts to diagnose and grade PH using non-invasive ultrasonography (US) in patients with cirrhosis to replace invasive HVPG measurements (9, 10). US can be used to investigate portal hemodynamics via measurements of the velocity and flow of the portal and splenic veins; the resistance index (RI) and pulsatile index (PI) of the hepatic, splenic, and renal arteries; and the waveform and damping index (DI) of the hepatic vein (HV). However, previous studies on the utility of US for assessing PH have demonstrated conflicting results in patients with cirrhosis, and these studies are regarded as lacking sufficient sensitivity (Se) or specificity (Sp) to replace HVPG in clinical practice (11). In addition, considerable variability has been observed across different investigations, and small sizes of the individual studies have been noted.
Thus, this systematic review aimed to determine the accuracy of US for assessing PH in patients with cirrhosis.
MATERIALS AND METHODS
This study was a systematic review of US versus HVPG for the detection of PH in patients with cirrhosis.
Search Strategy
This study followed the reporting guidelines for systematic reviews suggested by the Preferred Reporting Items for Systematic Reviews and Meta-analyses group and the systematic review handbook of the Cochrane library.
The following databases were primarily used for the literature searches: Ovid MEDLINE (1948 to October 28th, 2013), EMBASE (1947 to October 28th, 2013), and the Cochrane Library (-October 28th, 2013). The patients, index test, comparison test, outcomes search strategy was used to identify studies assessing cirrhosis and PH. US measurements of blood velocity, blood flow, RI, PI, HV waveform, and hepatic vein arrival time (HVAT) were used as an index test. Moreover, HVPG was used as the reference standard test. Diagnostic accuracy, concordance of comparison tests, and correlation served as the main outcomes.
The following main search terms were used: ([liver cirrhosis. mp.] OR [cirrhotic liver. mp.]) AND ([portal hypertension. mp. or exp hypertension, portal] OR [PHT. mp.]) AND ([exp ultrasonography or ultrasonography*. mp.] OR [ultraso*. mp.] OR [sonograph*. mp.] OR [US]) AND ([hepatic venous pressure gradient. mp.] OR [HVPG. mp.]) (Supplement in the online-only Data Supplement).
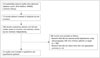
Inclusion/Exclusion Criteria
Studies meeting the following inclusion criteria were included in the systematic review: 1) studies examining PH using US in patients with cirrhosis and 2) studies reporting on more than one appropriate outcome, i.e., the diagnostic accuracy of US for PH based on HVPG. The exclusion criteria included 1) preclinical studies, 2) studies not published in English, 3) gray studies, 4) studies that did not examine PH, and 5) studies that did not report more than one appropriate outcome.
To select appropriate studies for the objective of this research, duplicate studies from each database were excluded using Endnote. Two research authors independently screened all potential studies for inclusion according to the eligibility criteria. If the authors could not reach an agreement by discussion, the opinion of a third author was sought for resolution.
Data Collection and Quality Assessment of Selected Studies
The data used to conduct this systematic review included journal year and language of publication; study design; PH cut-off values; duration of the study; period of follow up; sample size; withdrawal rate; diagnostic method; reference standard; numbers of true positive (Tp), true negative (Tn), false positive (Fp), and false negative (Fn) patients; and other data.
The quality of the selected studies was assessed using 11 Quality Assessment of Diagnostic Accuracy Studies-II (QUADAS-II) items, as recommended by Cochrane. Each item requires a yes, no or unclear answer.
Two review authors independently extracted the data. The results of the reviewers were compared, and differences were resolved through discussion with a third review author.
Data Analysis
We first attempted to use the Cochrane Library RevMan 5.2 (Cochrane Collaboration, Oxford, UK) program to analyze the accuracy values of the clinical diagnoses; however, we were unable to use the program due to the absence of Tp, Tn, Fp, and Fn values in some studies. Additionally, significant heterogeneity among studies and variation in the cut-off values used in each study were noted. Thus, we were unable to perform a meta-analysis. Therefore, we performed a systematic review and descriptive analysis.
RESULTS
We identified 313 studies using our search process. Thirteen duplicate studies from each database were excluded using Endnote. Two authors independently assessed all potential studies for inclusion in our review based on the eligibility criteria. Finally, 14 studies were chosen for analysis. The literature selection process is presented in Figure 1.
General Characteristics of the Studies Included in the Systematic Review
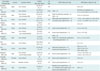
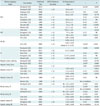
A summary of the characteristics of the 14 studies included in this systematic review is presented in Table 1. Most of these studies were published from 1998 through 2013. Regarding their regional distribution, the studies were performed in the Republic of Korea (n = 5), Italy (n = 4), France (n = 2), Spain (n = 1), Germany (n = 1), and Turkey (n = 1).
The 14 studies included 827 patients with cirrhosis. The average age of the patients was 53.2 ± 9.6 years old. Only two studies (8, 32) included more than 100 patients.
The studies primarily presented the characteristics of the diagnostic performance of US compared with HVPG for assessing PH in patients with cirrhosis. All the US procedures were conducted by trained experts. Contrast-enhanced ultrasonography (CEUS) was only used in one study (8); the remaining 13 studies used Doppler US.
The following US indices were used: portal vein (n = 9), hepatic artery (n = 6), HV (n = 4), renal artery (n = 2), superior mesenteric artery (n = 2), and abdominal porto-systemic collaterals (n = 1).
The average HVPG value for all the patients was 16.4 ± 5.3 mm Hg. Studies used various terms and HVPG thresholds for the target PH to diagnose. Severe PH was used to indicate HVPG > 12 mm Hg (12, 13, 14, 15, 16), ≥ 15 mm Hg (17), or ≥ 16 mm Hg (18, 19). One study defined HVPG ≥ 16 mm Hg as values to predict mortality (20). Two studies defined HVPG ≥ 10 mm Hg as CSPH (8, 21). Three studies (22, 23, 24) did not propose a PH cut off value (Table 1).
Risk of Bias
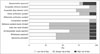
The risk of bias for the 14 selected studies was assessed using the QUADAS-II quality assessment tool for diagnostic studies (Fig. 2). Eleven of 14 studies (78.6%) were appropriate in terms of the range of target patients representing the patient group. Moreover, 13 of 14 studies (93%) used an acceptable reference standard, and 10 of 14 studies (71.4%) had an acceptable delay between tests. Eleven of 14 studies (78.6%) were verified by reference standards, and all 14 studies (100%) were verified by reference standards with no relation to the index test results. In 13 of 14 studies (93%), the reference standard and index test were individually executed. In 5 of 14 studies (35.7%), reference standard results were blinded. This item was uncertain in 8 of 14 studies (57.2%). The index test results were blinded in 10 of 14 studies (71.4%), whereas 6 of 14 studies (42.9%) were reported to have uninterpretable results. Uncertain cases were noted in 7 of 14 studies (50%). Patient withdrawal was noted in 6 of 14 studies (42.0%), and patient withdrawal was uncertain in 7 of 14 studies (50%).
Overall, less than 10% of the studies in each list were evaluated as having a "high" risk of bias. Between 7% and 50% of studies were regarded as "uncertain". Thus, it was difficult to determine whether all selected studies were of high-quality with a low risk of bias.
Relevant Indices of the Portal Vein
Measurable indices of the portal vein for assessing PH include portal vein velocity (PVV), portal vein flow (PVF), and congestion index (CI).
Using HVPG as a reference, the Se and Sp of the portal venous indices were 69-88% and 67-75%, respectively. The correlation coefficient for HVPG and the portal venous indices was 0.296-0.8, and approximately half of the studies reported statistically significant correlations.
Two studies (14, 15) reported the diagnostic accuracy of PVV, indicating a Se and Sp of 69-88% and 67-75%, respectively (Table 2). Nine studies (14, 15, 16, 18, 19, 20, 22, 23, 24) assessed the correlation between HVPG and PVV. PVV ranged from 10.2 to 23.5 cm/s (± 0.2-11.6) in these studies. However, a significant correlation was only detected in 4 studies (|r| = 0.69-0.8, p < 0.05) (Table 3) (14, 15, 16, 23).
Four studies (16, 18, 22, 24) evaluated the correlation between HVPG and PVF. PVF ranged from 325 to 773 mL/min (± 3.5-464), but only one study (16) reported a statistically significant correlation (|r| = 0.58, p < 0.01) (Table 3).
One study reported the diagnostic accuracy of the CI of the portal vein. The CI of the portal vein was calculated as follows: CI = cross-sectional area of the portal vein (cm2) / portal vein mean flow velocity (cm/s) (22). Merkel et al. (19) reported a Se and Sp of 68% and 80%, respectively, and a PPV and NPV of 85% and 57%, respectively (Table 2). Five studies (14, 18, 19, 20, 22) evaluated the correlation between HVPG and CI. The CI ranged from 0.137 to 0.17 cm/s (± 0.02-0.049). Only two studies (14, 22) identified statistically significant correlations (r = 0.296-0.45, p < 0.05) (Table 3).
Relevant Indices of the Hepatic Artery
Measurable indices of the hepatic artery for assessing PH included hepatic artery velocity (HAV), hepatic artery flow (HAF), and RI and PI of the hepatic artery.
No studies reported the Se and Sp of the hepatic arterial indices. A wide range of correlations coefficients between HVPG and the hepatic arterial indices (0.01-0.83) were reported, and approximately half of the reports demonstrated statistically significant correlations.
One study (22) reported a correlation between HVPG and HAV, but this correlation was not statistically significant (r = 0.040, p = 0.769) (Table 3). Two studies (14, 22) reported correlations between HVPG and HAF, but only one study reported a significant correlation (r = 0.83, p < 0.0001) (Table 3).
Three studies (16, 19, 24) reported correlations between HVPG and the RI of the hepatic artery. The RI is calculated as follows: RI = (peak systolic velocity - end diastolic velocity) / peak systolic velocity (15). However, none of these studies found a statistically significant correlation (r = -0.056-0.01, p = NS-0.553) (Table 3).
Two studies (15, 24) reported correlations between HVPG and the PI of the hepatic artery. The PI of the hepatic artery is calculated as follows: PI = (peak systolic velocity - end diastolic velocity) / mean velocity (15). Only one of these studies identified a statistically significant correlation (r = 0.70, p < 0.001) (Table 3).
Relevant Indices of the Hepatic Vein
The normal triphasic HV waveform by US examination is transformed into a biphasic or monophasic waveform in cirrhosis with PH (3, 13, 17). Abnormal HV wave forms were seen in 66 of 76 patients (86.8%) and 72 of 78 patients (92%) (13, 17). Particularly, the monophasic waveform was associated with severe PH (HVPG > 15 mm Hg) with a Se of 74% and a Sp of 95% (17). In addition, statistically significant correlations were observed between HVPG and the abnormality of HV waveform (correlation coefficient, 0.648) (17).
Other quantitative indices of HV were used for PH analysis, including the DI and HVAT.
Two studies (12, 13) reported the diagnostic accuracy of DI. DI was calculated as the minimum velocity/maximum velocity of the downward HV flow (12, 13). These studies reported that the DI values for PH exhibited a Se of 75.9-77.8% and a Sp of 81.8-100.0% (Table 2). DI ratio > 0.6 was significantly more likely to be severe PH (odds ratio: 14.19, 95% confidence interval [CI]: 4.04-49.55) (13).
Kim et al. (8) evaluated HVAT, as assessed by CEUS. The Se, Sp, PPV, NPV, positive likelihood ratio, and negative likelihood ratio for CSPH using a HVAT cut-off value of 14 seconds were 92.7% (95% CI: 80.6-97.5), 86.7% (95% CI: 70.3-94.7), 90.5% (95% CI: 83.7-97.3), 89.7% (95% CI: 82.6-96.7), 6.95 (95% CI: 2.78-17.38), and 0.08 (95% CI: 0.03-0.25), respectively. The area under the reciever operating characteristic curve was 0.973 (95% CI: 0.944-0.997) in the derivation set and was reported to be 0.953 (95% CI: 0.888-0.989) in the validation set (Table 3). The correspondence level indicated a statistically significant negative correlation between HVPG and HVAT (R2 = 0.545; p < 0.001).
DISCUSSION
The objective of this systematic review was to determine the accuracy of US for assessing PH in patients with cirrhosis. This review could help researchers compare, choose, and develop the most appropriate US evaluations for PH in patients with cirrhosis.
Portal hypertension, a frequently presenting clinical syndrome, is defined as a pathological increase in the portal venous pressure between the portal vein and the inferior vena cava that is greater than the normal range (≤ 5 mm Hg) (25). Initially, PH develops as the result of an increase in intrahepatic resistance to portal blood flow due to the profound morphologic changes characterized by fibrosis. Increased portal pressure is the main factor determining the clinical course of decompensated cirrhosis (26).
The currently favored method for determining portal venous pressure involves the catheterization of the HV and HVPG measurements (27). HVPG is one of the best surrogate markers for cirrhosis (28). HVPG measurements provide independent prognostic information on survival and the risk of decompensation. CSPH is necessary for esophageal varix formation, bleeding, and initial decompensation (6, 29). However, although the HVPG measurement procedure is well tolerated, its invasive nature and limited availability have prompted attempts to develop noninvasive alternatives.
There has been great interest in developing and validating non-invasive methods to detect PH among patients with cirrhosis (25). Although non-invasive US appears to be a reliable surrogate for HVPG for identifying PH, the correlation between US and PH remains poorly defined. In this systematic review, we evaluated the clinical utility of non-invasive US for assessing PH in patients with cirrhosis.
This systematic review identified 14 studies that evaluated the diagnostic performance of US for PH in patients with cirrhosis, fulfilled the inclusion criteria, and reported sufficient data.
Numerous studies used the portal vein indices to assess PH. However, these studies did not appear to be sufficiently sensitive for the accurate diagnosis of PH due to conflicting results. In particular, to obtain PVV and PVF, the portal vein is imaged longitudinally in the supine position, and the Doppler sample volume is set at its crossing point with the hepatic artery. The PVV is recorded during suspended expiration and is averaged over a few seconds (3). Variability in PVV measurements includes equipment-related intra- and inter-observer variance (30, 31, 32). Additionally, most cirrhotic patients have porto-systemic shunts arising from PH; the shunt patterns are not unique but vary in complexity in each patient. Portal blood velocity and flow can differ between patients with similar portal pressures due to significant variability in porto-systemic collateral patterns (3). Therefore, portal vein indices exhibit some limitations for replacing HVPG. Resistance in the hepatic, splenic and renal arteries can be evaluated by measuring the RI and PI if the vessel is identified by color Doppler (11, 33). In this review, some studied reported no or weakly significant correlations with PH. The RI and PI offer advantages for measuring vascular resistance regardless of the incidence angle; however, acquiring the same arterial branch by color Doppler in each patient is difficult. Therefore, it is difficult to evaluate the RI and PI under the same conditions in different patients. The accuracy and reproducibility of arterial RI and PI have been questioned (34).
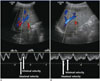
Our review indicates that measurable parameters of the HV indices exhibited moderate accuracy for the detection of PH; however, only a small number of studies were used in this assessment. The HV can be easily visualized along its longitudinal axis by color flow mapping in the supine position (3). The HV wave could be implicated in an increase in HV inflow from intrahepatic shunts, thereby indicating PH. This action result in hemodynamic blunting of the effects of variations in central venous pressure during the cardiac cycle, rather than a lack of liver compliance (3). The DI is calculated by dividing the minimum velocity by the maximum velocity of the HV waveform (Fig. 3). Analysis of the transit time from the HV using CEUS was recently reported to be useful for assessing the severity of liver fibrosis (35). HV indices as assessed by CEUS might serve as a supplementary adjunct to US for the diagnosis of PH and cirrhosis (8, 36). However, HV indices could not be measured in patients exhibiting a poor echo window and atrophic changes of the liver. In addition, potential human errors in measurements are also a factor (8, 37).
The present study had the following potential limitations that require further discussion. First, only 14 studies evaluated the performance of US for PH, thus limiting the robustness of the conclusions that could be reached. The methodological differences and varying diagnostic thresholds among the published investigations indicate that additional studied are required to further establish the precision of this emerging technology. Second, significant heterogeneity of inclusion criteria, HVPG criteria and US indices were also noted. Third, the characteristics of the included studies were not completely consistent, including the patient characteristics, the etiologies of cirrhosis, and the devices used to measure US. Fourth, in our systematic review, we only included English studies, so language bias might have influenced the results. To overcome these discrepancies, it is necessary to conduct a large international study that applies high-quality criteria with regard to study procedures and results reporting.
In conclusion, although the accuracy of US in the detection of PH depends on the skill of the operators and the patients' characteristics, our results of the meta-analysis indicate that US indices, in particular HV indices, can serve as a useful adjunct for clinicians in the management of patients with cirrhosis.

 XML Download