

 PDF
PDF ePub
ePub Citation
 Print
Print


INTRODUCTION
Pulmonary hypertension (PH) is the most serious chronic disorder of the pulmonary circulation and it can cause right heart failure and even death. PH is a syndrome with diverse etiologies and pathogenesis (1). PH is defined as a mean pulmonary arterial pressure (PAP) over 25 mmHg at rest or over 30 mmHg during activity. Right heart catheterization remains the gold standard for making the diagnosis of PH (2). Unfortunately, this is a difficult and invasive procedure to apply to all the patients suspected of having PH. Transthoracic echocardiography (TTE) has been extensively used for non-invasive assessment of the pulmonary vascular resistance due to the accuracy and feasibility (3, 4). Many efforts have been made to establish reliable and reproducible diagnostic imaging methods for assessing the pulmonary artery (PA) pressure. The earlier results with CT have shown that the increase in the main PA diameter is a reliable indicator of PH, and greater than 28.6 mm was 100% specific for PH (5-7). The ratio of the size of PA to the size of the ascending aorta (AA) and size of the segmental PA compared to that of the homologous segmental bronchus have also been investigated (8, 9). However, most studies have identify PA dilatation by measuring partial PA dimensions and the dimensions of the segmental vessels in the axial plane and this does not reflect the features of the pulmonary arterial tree, which are available via image post-processing.
Fractal dimension (FD) analysis is a mathematical technique that provides an excellent explanation of the ruggedness of natural surfaces and many other natural phenomena (10, 11). In the field of medicine, fractal analysis has been applied to pathology, anatomy, medical imaging and etc (12-15). Kido and Sasaki (16) used FD analysis to assess the increased pulmonary blood flow on chest radiograph. In order to differentiate normal from emphysematous regions within one lung, previous research has reported on quantifying the pulmonary emphysema seen on CT imaging by FD analysis (17). Those authors focused on the quantification of the pulmonary parenchyma. For conducting FD analysis of the PA tree, some authors have used postmortem human or animal pulmonary arteries, which were prepared by the silicone elastomer casting technique, for the assessment of morphological properties (18). These studies may have obtained accurate and detailed information about the PA, but only in vitro. In our study and different from the previous studies, FD analysis was applied for quantitatively assessing the morphological properties of the PA tree, as seen on in vivo CT. FD analysis potentially offers a way of investigating and quantifying the morphous of the entire PA as seen on CT. So, in our study we tried to use FD analysis for quantifying the morphological changes of the PA tree due to PH and as seen on multi-detector computed tomography.
MATERIALS AND METHODS
Patients
Thoracic contrasted CT was performed in 31 patients. Seventeen of these 31 patients (M:F = 12:5; age range, 45-76 years; mean age, 64 years) without PH were diagnosed with esophageal carcinoma or lung cancer. Fourteen patients (M:F = 12:2; age range, 38-77 years; mean age, 68 years) were diagnosed with PH. All the patients underwent TTE and they had greater than 30 mmHg of PA systolic pressure for their diagnosis of PH. PH that was caused by chronic pulmonary embolism was excluded due to the incompletely displayed PA tree. All the examinations of the patients with and without PH were performed within two weeks. This study was approved by the Ethics Committee of our University. All the patients gave their written informed consent.
CT and Transthoracic Echocardiography Examination
Spiral CT of the chest was performed using a Somatom Sensation Cardiac 64 scanner (Siemens Medical Solutions, Germany) with the patient in the supine position. We established the CT protocol with the following parameters: tube voltage: 120 kV, effective mAs: 100, collimation: 64 × 0.6 mm, field of view: 450 mm, matrix: 512 × 512, kernel: B31f medium smooth, scan time: 5.56 to 6.34s, rotation time: 0.5s and pitch: 1.4. All the examinations were performed after intravenous injecting 60 mL of iodine contrast medium (Iopromide injection 350, Beilu Pharma, China) with a flow rate of 5 mL/s and this was followed by 40 mL of saline flush with the same flow rate by means of a power injector (Medrad Stellant, USA). The spiral CT protocol was performed with the bolus-tracking technique with a trigger threshold of 100 Hounsfield unit (HU) and a delay time of 3s in order to achieve maximum contrast enhancement within the pulmonary arteries. The position of the region of interest was located at the right atrium for the premonitoring scan.
The images of all the subjects were reconstructed at a 0.75 mm slice thickness, 0.6 mm intervals and a 384 mm reconstruction matrix. The uncompressed CT-images (Digital Imaging and Communications in Medicine, DICOM Format) were transferred to a post-processing workstation (Volume Wizard, Germany) for subsequent pulmonary segmentation.
Transthoracic echocardiography was performed with a Vivid i model (GE Healthcare, Piscataway, NJ). The pulmonary arterial systolic pressure measurements derived from echocardiography were obtained by using standard techniques (19).
Images Post-Processing
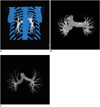
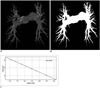
In the post-processing workstation, the images were loaded into Inspace, which is a dedicated post-processing application of the Siemens Medical System. The PA and vein were obtained with selection of the appropriate body part. Bone and the pulmonary veins were cut with a bone removal tool (Fig. 1A). The main pulmonary arteries of all the subjects remained near the bifurcation, and the three dimensional (3D) PA trees from the patients with and without PH were obtained (Fig. 1B, C). In order to get enough information about the PA, the coronal 2D projection of the PA was obtained (Fig. 2A). The anteroposterior and posteroanterior projections were obtained. The FD and projected image area of both images were calculated and averaged for statistical analysis.
Fractal Analysis
The exported 2D views were further processed on a personal computer (Pentium 4; DELL, USA) with software (ImageJ, National Institute of Health, Bethesda, ML). First, the 2D pulmonary digital images of the DICOM format were transformed into 8 bit images (512 × 512 pixels, 768 K) and the pulmonary arteries were automatically segmented from the background with ImageJ software. Second, all of the segmentation images were converted to a binary form for further measurements of the projected image area and the FD (Fig. 2B). The pixel value of the white artery was defined as 1 and the black background was zero.
The FD was calculated using a box-counting method with multiple grid-offsets for all possible box start locations. The following equation was similar to that of the previous reports (12, 20):
NL = KL-D [1]
Where L is the box size, NL is the number of boxes of L size, K is the constant and D is the FD. The value of FD can be estimated by plotting a log-log plot of NL versus L, and Eq. [1] can be rewritten in the form of a line.
Log(NL)= -D·logL + logK [2]
The value of FD can be estimated from the slope of the line (Fig. 2C). The FD estimation procedure was applied according to the following steps: chose the boxes of a size L (the edge length in pixel size) and stack them side by side to encompass the whole 2D fractal object. Then the total number of nonempty boxes (NL) was calculated by completely covering the whole fractal object. Then calculate the total number of nonempty boxes (NL) required to completely cover the whole fractal object. Progressively decrease the size (L) of the boxes and repeat the same counting process. A range of box sizes (L) from 2 to 64 pixels was used to calculate the FD of the PA tree.
The areas of the 2D projected images were expressed in the form of the number of pixels by ImageJ. The areas of the 2D views were calculated according to the following formula.
Projected image area = Npixels × 0.75 × 0.75 mm [3]
Where Npixels is the number of pixels.
Statistical Analysis
Values are presented as means ± standard deviation (SD). Independent-sample tests were performed for comparing the FD, the projected image area and the PAP of the groups with and without PH. A partial correlation analysis was used to evaluate the correlation of FD with the projected image area and the PAP. Pearson's correlation analysis was used to evaluate the correlation of the PAP with the projected image area. For all the tests, a p value < 0.05 was considered to be statistically significant. All the analyses were performed using SPSS 11.5 software.
RESULTS
The estimated FD value of the patients with PH (mean ± SD) was 1.64 ± 0.04 and that for the patients without PH was 1.54 ± 0.04. The projected image area of the patients with PH was 128.6 ± 14.9 cm2 and that for the patients without PH was 77.8 ± 29.9 cm2. The estimated PAP of the patients with PH was 55.9 ± 13.3 mmHg and that for the patients without PH was 20.9 ± 3.2 mmHg. The estimated FD, the projected image area and the PAP in the patients with PH were significantly higher compared with those values of the patients without PH (p < 0.05, Table 1).
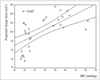
The statistical results indicate a high correlation of the FD with the PAP (r = 0.82, p < 0.05, partial correlation analysis) and a moderate correlation of the FD with the projected image area (r = 0.49, p < 0.05, partial correlation analysis). Moreover, there was a correlation of the PAP with the projected image area (r = 0.65, p < 0.05, Pearson correlation analysis; Fig. 3).
DISCUSSION
Fractal analysis investigates the spatial pattern of an irregular object so that the morphological complexity can be quantified and assigned a numerical value. The FD is an indicator of an object's complexity, which can be calculated on the basis of different metrics, such as the Hausdoff dimension, the box-counting dimension, the capacity dimension and the mass-radius dimension. In our study, the box-counting dimension was used because of its easy implementation and applicability, as described by previous studies (12, 20-22).
Several methods for evaluating the relationships of the PA and PH on CT and MR images have been proposed in the previous studies. The accurate evaluation of the lumen dimension was feasible using volumetric CT (23, 24). Some researchers have suggested that the main PA size in patients with PH was greater than that in normal patients and the correlation between the main PA size and the mean PA pressure was confirmed (5, 25). Studies have also been performed to assess the relationship between the PA volumes on CT and the PA pressures at the right-sided heart catheterization in patients with and without PH, and the results indicated high correlation between the PA volumes and the mean PA pressures (26). MRI perfusion has also been applied to quantitatively assess the effect of PH on pulmonary perfusion and to compare the findings with those of healthy controls (27).
Unlike the methods described previously, our study employed FD analysis to quantify the morphous of an entire PA from CT images. Since the FD is the slope of the log of the number of boxes versus the log of the inverse of the box size, a more massive object that more boxes are required to encompass has a high FD. Maggi and Winterwerp (10) suggested that the projection of a massive structure has a higher FD than a less massive structure. We found that a higher FD indicated a more massive vascular structure. The typical change of the vascular structure in PH patients showed the dilatation of the central pulmonary arteries and pruning of the peripheral blood vessels. CT arteriography can only display the central vessels and main branches rather than the pulmonary capillary bed. Investigators have demonstrated, with using CT, that there was a greater volume of PA in the patients with PH compared with that in the patients without PH (26). Our results showed that the projected image area of a PA in the patients with PH were greater than that in the patients without PH. Boxt et al. (28) found that the mean FD of the pulmonary arteries in rat lungs with PH was lower than that of the normal controls, which appeared to be at odds at our results. In fact, there was not a contradiction between the two studies. The morphological change seen on the contact radiographs of the barium-filled PA of a rat with PH mainly reflected the pruning of the peripheral pulmonary capillaries. The central vessels did not have obvious dilatation because the PH models of rats were produced for only 28 days. Boxt thought the smaller FD resulted from the lesser number of branches (i.e., less image area of the vessels) filling the space that it occupied. However, the main change of the pulmonary arteries in patients with PH and as seen on CT was the dilation of central vessels and their main branches, which resulted in the increase of the projected image area of the vessels. So, the larger FD of the PA as seen on CT, the larger projected image area of the PA fills the space. Meanwhile, we found moderate correlation of the projected image area with the FD (r = 0.49). These results were consistent with the research of Maggi and Winterwerp (10), which may explain the differences between the two studies.
In our study we found that the correlation of the FD with the PAP (r = 0.82) was better than the correlation of the FD with the projected image area (r = 0.49) and the correlation of the PAP with the projected image area (r = 0.65), which means the effects of the PAP on the FD were greater than those of projected image area on the FD. There are several possible reasons for this result. First, the PA dilatation caused by PH is only one of the morphological changes. A study on the pulmonary arterial tree morphometry in rats with hypoxia-induced PH reported that the total length of the vessels, the total number of branches off the main trunk and the angle of the branches were different from the normal controls (29). The projected image areas only express the dilation of the PAs. Second, FD can investigate the spatial pattern and morphological complexity of images. Fernandez and Jelinek (30) emphasized the usefulness of FD analysis for image description and for categorizing morphologically complex objects. Wu et al. (21) thought area analysis for assessing cerebellar atrophy may not be sensitive enough to resolve the tiny spots of atrophy and the complex changes of brain structures. Third, the projected image area was obtained from the coronal anteroposterior and posteroanterior projections of a PA. The projected image area may not completely reflect the dilatation of a PA. Therefore, FD is more advantageous to assess the morphological changes of the whole PA tree compared with that of the projected image area. FD may be quite useful as an indicator for investigating and quantifying the morphous of the entire PA in the near future. The branching systems in our body, such as the pulmonary vascular system, are characterized by a fractal nature: there is self-similarity in the bifurcation pattern. Self-similarity obeys a set of scaling laws that are based on the hypothesis that the cost of construction of the tree structure and operation of fluid conduction are minimized (31). FD can be used to quantitatively assess the morphological character of pulmonary arteries with self-similarity. Meanwhile it has been proved there is a relationship between the morphological and functional properties of the pulmonary arteries (13), which means the functional change can result in a change of the morphological structure. The FD of the PA is about 2.71 with the measurement of the artery done on casts from postmortem human lungs, and this much higher than our value from CT in our study (18). The possible reasons were that CT angiography could not display the peripheral small blood vessels, which leads to the FD from CT being lower than that from anatomy. Nevertheless, CT can provide the possibility of measuring the morphological character in the PA tree in vivo. So, further investigation is needed to demonstrate that FD can be used to provide a potential indicator to quantify the character of PH.
The limitations of this study include the associated radiation exposure and the need to administer iodinated contrast material, which is not required for right-sided heart catheter measurements or TTE. The peripheral pulmonary veins make the post-processing procedure complicated. The results of FD measurements in the pulmonary arteries are affected by some diseases that show a loss of the pulmonary vasculature, such as thromboembolic PH. Additionally, successful application of FD measurement in the pulmonary arteries is dependent on the quality of the images of CT angiography, so multi-detector CT-technology with ECG gating will be a nice alternative due to the accuracy of the PA phase. 3D FD analysis and volume reconstruction of medical images have both been performed. Thus, it is necessary for us to employ 3D FD analysis for assessing 3D images of the pulmonary arteries in the near future. The group with PH was composed of moderate or severe PH patients and it lacked the mild PH patients. Therefore, our results should be confirmed using a larger range of patients with PH.
In conclusion, this study employed FD analysis to investigate the morphological changes of pulmonary arteries in patients with and without PH. The results demonstrated that the FD, the PAP and the projected image areas of the pulmonary arteries in PH patients were significantly higher compared with those in the patients without PH. There was a high correlation of FD with PAP and a moderate correlation of FD with the projected image area of the pulmonary arteries. Moreover, there was a correlation of the PAP with the projected image area.

 XML Download