

 PDF
PDF ePub
ePub Citation
 Print
Print


Glaucomatous optic nerve damage appears not only as the morphological change of the optic disc but also as the reduction of the thickness of the retinal nerve fiber layer (RNFL), and the defect of the optic nerve axon causes the RNFL thinning that has been known to be developed earlier than the morphological change of the optic disc and the change of the vision.1,2,3 In addition, Zeimer et al4 have reported that glaucomatous field defect is closely associated with thinning of the macula, and in 34% of early glaucoma patients, it caused a clear thinning of the posterior retina. In glaucoma patients, such alteration of the thickness of the retina nervous fiber and of the macula may appear prior to vision defects caused by optic nerve defects, and thus the assessment of such alteration has recently become of help in the early diagnosis of glaucoma.
The optical coherence tomography OCT 3000 (OCT, Zeiss, Germany) is an instrument that uses ultrared radiation with a resolution of approximately 10 µm to measure the difference of the time of light reflection from different depths of tissue by optical interferometer. Although it is slightly influenced by refractive power, it measures objectively, without contact, and non-invasively RNFL and macular thicknesses, as well as various parameters of the optic nerve disc. The advantages of this OCT instrument, in comparison with the test results obtained by conventional ophthalmoscopy, are 3-dimensional imaging of the optic nerve disc and the retinal optic nerve layer, etc., by minimizing the subjective determination of examiners and quantitating the result values. This allows accurate diagnosis, assessment of progression, and prognosis.
We used OCT to measure various parameters of the optic disc of glaucomatous eyes, and the thickness of RNFL and the macula in normal eyes and ocular hypertension (OHT) eyes. We performed comparative analysis of their correlation to assess the clinical usefulness of the data obtained by OCT.
MATERIALS AND METHODS
This study was performed in the Department of Ophthalmology, Inje University Busan Paik Hospital, Busan, Korea, from January to August, 2003, on 60 eyes of 60 normal individuals who gave informed consent and applied for the study, 35 eyes of 35 OHT cases who were under follow up observation at our glaucoma clinics, and 54 eyes of 38 glaucoma cases.
The definition of normal eye was the absence of any other eye diseases, the corrected vision of over 1.0 by Hahn's visual acuity chart, the spherical equivalent on refraction of within±5.0 diopters, the result of gonioscopy of an open angle, ocular tension measured for a minimum of 2 times of lower than 21 mmHg, the cup-disc ratio in ophthalmography and 3-dimensional optical disc imaging of less than 0.6 or the difference of the vertical cup-disc ratio of less than 0.2, normal result from the glaucoma Hemifield test by Humphrey's automated perimetry performed more than 2 times, and the corrected pattern standard deviation (CPSD) of within 95% of normal range. OHT was defined as ocular tension measurement for more than a minimum of 2 times of over 21 mmHg, the absence of any change to the glaucomatous optic disc, and the absence of any glaucomatous defect by Humphrey's automated perimetry. The glaucoma group was defined as an open angle result in gonioscopy, ocular tension measurement of more than 2 times of over 21 mmHg, the cup-disc ratio in ophthalmography and on 3-dimensional optical disc imaging of over 0.6 or the cup-disc ratio of both eyes of over 0.2, local or general loss or notching of the optical nerve disc ring, hemorrhage, glaucoma Hemifield test by Humphrey's automated perimetry of beyond 99% of normal range more than 2 times, or the CPSD beyond 95% of normal range. Exclusion criteria were unstable gaze during OCT test, vertical diameter of the optic nerve disc of less than 1 mm or over 3 mm, and normal ocular pressure glaucoma cases.
OCT test fixes the macula and thus suppresses eye movements by blinking at an aimed beam. The internal fixation method that fixes the testing eye was used to measure the parameters of the optical nerve disc by focusing on the optic nerve disc. At 30 degrees intervals, 6 radiation doses of 4 mm in diameter were applied, and the Optic Nerve Head (ONH) analysis system was used to measure the disc diameter, cup diameter, disc area, cup area, nerve rim area, and cup/disc area ratio. To measure the RNFL thickness, circular radiation doses of 3.4 mm in diameter were applied focused on the optic nerve disc. Using RNFL thickness average analysis system, the results were divided into 12 fractions at 30-degree intervals. The values of superior, inferior, nasal, and temporal RNFL thicknesses and their averages were used as parameters. Finally, to measure the thickness of the macula, 6-mm thick radiation doses were focused on the macula and the results were measured by dividing into 9 areas containing 3 circles each by using the Retinal map analysis system. Each circle was formed by a 1-mm diameter central circle, an inner ring of 3 mm diameter, and an outer ring of 6 mm diameter. The thickness of the macula was measured by dividing the inner ring and the outer ring into 4 areas: the superior, inferior, nasal, and temporal quadrants.
To compare the three groups, normal, OHT and glaucoma, SAS 8.1 statistical program was used and ANOVA test was performed. To obtain significant parameters of each group, t-test was used. In the parameter analysis, a p value less than 0.05 was considered as statistically significant.
RESULTS
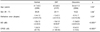
The normal group comprised 60 cases (60 eyes), 35 male and 25 female, and their average age was 41.7±6.5 (22-56) years. The OHT group comprised 35 cases (53 eyes), 22 male and 13 female, and their mean age was 45.5±8.5 (21-57) years. The glaucoma group comprised 38 cases (54 eyes), 16 male and 22 female, and the mean age was 54.4±11.8 (22-64) years. In regard to gender and refractive index, a significant difference between the three groups was not detected. However, in regard to their age, a significant difference among the three groups was detected. In Humphrey automated perimetry, there was a statistically significant difference in mean deviation (MD) and CPSD (Table 1).
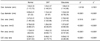
The disc diameter of the normal group measured by OCT was 1.94±0.30 mm, the cup diameter was 0.65±0.41 mm, the disc area was 2.47±0.41 mm2, the cup area was 0.76±0.60 mm2, the nerve rim area was 1.72±0.51 mm2, and the cup/disc area ratio was 0.29±0.21. In the comparison between the normal and OHT groups, a significant difference was detected in all the parameters of the optic nerve disc except the diameter of the optic nerve disc and the disc area. Similarly in the comparison between the OHT and glaucoma groups, a significant difference was detected except the diameter of the optic nerve disc and the disc area (Table 2).
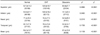
In regard to the RNFL thickness in the normal group, the average and the upper, lower, nasal, and temporal quadrant thicknesses were 104.3±10.7 µm, 127.0±14.2 µm, 134.6±21.7 µm, 71.4±16.3, and 83.7±17.9 µm, respectively. The lower quadrant was the thickest, followed in order by the upper, nasal and temporal quadrants. In the OHT group, the respective thicknesses were 101.4±8.6 µm, 125.9±10.7 µm, 126.9±19.2 µm, 74.4±17.3 µm, and 78.2±15.9 µm. In comparison with normal eyes, the lower quadrant RNFL was thinned significantly. However, a significant difference was not detected in the other quadrants. In the glaucoma group, the respective thicknesses were 67.4±15.9 µm, 85.8±27.7 µm, 74.1±22.2 µm, 54.5±20.2, and 55.0±14.7 µm. In comparison with OHT, a significant reduction was detected in all areas, and the thinning was particularly more significant in the upper and lower quadrants (Table 3). In addition, the nasal quadrant showed a slight reduction among neurofiber layers with increasing age (r=0.267, P<0.05).
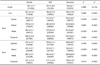
The macular thickness in the normal group was 162.1±17.1 µm in the center area and 201.1±14.6 µm in the 1 mm area. In the 3 mm area, the upper, lower, nasal and temporal quadrants were 283.9±12.47 µm, 279.2±12.0 µm, 283.3±12.1 µm, and 268.5±10.9 µm. In the 6 mm area, the respective thicknesses were 245.4±13.7 µm, 233.7±12.1 µm, 264.7±12.7 µm, and 225.1±12.4 µm. In the 3 mm area, the upper quadrant was the thickest followed in order by the nasal, lower and temporal quadrants. In the 6 mm area, the nasal quadrant was the thickest followed in order by the upper, lower and nasal quadrants. The macular thickness in the OHT group was 156.7±18.9 µm in the center fraction and 190.2±17.8 µm in the 1mm area. In the 3 mm fraction, the respective thickness were 272.3±14.1 µm, 268.3±15.8 µm, 270.0±15.3 µm, and 259.2±15.8 µm. In the 6 mm fraction, the respective thicknesses were 238.3±11.4 µm, 223.5±11.1 µm, 254.4±12.7 µm, and 219.1±13.6 µm.
The macular thickness in the glaucoma group was 164.0±22.1 µm in the center fraction and 188.7±19.5 µm in the 1 mm fraction. In the 3 mm fraction, the respective thickness were 240.4±28.2 µm, 242.6±29.8 µm, 247.5±28.1 µm, and 230.3±28.4 µm. In the 6 mm fraction, respective thickness were 206.6±26.7 µm, 198.4±21.1 µm, 226.7±29.8 µm, and 196.5±18.6 µm. In the comparison of the OHT and normal groups, the macula was thinned significantly in all areas except the center area. Similarly, in the comparison of the glaucoma and OHT groups, a significant reduction was detected in all areas except the center area (Table 4).
DISCUSSION
Glaucoma is a disease of the optical nerve that shows specific, progressive and irreversible damage in the optic nerve and the retinal nerve fiber,6 and thus the prevention of glaucomatous optic nerve damage has become an important issue. In the past, ocular tension measurement, visual field examination, and optic nerve test have been performed for the early diagnosis of glaucoma and the examination of its progression. The value of intraocular pressure in the diagnosis of glaucoma is decreasing gradually because of its diurnal variation and the difference of the sensitivity of the optic nerve to ocular tension.7 In addition, visual field examination has a similar problem because visual field defects appear after substantial progression of the defect of optic nerve axon, and this examination is therefore of limited value for the early diagnosis of glaucoma.8 In addition, Quigley et al3 have reported that in glaucomatous optic nerve damage, the RNFL damage due to the damage of the retinal ganglion cells could be an important marker of optic function defects and that such thinning of retinal nerve fiber preceded the defect of the optic nerve disc.8,9,10
Because of the difficulty of measuring the RNFL thickness, RNFL photography were used,11,12 and subsequently, the outcome and convenience of RNFL photography were improved. However, its shortcomings are that pupillary dilation must be induced during the test, the analyzed value is subjective, and its reproducibility as well as quantitation quality are low.13 Subsequently, Scanning Laser Polarimetry (Nerve Fiber Analyzer: NFA) was developed with the ability to measure quantitatively by applying the birefringent polarization property of RNFL.
The advantages of NFA are that it does not require pupillary dilation or the reference plane; however, its shortcomings are peripapillary atrophy showing the sclera, and in chorioretinal scar, retardation appears abnormally large.14 In addition, OCT was developed in the early 90s, and was able to quantitate RNFL thickness measurement with its high resolution of between approximately 10 µm and 17 µm. Its resolution has been known to be superior to the recently developed tomographic scan in other fields.15,16 OCT is an instrument that examines the intraocular structure similarly to B-scan by using a laser beam. It is different from the other methods described above since it generates a single layer image of the retina and thus the RNFL thickness can be measured directly. Furthermore, it does not require a reference plane, is not influenced by the refraction condition and axial length, and is not affected by the degree of nuclear sclerosis of glaucoma or similar ocular media opacification.15,16
According to our study, a significant difference was detected in the comparison of the parameters of the optic nerve disc between the normal and OHT groups, except the diameter of the optic nerve disc and the disc area. In the comparison between the OHT and glaucoma groups, similarly, a significant difference was detected except the diameter of the optic nerve disc and the disc area. In other studies,17,18 a difference between normal and OHT groups was detected, and these study results imply that in OHT, the risk of glaucomatous optic neuropathy or RNFL damage could be significantly increased. In addition, Zangwill et al19 have reported that in OHT, measurement of the parameters of the optic nerve disc by confocal scanning laser ophthalmoscopy showed that the value was between normal and glaucoma, and that, particularly, a significant difference was detected in the optic nerve disc area, the nerve rim area, and the mean contour height. Furthermore, Jonas and Konigsreuther20 have reported that the optic nerve disc in OHT was bigger than normal, and that it showed an abnormally shaped nerve rim on optic nerve photographs, reduced RNFL sensitivity, and local RNFL damage. However, Iester et al21 have reported that in measurement of the parameters of Heidelberg Retinal Tomograph (HRT), no difference between normal and OHT was detected.
In their analysis of the correlation of age and RNFL thickness, Schuman et al22 and Yi et al23 have reported that the thickness of the temporal nerve fiber layer decreased with increasing age. According to the study reported by Bowd et al24 that measured the RNFL thickness by OCT, a significant reduction was detected in all four quadrants in OHT cases compared with normal eyes, and RNFL was thinned by an average 15%. Similarly, although the test method was different, Schwartz and Takamoto have reported an approximate RNFL thinning of 18% as measured by stereophtogrammetry.25 Anton et al17 have reported an approximate RNFL thinning of 7% in OHT cases compared with normal eyes as assessed by scanning laser polarimetry.
Particularly, according to the report by Bowd et al,24 the RNFL inferior quadrant in OHT was significantly thinner than normal, and that it is associated with the damage to the ocular nerve initiated in the inferior pole,26 and consequently, that the visual field defect in glaucoma appeared first in the upper pole area.25,26 In our study, similarly to the report by Bowd et al24 a significant difference of the inferior quadrant between normal and OHT was detected. However, a significant difference was not detected in the other quadrants, possibly because of the difference of the sensitivity of measuring equipments, the size of the study population, and the subjects. In addition, according to the report by Quigley et al,2 preceding RNFL defects were detected in 57% of OHT patients during the process of developing visual field defect, and the preceding RNFL defect was detected in 35% of OHT patients even if it is not in the process of developing visual field defects. Hence, it may be speculated that OHT is the initial condition preceding visual field defects of optical nerve damage.
The nerve fiber layer consists primarily of axons of retinal ganglion cells, neuroglial cells, and astrocytes. The ganglion cell layer consists of 4~6 cell layers in the macula, and one further cell layer outside the macula. In the vicinity of the optic nerves, the RNFL forms the greatest thickness of the retina; however, in the macula, together with the RNFL, ganglion cells constitute 30-35% of the macular thickness.
Glaucoma is a lesion in the optic nerve, and the ultimate defect may be limited to the level of retinal ganglion cells. Glaucoma induces defects of retinal ganglion cells and axons, resulting in RNFL thinning,29,30 and consequently, macula thinning also.30 According to the report by Guedes et al,32 that used OCT to measure the macular thickness in normal cases, initial glaucoma cases, and advanced glaucoma cases, a statistically significant difference among the three groups was detected. In our study, using OCT to measure the macular thickness in the OHT group compared with the normal group, all areas of the macula were significantly thinned except the center area, which suggests that the assessment of the macula thickness may be clinically valuable for the diagnosis of glaucoma. However, in the cases of diseases that affect the macula directly, for example diabetes or macular degeneration, it may camouflage or exaggerate the findings observed in glaucoma, and thus analysis of the results requires careful attention.
According to our results, assessment of the parameters of the optic nerve disc by OCT to determine the RNFL and macular thicknesses may be useful for the diagnosis of glaucoma patients and for the assessment of its progression in the future.
 XML Download