

 PDF
PDF ePub
ePub Citation
 Print
Print


INTRODUCTION
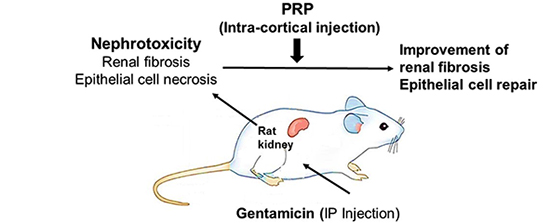
Platelet-rich plasma (PRP), an autologous derivative of whole blood, has grown as an attractive biologic instrument in regenerative medicine. PRP contains considerable quantities of growth factors (GFs), such as hepatocyte growth factor (HGF), insulin-like growth factor-1 (IGF-1), adenosine diphosphate (ADP), adenosine tri-phosphate (ATP) and epidermal growth factor (EGF) liberated from α-granules and dense-granules of platelets (1). These GFs play a key role in angiogenesis and tissue regeneration by controlling cell migration, differentiation, proliferation and physiological functions (234). There are reports about positive effects of PRP on chronic epicondylitis and injuries of rotator cuff tendon (56). Administration of exogenous EGF enhances renal tubule cell regeneration and repair and accelerates the recovery of renal function (7). Some studies demonstrated that HGF promotes renal tubular cell regeneration and leads to the repair of kidney structure and function after damage (8). Therefore, PRP as a natural cocktail of GFs may enhance regeneration and functional recovery in kidney injuries. Gentamicin (GM) is used for induction of nephrotoxicity in animal model. GM-induced nephrotoxicity is characterized by elevation of blood urea nitrogen (BUN) and creatinine (Cr) in serum, and correlated with induction of oxidative stress, tubular necrosis, interstitial fibrosis and increase of monocyte/macrophages infiltration (9). Therefore, the aim of this study was to evaluate the effect of PRP on improvement of nephrotoxicity in rat model by stereological study and functional recovery by assessment of BUN and Cr.
MATERIALS AND METHODS
Experimental animals
Thirty-two Sprague-Dawley male rats (weighing 230–330 g) were provided from Shiraz University of Medical Sciences (SUMS). Rats were kept under standard environments (12:12 hour’s light/dark cycles, temperature 22°C–23°C, and relative humidity ~60%) and free access to food and tap water. Rats were acclimatized for 7 days.
Experimental design
Thirty-two rats were randomly divided into four groups. Group I: as control group without any treatment. Group II: as GM group received GM (Alborz Darou, Qazvin, Iran) (80 mg/kg/day, intraperitoneally [IP], 8 consecutive days) (10). Group III: as GM+PRP group received GM, and 24 hours later, 100 μL PRP was injected into the right kidney cortex under surgery microscope. Group IV: as GM+normal saline (NS) group received GM, and 24 hours later, 100 μL NS was injected into the right kidney cortex under surgery microscope. At the end of induction by GM and 3 days after PRP therapy, blood samples were collected via cardiac puncture to determine levels of BUN and Cr in serum. Three days after PRP injection, the right kidneys were removed for tissue processing and stereological studies.
Preparation of platelet-rich plasma
The PRP was obtained from 5 age-matched healthy male Sprague-Dawley rats. The whole blood of rats was drawn through cardiac puncture and transferred into test tubes including 3.2% sodium citrate (Merck, Darmstadt, Germany) at a blood/citrate ratio of 9/1. The blood was centrifuged (5810 R; Eppendorf AG, Hamburg, Germany) at 400 × g for 10 minutes and supernatant was transferred to another tube, centrifuged again at 800 × g for 10 minutes. The top 2/3, which consisted of platelet-poor plasma (PPP) was removed. The remaining layer (1/3) was considered as PRP (11). PRP was allocated and frozen at −20°C for use.
Platelet count
To evaluate platelet count, the Sysmex XT-1600i system (Sysmex, Kobe, Japan) was used. The average whole blood platelet count was 603 × 103 platelets/μL, while the average PRP platelet count was 2,380 × 103 platelets/μL.
Surgical procedure
For the surgical procedure, the animals were anaesthetized by halothane inhalation and were placed in the left lateral recumbent position. The kidney was exposed by a subcostal lumbar incision, and 100 μL PRP was injected in four point from dorsal border of kidney cortex, using a needle equipped with spacer, under surgery microscope (ZEIS, Jena, Germany).
Biochemical analysis
To assess the serum levels of BUN, expressed in mg/dL, standard kits (Mancompany, Tehran, Iran) and Cr, expressed in mg/dL, standard kits (Parsazmun, Karaj, Iran) and an Automated Chemical Analyzer (24i; Prestige, Tokyo, Japan) were used. The assessment protocols were performed based on the manufacturer’s instructions.
Tissue preparation and processing for stereological analysis of kidney
The right kidneys were dissected, cleaned entirely and weighed. The primary volume “Vprimary” was measured using the immersion method (12). Concisely, a small container with NS was located on the digital scale and weighed, then the kidney was suspended in the container by a thin filament and weighed. The weight of the container, kidney, and NS in grams, minus the weight of the container and normal saline divided by the specific gravity of NS (~1) was primary volume of the kidney in cubic centimeters. Because tissue deformation mostly in the form of shrinkage is produced during fixation/processing/embedding/sectioning/staining of the tissue, which will affect the stereological parameters, the shrinkage needs to be calculated. Estimation of shrinkage needs Isotropic Uniform Random (IUR) cutting of kidney. The orientator method was used to obtain IUR slabs (13). In brief, the right kidney was placed on a circle equally divided using radial lines (ϕ clock). A number was randomly selected between zero and nine and the kidney was sectioned into two segments along the line bearing the selected number. Each segment of kidney was placed on the 0–0 direction of the circle with unequal cosines-weighted divisions (ϴ clock) and another random number selected. The segments were sectioned into slabs along the line bearing the selected number. Eight to ten slabs were gathered from each right kidney after applying orientator method. A circular piece was punched from a randomly sampled slab by a trocar for estimating the shrinkage. All slabs and circle piece were fixed in 10% neutral buffered formaldehyde for one week. After tissue processing, the slabs and circular piece were embedded in a paraffin block. Sections of 5-μm (for estimation of volume and length) and 25-μm (for estimation of number) in thickness were cut by microtome and stained by Masson Trichrome and H & E. In short, sections of paraffin blocks were deparaffinized by Xylene (5 minutes for each Xylene I, II, and III) and hydrated through graded alcohols (Ethanol 100% [2 minutes], Ethanol 96% [2 minutes], Ethanol 96% [2 minutes], Ethanol 80% [2 minutes], Ethanol 70% [2 minutes]), then were washed in tap water. For H & E staining, sections were stained in hematoxylin (5 minutes) and were differentiated in acid alcohol 1% (HCl 1% in ethanol 70%) for 5–10 seconds. After rinsing in tap water (5 minutes), counterstained in eosine 1% (10 minutes). For Masson Trichrome technique, the nuclei were stained by Celestine blue-hematoxylin method and differentiated with acid alcohol 1%. After washing in tap water, stained in acid fuchsin solution (5 minutes), rinsed in distilled water, treated with phosphomolybdic acid solution for 5 minutes and stained with methylene blue for 3 minutes. At the end, sections were dehydrated through alcohols, cleared in Xylene and mounted in permanent mounting medium (14).
Analyzing equipment
Microscopic analyses were done using a workspace made with a microscope (E-200; Nikon, Tokyo, Japan) equipped with a video camera (CCD, Hyper HAD; Sony, Tokyo, Japan), a computer and a flat monitor (Platrun; LG, Seoul, Korea), an electronic microcator (MT-12; Heidenhain, Traunreut, Germany) to control the movements in Z-axis. The entire system was controlled by stereology software designated at our laboratory (StereoLite; SUMS, Shiraz, Iran).
Estimating the shrinkage and the final volume of kidney
The area of the circular piece was estimated before and after fixation/processing/embedding/sectioning/staining. Shrinkage was estimated as (13):
Estimation of volume of connective tissue, cortex and medulla
The total volume of connective tissue, cortex and medulla were estimated on the 5 µm sections stained by Masson Trichrome and H & E. The slides were studied using a video-microscopy system.
The slides were moved at equal intervals along the X- and Y-axis using a stage micrometer to choose fields of each slide by systematic, uniform random sampling. The images of each selected field was viewed on the monitor.
To estimate the volume of connective tissue, cortex and medulla, the volume density of each structure should be estimated. The volume density “Vv(structure/kidney)” was estimated using point counting method (15). A stereological software (StereoLite) was used to superimpose a grid of points on the live images of the microscope.
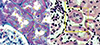
The points hitting the profiles of cortex, medulla and connective tissue were counted by a serologist (Fig. 1A).
Fig. 1
(A) A grid of points on the images for estimation of the volume density of the interstitial connective tissue stained by Masson Trichrome. (B) The length density of the cortical convoluted tubules is estimated by an unbiased counting frame on the images stained by H & E.
Estimation of cortical convoluted tubule length
The length density of the convoluted tubules was estimated by overlaying an unbiased counting frame with exclusion lines (the left and lower borders and their extentions) and inclusion lines (the right and upper borders) randomly on the live images of the kidney sections. the profiles of the tubules which are either completely or partly inside the counting frame and do not touch the exclusion lines are counted (Fig. 1B) and the length density (LV) of tubules was calculated as (13):
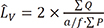
Where “∑Q” was the total number of the tubule profiles sampled by the frame, (a/f) was the area of the counting frame at the final magnification and “∑P” was the total number of frame-associated points (P) hitting the reference space. The total length of the tubules “L” was calculated as (Fig. 1B):
Estimation of volume-weighted mean renal corpuscle and glomerulus volume ( )
)
The ‘point-sampled intercept (PSI)’ method was used for measuring the mean volume-weighted glomerulus and renal corpuscle volume (), from IUR sections. The length of a line, l0, passing through the sampling point that lies within the glomerulus or renal corpuscle to the borders of it (i.e. parietal and visceral layer of Bowman’s capsule) was measured, and the following formula was used for estimation of volume-weighted mean glomerulus and renal corpuscle volume () (13):
), from IUR sections. The length of a line, l0, passing through the sampling point that lies within the glomerulus or renal corpuscle to the borders of it (i.e. parietal and visceral layer of Bowman’s capsule) was measured, and the following formula was used for estimation of volume-weighted mean glomerulus and renal corpuscle volume () (13):

Where  is the average of the cubed linear intercept length across the glomerulus or renal corpuscle through the sampling point.
is the average of the cubed linear intercept length across the glomerulus or renal corpuscle through the sampling point.Estimation of total number of epithelial cells in convoluted tubules
The numerical density,  , of proximal and distal convoluted tubule cells was estimated using the optical disector principle. An unbiased counting frame was used to estimate the numerical density of the nuclei. The nuclei of tubule cells located within the frame not touching the exclusion lines and in the defined 18 µm of depth were counted in each field. Nuclei were sampled in 10–14 fields. Numerical density of convoluted tubules was estimated as (13):
, of proximal and distal convoluted tubule cells was estimated using the optical disector principle. An unbiased counting frame was used to estimate the numerical density of the nuclei. The nuclei of tubule cells located within the frame not touching the exclusion lines and in the defined 18 µm of depth were counted in each field. Nuclei were sampled in 10–14 fields. Numerical density of convoluted tubules was estimated as (13):
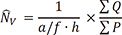
Where “∑Q” was the total number of nuclei counted in the disector height in all microscopic fields, “∑P” was the sum of frame-associated points hitting reference space, a/f was the area of the unbiased counting frame at the end magnification, and “h” was the height of disector (18 µm here). The total number of cells was obtained using the following formula:
Statistical analysis
Statistical analysis was performed using SPSS 20 (SPSS; IBM, Armonk, NY, USA). All data were expressed as mean ± standard deviation (SD). Differences between two groups were compared with independent student’s t-test. Groups were compared with one way analysis of variance (ANOVA) and Duncan’s multiple range test (DMRT). P value less than 0.05 was considered as significant.
RESULTS
Histopathological findings
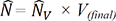
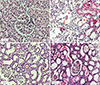
Histpathological examination of the kidney sections from animals in control group showed normal structural features (Figs. 2A, 3A, and 3E). Kidney sections of animals which recieved GM, revealed tissue inflammation, increment of connective tissue, deposition of debris in tubular lumen, and cell necrosis in covoluted tubules (Figs. 2B, 3B, and 3F). PRP reduced lymphcyte infilteration and ameliorated tissue fibrosis ; most proximal tubules were lined by low basophilic regenerating epithelium and debris was cleared in most proximal tubules (Figs. 2C, 3C, and 3G), compared to NS (Figs. 2D, 3D, and 3H).
Fig. 2
H & E staining of rat kidney sections at (A) control group; (B) GM group: dilatation (◄), cellular debris (*), inflammation (↓); (C) GM+PRP group: debris clearing (*) and regenerating tubular epithelium (◄); (D) GM+NS group: necrosis with cellular debris (*).
GM = gentamicin, PRP = platelet-rich plasma, NS = normal saline.
Stereological findings
Estimation of number of renal convoluted tubule epithelial cells
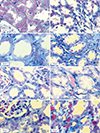
GM reduced the number of the epithelial cells in convoluted tubules compared to control group (35%) (P = 0.006). There was a significant increase (105%) in the number of the epithelial cells in convoluted tubules in PRP-treated group compared to GM+NS group (P = 0.001) (Fig. 4A).
Fig. 4
Effect of platelet-rich plasma on the number of convoluted tubule epithelial cells (A), kidney cortex volume (B), connective tissue volume (C), mean volume-weighted glomerulus volume (D), and mean volume-weighted renal corpuscle volume (E) in GM-induced rats.
GM = gentamicin, PRP = platelet-rich plasma, NS = normal saline.
Estimation of volume of kidney, renal cortex, medulla and connective tissue
There was no significant change in volume of kidney in GM-treated group compared to control group (P = 0.15) and there was no significant change in volume of kidney in PRP-treated group compared to GM+NS group (P = 0.19). Volume of cortex reduced (27%) in GM-treated group compared to control group (P = 0.01). There was a significant increase (25%) in volume of the cortex in PRP-treated group compared to GM+NS group (P = 0.009) (Fig. 4B).
Volume of medulla increased (89%) in GM-treated group compared to control group (P = 0.001). But, there was no significant change of volume of medulla in PRP-treated group compared to GM+NS group (P = 0.35). The data showed that volume of the connective tissue increased (93%) in GM-treated group compared to control group (P = 0.001). There was a significant decrease (25%) in volume of the connective tissue in PRP-treated group compared to GM+NS group (P = 0.02) (Fig. 4C).
Estimation of length of proximal convoluted tubules
There was no significant change of length of proximal convoluted tubules (PCT) in GM-treated groups as compared with control group (P = 0.06) and there was no significant change in length of PCT in PRP-treated group compared to GM+NS Group (P = 0.3).
Estimation of volume-weighted mean renal corpuscle and glomerulus volume ()
Our findings revealed volume-weighted mean renal glomerulus volume () diminished (28%) in GM-treated group compared with control group (P = 0.01). There was a significant decrease (26%) in volume-weighted mean renal glomerulus volume in PRP-treated group as compared with GM+NS group (P = 0.03) (Fig. 4D).
) diminished (28%) in GM-treated group compared with control group (P = 0.01). There was a significant decrease (26%) in volume-weighted mean renal glomerulus volume in PRP-treated group as compared with GM+NS group (P = 0.03) (Fig. 4D).The data also showed that volume-weighted mean renal corpuscle volume () decreased (24%) in GM-treated group compared with control group (P = 0.01). There was a significant decrease (30%) in volume-weighted mean renal corpuscle volume in PRP-treated group as compared with GM+NS group (P = 0.04) (Fig. 4E).
) decreased (24%) in GM-treated group compared with control group (P = 0.01). There was a significant decrease (30%) in volume-weighted mean renal corpuscle volume in PRP-treated group as compared with GM+NS group (P = 0.04) (Fig. 4E).Effects of PRP on kidney function tests in GM-induced nephrotoxicity
In this study, serum levels of BUN and Cr were significantly increased in GM-induced groups compared to control group (P = 0.002, P = 0.03 for BUN and Cr, respectively). But there was no significant difference of BUN and Cr between GM, GM+PRP, and GM+NS (Table 1).
Table 1
Values of serum levels of BUN and Cr before and after PRP therapy in control, GM, GM+PRP and GM+NS groups

DISCUSSION
In the present study, administration of GM to animals caused a significant increase in serum levels of BUN and Cr (9), and damage of renal structures. GM produces reactive oxygen species (ROS) and reactive nitrogen species (RNS), that lead to malfunction and destruction of kidney (16). Stereological evaluations in this study showed reduction of the number of epithelial cells in cortical convoluted tubules and cortex volume following GM administration. Researches show that GM produces superoxide anions and hydroxyl radicals that accumulate in the epithelial cells of the cortical tubules and induce cell death (1617). Quiros et al. (2011) reported that GM mainly influences proximal tubules and doesn’t change distal tubules considerably (18). Probably one reason of reduction in volume of cortex is enhancement of cell death in proximal tubules. With regard to these results, our expectation was reduction of length of proximal tubules; however we observed that GM didn’t change length of PCT. Histological examination in this study demonstrated inflammatory occurrence in the cortex. The studies show inflammatory occurrence is one of the characteristics of nephrotoxicity (9). We suggest; inflammatory occurrence compensates shortening of proximal tubules. This study revealed that GM increased medulla volume (80%). GM doesn’t influence renal medullary tubules noticeably (19). According to our findings, administration of GM increased the volume of connective tissue and induced fibrosis. GM increases levels of transforming growth factor beta (TGF-β) that causes renal fibrosis (20), through production of collagen-rich matrix and starting myofibroblast activation and epithelial-myofibroblast transdifferentiation. Therefore, it seems GM increases the volume of medulla through the increment of connective tissue. In this study, GM decreased volume-weighted mean renal corpuscle (24%) and glomerulus (26%) volume. Investigations show that GM induces glomerular atrophy. GM may alter the glomerular filtration rate by constriction of intra-glomerular mesangial cells which found inside the glomerulus. Other studies revealed that free radicals induce podocyte loss in nephropathy model (2122). It seems, one reason for glomerular atrophy is reduction of the number of podcytes and another reason is constriction of intra-glomerular mesangial cells; however, more examination is necessary for this hypothesis. In the present study, PRP accelerated regeneration through increasing of the number of epithelial cells of cortical renal tubules in GM+PRP-treated group compared to GM+NS group. Hom et al. (23) observed that PRP stimulate epithelialization rate in skin wounds. Epithelial cell regeneration may be attributed to the biological effects of GFs of platelets. Epithelial growth factor leads to cell proliferation of epithelial cells (7). IGF-1 activates tubular cell regeneration in acute renal failure (24). HGF is a survival factor for tubular epithelial cells by stimulating proliferation of epithelial cell and preventing apoptosis (8). Increase of cortex volume in PRP-treated animals may be due to proliferation of tubular epithelial cells. But, PRP didn’t change the length of PCT. Histological examination of this report showed that PRP reduced inflammatory cells. It seems that cell proliferation and anti-inflammatory properties of PRP are two opposite reasons cause no change in the length of proximal tubules. Biochemical analysis also showed no changes between PRP-treated and GM+NS group. In the present study, function tests were done 3 days PRP therapy. Maturation of regenerated epithelial cells in convoluted tubules lasts one month (25). Consequently, one month is necessary to observe function of newly regenerated epithelial cells. We also revealed that PRP ameliorated GM-induced fibrosis. HGF possesses a potent anti-fibrotic ability in kidney through working in opposition to the activities of TGF-β1, preventing activation of interstitial fibroblasts (26), and suppressing tubular epithelial-to-mesenchymal transition (27). Yang et al. (26) showed that administration of HGF ameliorated renal fibrosis. According to our data, there was no significant change in volume of medulla in PRP-treated group compared to GM+NS Group (P = 0.35). It seems, minor damage or microsurgery, like acupuncture event, probably by stimulating the release of growth hormones may help to tissue repair. However, further investigation is necessary to verify this idea. Our study showed a significant decrease in volume of renal corpuscles and glomeruli after PRP therapy. There are large quantities of ADP and ATP, in dense granules of platelets that degrade into adenosine. Adenosine at high concentrations causes afferent arteriolar constriction at the arrival to the glomerulus and decreases renal blood flow (28). It seems, PRP reduces the volume of glomeruli through vasoconstriction, but other possibilities such as reduction of the number of podocytes may be involved in this process that should be considered. Therefore we found that a single dose and topical usage of PRP in cortical area of damaged kidney enhanced regeneration of epithelial cells in convoluted tubules and improved inflammation and tubulointerstitial fibrosis. According to our founding, we believe that novel and promising technique of platelet therapy could use as a therapeutic plan for regeneration after nephrotoxicity. Biologic effects of PRP may be better, depends on the dose, application frequency and administration technique of PRP that should be verified with additional studies.
 XML Download