

 PDF
PDF ePub
ePub Citation
 Print
Print


INTRODUCTION
The increasing prevalence of obesity is a major public health problem worldwide. Obesity is associated with diabetes mellitus and cardiovascular diseases (CVD) such as ischemic heart disease and stroke, as well as major risk factors for metabolic disorders (1). The most popular index of obesity is the body mass index (BMI) or waist circumference (WC), and most epidemiologic studies on obesity have also used BMI or WC for the measurement of body fatness. However, there are conflicting data as to whether the general obesity assessed by BMI or the central obesity assessed by WC is more closely associated with cardiovascular risk (2).
Previous studies have reported that both BMI and WC values can identify cardiovascular risk equally effectively (3, 4). On the other hand, some studies have demonstrated that the WC is a superior marker for predicting cardiovascular risk than BMI (5-7). In addition, several studies have shown that even among people with normal BMI, wide ranges were observed for adiposity or metabolic variables. The issue remained whether this variability was associated with cardiovascular risk factors (8-10). BMI and WC could indicate different health risks of patients in clinical practice. However, little is known about the independent effects of BMI and WC, and the results remain controversial (2, 11). The findings of a high WC in some individuals with normal BMI or a high BMI in others with normal WC have been frequently encountered. When clinicians meet such patients, there is some difficulty in assessing the cardiovascular risk according to the obesity phenotype.
The present study was conducted to evaluate the obesity phenotype presented by BMI and WC and to assess their association with coronary heart diseases (CHD) risk among various CVD outcomes as estimated by the Framingham risk score in Korean adults.
MATERIALS AND METHODS
Study subjects
The present study is based on data acquired in the fourth Korea National Health and Nutrition Examination Survey (KNHANES IV-2) conducted in 2008. The KNHANES has been conducted periodically since 1998 to assess the health and nutritional status of the non-institutionalized civilian population of Korea. The KNHANES IV was a cross-sectional and nationally representative survey conducted by the Korea Centers for Disease Control and Prevention from 2007 to 2009. The sampling frame was based on the population census survey conducted by the Statistics Korea in 2005. A stratified, multistage probability sampling design was used for the selection of household units. In the KNHANES IV-2, there were 264,186 primary sampling units by proportional allocation, each of which contained about 60 households. Two hundred sampling frames from primary sampling units were randomly sampled and 23 households from each sampling frame were sampled using a systemic sampling method. Finally, 12,528 individuals in 4,600 households were sampled and 9,744 of them participated in the surveys (overall participation rate 77.8%). Of the 5,711 subjects aged 30 to 74 yr, participants with previous diagnoses of stroke, ischemic heart disease, or chronic renal failure (n = 255) and current treatment for cirrhotic liver disease or any cancer (n = 68), as well as women who were pregnant (n = 25), were excluded. Individuals with low BMI (< 18.5 kg/m2) and incomplete data on anthropometric measurements or test results were also excluded (n = 790). A total of 4,573 subjects were included in the final statistical analysis.
Study measurements
The survey consists of a health interview survey and a health examination survey. The survey collected data via face-to-face interviews inside the households and by direct standardized physical examinations conducted in specially equipped mobile examination centers. The sequence of the health survey administration involved intake, receipt of informed consent, blood pressure (BP) measurement, anthropometric measurement, blood sampling, and completion of the questionnaire. A standardized questionnaire regarding age, gender, socioeconomic characteristics, medical history, current drug use, smoking habit, alcohol consumption, and other lifestyle risk factors was prepared. Monthly income was defined as the individual's share of the total household income per month. Household equivalent income was calculated by summing up the monthly income of all household members and later dividing this sum by the square root of the household size. The participants were classified as current smokers if they smoked currently and nonsmokers if they had never smoked or had smoked previously but had quit. Likewise, alcohol consumption was categorized as those who ingested alcohol ≥ 1 time or < 1 time per month according to public health index. Physical activity, as assessed by the international physical activity questionnaire (IPAQ) (12), was classified into quartiles.
BP was measured 3 times with 5-min intervals using a standard mercury sphygmomanometer (Baumanometer®, WA Baum Co. Inc., Copiague, NY, USA). The average of the second and third measurements was used as the final BP. Anthropometric data, including height, body weight, and WC, were measured according to standardized guidelines. Height was measured in the erect position in centimeters with the head and hip touching the wall by mobile anthropometer (SECA 225®, SECA Deutchland, Hamburg, Germany). Body weight was measured in kilograms by mobile scale (GL-6000-20®, CASKOREA, Seoul, Korea) while the patient was dressed in a light gown without shoes. Using a fiberglass tape measure (SECA 200®, SECA Deutchland), WC was measured in tenths of a centimeter without compression of the soft tissue along the middle horizontal line between the inferior margin of the last rib and the iliac crest. The feet were 25-30 cm apart in a stable standing position for this measurement. BMI was calculated by dividing the body weight by the height squared (kg/m2). Fasting plasma glucose (FPG), total cholesterol (T-C), triglyceride (TG), and high density lipoprotein cholesterol (HDL-C) were measured after a fasting period of at least 8 hr by using the autoanalyzer (ADVIA 1650®, Bayer, Tarrytown, NY, USA).
The obesity phenotype was classified by BMI and WC: with BMI, ≥ 18.5 and < 25.0 kg/m2 was normal and ≥ 25.0 kg/m2 was obese and with WC, < 90 cm in men or < 80 cm in women was normal and ≥ 90 cm in men or ≥ 80 cm in women was obese. Subsequently, the data were categorized into 4 groups such as normal BMI/normal WC (group A), normal BMI/obese WC (group B), obese BMI/normal WC (group C), and obese BMI/obese WC (group D).
To determine individuals' 10-yr risk of CHD, we used the Framingham risk model. With the Framingham algorithm as outlined by Wilson et al. (13), a global risk score was calculated based on categorical values of age, gender, T-C, HDL-C, BP, smoking, and diabetes. Diabetes was defined as a FPG level of ≥ 126 mg/dL or currently being treated with insulin or oral hypoglycemic agents.
Statistical analysis
Statistical analyses were performed using SPSS version 18.0 (SPSS Inc., Chicago, IL, USA) software packages. All estimates were calculated based on sample weights, which were evaluated by taking into consideration the sampling rate, response rate, and age and gender proportions of the reference population. The analysis was adjusted for the complex sample design of the survey. Continuous data were presented as means and standard errors (SE), and categorical data as frequencies and SE or 95% confidence intervals (CIs), as appropriate. Comparisons across obesity phenotype groups were made using the Student's t-test for continuous data and the chi-squared test for categorical data. The distribution of the Framingham risk score (low < 6%, moderate 6%- < 10%, moderately high 10%- < 20% and high ≥ 20%) by obesity phenotype groups was also presented. Multiple logistic regression analyses were used to analyze relations between moderately high or high 10-yr CHD risk and obesity phenotype groups. All analyses except Table 1 were divided by gender. All tests were two-sided and P values of < 0.05 were considered statistically significant.
RESULTS
The means of age, BMI, and WC of the subjects were 49.1 yr (SE 0.3 yr), 24.1 kg/m2 (SE 0.1 kg/m2), and 82.8 cm (SE 0.2 cm), respectively, and 57.2% (n = 2,615) of the sample was female. The number of subjects with obese BMI was 1,572 (34.7%) and the number of subjects with obese WC was 1,890 (37.3%). The number of subjects in obesity phenotype groups according to BMI and WC were 2,361 (54.0%, group A), 640 (11.3%, group B), 322 (8.7%, group C), and 1,250 (26.0%, group D), respectively.
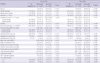
The descriptive characteristics of the study population are contained within Table 1. Subjects with obese WC were older (P < 0.001) and had higher frequencies of being female and having a lower education level (< 12 yr) than normal WC subjects in both BMI groups. Subjects with normal WC were more likely to be smokers and more frequently reported alcohol consumption than the obese WC group regardless of BMI category. The frequencies of current treatment for hypertension, diabetes, and dyslipidemia were higher in subjects with obese WC than with normal WC in both BMI categories. For individuals with normal BMI, the mean levels of BP, FPG, T-C, TG, and 10-yr CHD risk score were higher and that of HDL-C were lower in subjects with obese WC than those in the normal WC group. For individuals with obese BMI, subjects with obese WC had higher systolic BP, FPG, T-C, and 10-yr CHD risk scores than those in the normal WC group, although there were no differences in diastolic BP, TG, HDL-C between both WC categories.
The frequency of the components used in the Framingham risk model for each of the obesity phenotype groups by gender are presented in Table 2. In this study population, categorical values of age (≥ 40 yr in men or ≥ 45 yr in women), T-C (≥ 200 mg/dL), HDL-C (< 45 mg/dL in men or < 50 mg/dL in women), BP (≥ 130/85 mmHg in men or ≥ 140/90 mmHg in women), smoking, and diabetes were found in 63.8% (n = 3,018), 35.8% (n = 1,670), 55.5% (n = 2,589), 20.9% (n = 919), 26.6% (n = 1,014), and 8.1% (n = 404), respectively. For men and women, the prevalence of high T-C, low HDL-C, and high BP was lowest in group A (normal BMI/normal WC) and highest in group D (obese BMI/obese WC). Subjects with ages of ≥ 40 yr in men or ≥ 45 yr in women were higher in the obese WC groups than were those in normal WC groups. The prevalence of diabetes was higher in the obese WC groups than in normal WC groups regardless of gender. Group A (normal BMI/normal WC) in men and group B (normal BMI/obese WC) in women had high frequencies of smokers compared to other groups; however, there were no significant differences between the obesity phenotype groups.
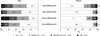
Fig. 1. shows the distribution of Framingham risk across obesity phenotype groups by gender. The means of 10-yr CHD risk were 9.37% (SE 0.27%) in men and 4.48% (SE 0.15%) in women, and there were no significant differences only between group A (normal BMI/normal WC) and group C (obese BMI/normal WC) in men and women (not shown in the figure). Men and women in group A (normal BMI/normal WC) had the lowest risk for CHD with 50.2% and 89.2% in the < 6% risk category, respectively. Men in group B (normal BMI/obese WC) had the highest risk over the next 10 yr (21.3% with ≥ 20% CHD risk), whereas women in group D (obese BMI/obese WC) had the highest risk (5.0% with ≥ 20% 10-yr CHD risk). Subjects with obese WC had a lower proportion of low risk and a higher proportion of high risk for CHD compared to the normal WC group, regardless of BMI category. In both men and women, the proportions with high CHD risk status increased more than six-fold from the lowest group to the highest group (3.1%-21.3%, in group C vs group B and 0.7%-5.0%, in group A vs group D, respectively, each P < 0.001 across obesity phenotype groups).
The adjusted odds ratios (ORs) for the ≥ 10% or ≥ 20% 10-yr CHD risk were calculated by multiple logistic regression analysis (Table 3). Education level, equivalent income, alcohol consumption, physical activity, antihypertensive drug use, and antidyslipidemic drug use for the 4 obesity phenotype groups as classified by BMI and WC were included as independent variables in this model. Relative to those in group A (normal BMI/normal WC), significantly higher ORs of ≥ 10% or ≥ 20% 10-yr CHD risk were observed for subjects in group B (normal BMI/obese WC) or group D (obese BMI/obese WC). The adjusted ORs of male subjects in group B (normal BMI/obese WC) were higher than those in group D (obese BMI/obese WC), whereas the adjusted ORs of female subjects in group D (obese BMI/obese WC) were higher than in the other obesity phenotype groups. The adjusted ORs of the subjects in group C (obese BMI/normal WC) for the ≥ 10% or ≥ 20% 10-yr CHD risk were not significantly higher compared to those in group A (normal BMI/normal WC).
DISCUSSION
The purpose of this study was to evaluate the independent association of obesity phenotypes represented by BMI and WC with CHD risk as estimated by the Framingham risk model. BMI and WC have been widely used as diagnostic indexes of obesity in clinical practice. Some have a normal BMI but an obese WC, whereas others have an obese BMI but a normal WC. It is controversial whether individuals whose BMI and WC are conflicting are associated with cardiovascular risk. In this study involving hypothesis testing, the null hypothesis was that the obesity phenotype groups presented by BMI and WC are similarly predictive of CHD risk, while the alternative was that there are heterogeneities among the obesity phenotype groups, particularly in normal BMI/obese WC or obese BMI/normal WC group.
The percentage of central obesity assessed by WC was 37.3%, which was higher than the percentage of obesity based on BMI (34.7%). In this study, the prevalence of central obesity in women was obviously higher than that in men. Subjects with central obesity were older and had a higher frequency of being females than the normal WC group, regardless of general obesity assessed by BMI. It is well known that when comparing subjects who have similar BMIs, older persons would have more body fat than do younger persons and that women have more body fat than do men (14, 15). Hauner et al. (16) has also reported that the prevalence of obesity increased notably with age while women had an increased WC more often than men.
In our study, the obese WC in both men and women was associated with CHD risk without reference to the level of BMI. The superiority between BMI and WC in estimating cardiovascular risk has been controversial among some previous reports. Satoh et al. (3) reported that both BMI and WC could equally effectively predict the presence of multiple cardiovascular risk factors in a Japanese population. Lear et al. (17) suggested that the distribution of body fat in Asians differed from that of Caucasians and that BMI might be superior in assessing visceral obesity in Asians than in Caucasians. On the other hand, WC is considered to be a better predictor of cardiovascular risk than BMI (18-20). WC is related with abdominal fat, which is a strong indicator of cardiovascular risk independent of total body fat (21, 22). BMI is associated with body fat content but has several limitations in estimating obesity for some individuals. Some muscular men without excess body fat could be overestimated as obese, whereas some elderly or women with decreased lean body mass could be underestimated as normal (23, 24). Findings of many studies are consistent in that WC is a better predictor of obesity-related diseases in the elderly than in younger individuals and also in women than in men (25-27). The predictability of anthropometric indexes on obesity-related diseases could be a function of age- and gender-related differences in body fat distribution.
In addition, we found that there was a small but significant proportion of the Korean population whose BMI and WC presented conflicting information. One-fifth of the subjects were categorized into the conflicting obesity groups (group B or C). The proportion of female subjects with normal BMI and obese WC was higher than that with obese BMI and normal WC, while the reverse trend was true for men. Subjects with only central obesity but normal BMI (group B) were significantly associated with increased CHD risk, whereas those with only obese BMI without central obesity (group C) were not associated with CHD risk. Two previous reports have clearly shown that patients with a high WC and low BMI are at high risk of cardiovascular death. Zeller et al. (28) demonstrated that neither BMI nor WC independently predicted death after acute myocardial infarction and that the group of patients with high WC but low BMI had an increased 1-yr death rate. In a large European cohort study, the positive association between abdominal fat distribution and the high risk of mortality over 9.7 yr tended to be stronger among participants with a lower BMI than among those with a higher BMI (29). Interestingly, CHD risk in men with only central obesity but normal BMI (group B) was higher than that of subjects with obese BMI and obese WC. Our study showed that males in group B (normal BMI/obese WC) had the highest frequency of the age component (≥ 40 yr) and diabetes prevalence among the subjects in the 4 obesity phenotype groups.
One of the possible reasons for the sex difference may be the effect of estrogen on the cardiovascular risk factors (i.e., the protective effects of estrogen on plasma lipids may be stronger than the variability in adiposity). Another possible reason is the sex difference in the biology of lower body fat. It has been shown that thigh fat is associated with higher plasma HDL-cholesterol levels and a lower incidence of diabetes only in females. Most women have a gynoid profile of fat deposition with more adiposity in the lower body segment. However, the present study examined the association between the presence of risk factors and total adiposity but not body fat distribution. Variations in abdominal fat may explain the fact there was almost no difference across adiposity quintiles among females with normal weight, as Ruderman et al. (30) suggested.
The present study has limitations. First, imperfections of the cross-sectional design include the fact that the survey was accomplished on a single visit, which cannot account for inherent variability in some laboratory tests and measurements. Further, the cardiovascular risk estimated by the Framingham risk score is not the actual CHD event. Second, only two obesity indexes were evaluated in this study. Therefore, the associations with cardiovascular risk and other anthropometric measurements such as waist-hip ratio or waist-to-height ratio, or more objective surrogates of body fat distribution, cannot be discussed. Finally, the Framingham risk model used to determine individuals' global risk of experiencing a future cardiovascular event may be overestimated in Koreans with significantly different genetic profiles or social and environmental backgrounds. In this study, however, the distribution of the Framingham risk score was used as a stratification tool of CHD risk, and not in calculating the absolute risk scores of CHD. Despite these limitations, our study has an advantage in measuring the obesity phenotype via a simple and inexpensive manner to predict CHD risk in a relatively large number of subjects. The survey was recently performed in a nationwide, population-based, and representative sample of Koreans, and all analyses in this study were completely based on sample weights and adjusted for the complex sample design of the survey. Thus, these results can be generalized for the entire Korean adult population.
In conclusion, central obesity assessed by WC was related to increased CHD risk regardless of the level of BMI in Korean adults. The CHD risk in subjects with only obese BMI without central obesity, on the other hand, was not significantly higher. In addition, men with only central obesity but normal BMI tended to be associated with moderately higher or higher risk of CHD than those with obese BMI and obese WC. The results of this study suggest that the obesity phenotype related with both general obesity and central obesity should be considered in estimating CHD risk by anthropometric measures of obesity. Considering obesity phenotype by gender differences may also result in an improved approach for the assessment of obesity-related cardiovascular risk.


 XML Download