

 PDF
PDF ePub
ePub Citation
 Print
Print


INTRODUCTION
The rapid introduction of desflurane produces sympathetic stimulation and associated changes, which are represented by increases in blood pressure, heart rate and pupil diameter (1-3). The cerebrovascular response to a rapid increase in desflurane was also reported and considered to be either a coincident or independent change from hemodynamic stimulation (4, 5). There are few reports on the cerebral oximetric response to the introduction of desflurane.
Hoffman et al. (6) observed an increase in the cerebral tissue PO2 during desflurane anesthesia, and suggested the increased PO2 to be indicative of the improved cerebral oxygenation status. The cerebral oximetry (rSO2) values can be compared with the focal cerebral tissue PO2. Moreover, the increase in rSO2 can be regarded not only as an improvement in the cerebral oxygenation status but also as a resultant hyperemia. It was hypothesized that rSO2 would also respond to the rapid introduction of desflurane.
Carbon dioxide plays an important role in regulating the cerebral blood flow. Hence, hypocapnia would be favorable in desflurane-induced hyperemic changes to the brain. The addition of N2O, which is commonly used in everyday practice of anesthesia, decreases the minimun alveolar concentration (MAC) of desflurane and would attenuate the response of rSO2 by increasing the depth of anesthesia if the change in rSO2 is dependent on systemic sympathetic stimulation. This study examined the inherent cerebrovascular effects of N2O. It is expected that this study will help to improve the understanding of the cerebrovascular changes during desflurane anesthesia.
Accordingly, in order to demonstrate that hypocapnia or the addition of N2O can modify the response of rSO2, the concentration (dose)-response relationship for the change in rSO2 during the rapid introduction of desflurane was examined using a nonlinear mixed-effects model in a grouped repeated design.
MATERIALS AND METHODS
After obtaining institutional research board approval (2008-1-26) and written informed consent, 12 American Society of Anesthesiologist (ASA) physical status class 1-2 adults who underwent a variety of surgical procedures requiring general anesthesia were enrolled in this study. The exclusion criteria included subjects with alleged respiratory, cardiovascular, and cerebral diseases, or were taking associated medications. No premedicament was given. The subjects were allocated randomly to an Air (n=6) or N2O group (n=6).
In addition to the standard monitoring equipment, the emitter-sensor couplet of a cerebral oximeter (INVOS 5100B, Somanetics®, Troy, OH, U.S.A.) was attached to the right brow, and a sensor from a Finometer (Finapres Medical Systems, Amsterdam, The Netherlands) was attached to the appropriate finger to obtain the continuous arterial pressure, heart rate, and cardiac output. The concentrations of CO2, N2O and desflurane were measured using the airway module embedded in an anesthesia machine (S/5 Avance, Datex-Ohmeda, Helsinki, Finland). Anesthetic induction and maintenance were achieved as described by our institution's standard anesthetic guidelines. Briefly, vecuronium (0.08-0.1 mg/ kg), remifentanil (computer-estimated effect-site concentration, Ce=3.0 ng/mL) were administered intravenously as required after confirming the loss of consciousness with a titrated dose of intravenous propofol (1.5-2.0 mg/kg). Remifentanil was administered using a target-controlled infusion device (Orchestra® Base Primea, Fresenius-Kabi, Bad Homburg, Germany). Desflurane (6.0% dial-concentration) were inhaled. After the trachea was intubated, the infusion of remifentanil was stopped and the dial-concentration of desflurane was adjusted to 4.0%. In the Air group, medical air was added to the oxygen to ensure an inspired oxygen fraction of 0.4. N2O was added in the N2O group. Mechanical ventilation was started with VT=8 mL/kg and RR=10 breath/min while permitting an inter-subjects difference in the end-tidal concentration of CO2 (PETCO2). The corresponding PETCO2 was 33±4 (ranged 24-41) mmHg throughout the study period. The SpO2 values were approximately 98-100% during the course of the study.
After stabilization for approximately 20 min until the Ce of remifentanil fell to below 0.3, the average end-tidal (PETDESF) and inspired (PFIDESF) desflurane reached 4.0%, and the dial-concentration of desflurane was increased to 12.0%, simultaneously with 6 L/min of a fresh gas flow rate and the PETDESF converged within 90% of the PFIDESF. This time was set to time 0 (T0).
Measurements and calculations
The basic preanesthetic measurements included the body weight, height, rSO2, mean arterial pressure (MAP), heart rate (HR), cardiac output (CO), body surface area (BSA), and derived cardiac index (CI). Consecutive measurements, including the rSO2, SpO2, MAP, HR, CI, PETDESF, PFIDESF, and PETCO2 were recorded at T0 and the following periods; 0.5, 1.0, 1.5, 2.0, 2.5, 3.0, 3.5, 4.0, 5.0, 8.0, and 10 min from T0. The measurement was stopped when the MAP>120 mmHg or <50 mmHg, and the HR>130 beats/min or <45 beats/min. However, the measurements before stopping were also included in the analysis. Two subjects, one in the Air group and one in the N2O group, showed hypotension (MAP<50 mmHg), which was treated promptly with intravenous ephedrine 5 mg. The ΔrSO2 was defined as the difference between the rSO2 at a given time from rSO2 at T0. The estimated alveolar concentration of desflurane (PET/FIDESF) was defined and calculated as the PETDESF divided by the final PFIDESF.
Reliability of the rSO2 measurements
By examining the variance components using a random intercept and slope model, the reliability of the two rSO2 measurements was tested before and after the induction of anesthesia. The value of rSO2 was predicted from hemoglobin with a combination of the anesthesia-effect and subject-effect as random effects. The intra-class correlation (ρ) was defined and estimated,

where τ is the between-subjects variance and σ is the within-subjects variance. The variance of the between-subjects random effects was composed of the variance of each random effect, in this case, τ2=τintercept2+τslope2. Interpretation of ρ was descriptive. A high ρ(>0.90) suggests that the between-subjects component was dominant in the total variances, which also indicated a good reliability of the repeated measurement within-subjects.
Hemodynamic variables
The temporal changes in the MAP, HR, and CI were analyzed by an analysis of the covariance (ANCOVA). The ANCOVA model was fitted as a function of time, and N2O was used as a grouping variable. When the N2O-effect was significant, 12 pairwise comparisons were made at each time period using the adjusted P according to the Dunn-Sidak procedures (P'=1-[1-P]12).
Modeling for temporal changes in PET/FIDESF
The temporal change in the PET/FIDESF was modeled using an exponential function of time as follows:
Predicted PET/FIDESF=f(time)=Asym+(y0-Asym)×e-elrc×time
where Asym is the asymptote as time approaches infinity, and y0 is PET/FIDESF at T0. The parameter, lrc, is the logarithm of the rate constant, ensuring a positive rate constant. The time to half (t0.5) can be derived from log(2)/elrc. The parameter time is the elapsed time from T0. PET/FIDESF was fitted as a function of time, where the covariates, such as N2O, PETCO2, MAP, HR, and CI, were analyzed to demonstrate their effects on the individual parameters; Asym, y0, and lrc. The term for the random effects was constructed initially with the intercepts of Asym, y0, and lrc. Between the random effects, the high correlations (r>0.9) were removed by under-parameterization. The variance component of the random effects belonging to the subjects was also examined.
Modeling for the increase in ΔrSO2 for PETDESF
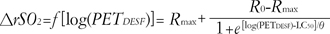
where Rmax is the maximum response, R0 is the initial response, LC50 is the log(PETDESF) value at the inflection point [=log(EC50)], and θ is simply the inverse slope factor. This is known as the four-parameter logistic model, which relates the response of ΔrSO2 to an input PETDESF using a sigmoidal function. When describing and discussing the results, all the LC50 was translated in terms of the EC50, eLC50.
The effects of PETCO2 and N2O on the individual model parameters, Rmax, R0, LC50, and θ, were the primary focus of this study. The other covariates, MAP, HR and CI, were also examined using the stepwise including and excluding technique. The term for the random effects was constructed with the intercepts of Rmax and θ. No random effects of R0 or LC50 were assumed. The block diagonal matrix was specified to represent the random effects variance-covariance matrix. The heteroscedasticity of the within-subject errors, particularly at low PETDESF levels, was accommodated using a variance function, which is a power of the absolute value of the variance covariate.
The final model was chosen based on a log-likelihood test and an analysis of variance of nonlinear mixed-effects model. The median (Q1-Q3) standardized residuals were calculated to determine the quality of the prediction for the population. The typical values of the overall cerebrovascular reactivity of rSO2 to CO2 were estimated form (Rmax(40 mmHg)-Rmax(30 mmHg))/10 mmHg in each group.
Unless specified otherwise, all values are reported as mean±SD. All statistical analyses, including nonlinear mixed-effects modeling, inferential statistics, and arithmetic calculations, were performed using S-Plus 8.0 (Insightful Corp., Seattle, WA, U.S.A.), which was enhanced using the nlme (nonlinear mixed effects) version 3.3.2 library (Pinheiro and Bates, U.S.A.).Therefore, estimates of the parameters for the fixed effects of the mixed-effects model are presented as the mean (standard error of the mean), and the residuals of the fitted model were presented as the median (Q2-Q3). Random effects were presented as overall SD of the random effects. Between the groups, the basic measurements and calculations were compared using a Wilcoxon rank test, and the gender distribution was compared using a Fisher's exact test. A multiple Wilcoxon rank test was used with the P' to compare the pairwise contrasts for the groups at 12 periods. P values <0.05 were considered significant.
RESULTS
Measurements, calculations, and the reliability of the measurements
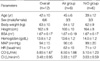
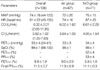
There was no significant difference in the basic measurements between the groups (Table 1). There was also no significant difference in the repeated measurements during rapid introduction of desflurane between the groups (Table 2). The mean rSO2 values before and after anesthesia were 68±8%, whose anesthesia-effect was estimated to be +0-4% but failed to reach significance at the 5% level (P=0.127). The ρ, estimated intra-class correlation between the two rSO2 measurements was 0.9336, indicating that the repeated measurements of rSO2 were reliable within-subjects.
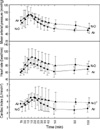
Hemodynamic variables
The MAP, HR and CI evenly showed an initial increase with a subsequent decrease (Fig. 1). The temporal changes in the MAP, HR, and CI were statistically significant (P<0.001, P=0.007, and P=0.001, respectively). N2O significantly affected the pattern of the temporal changes in the CI (P=0.021) but not MAP (P=0.059) or HR (P=0.877). Changes in N2O had no significant effect on the CI at any separate time period (P'≥0.05 between groups). Despite the statistical insignificance, N2O mildly augmented the increase in the HR (+17 beats/min), and reduced the slope of the decrease in the HR, MAP, and CI.
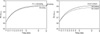
Modeling for the temporal changes in PET/FIDESF
The temporal changes in PET/FIDESF were modeled by
Predicted PET/FIDESF=f(time)=0.9080+(0.6196-0.9080)×e-e-0.7836×Time
when PETCO2=40 mmHg and CI=3.8 L/min/m2 (Fig. 2). The time to half (t0.5) was estimated to be approximately 1.5 min from T0. In concordance with the well-known concept on the pharmacokinetics of volatile anesthetics, the PETCO2 (P=0.001) and CI (P<0.001) significantly modified the Asym, not lrc or y0. A decrease in PETCO2 increased the Asym by 0.0014 (0.0009, SE)/mmHg and increase the CI by 0.0081 (0.0019, SE)/L/min/m2. No other covariates, such as the N2O, MAP, or HR, modified the parameters. There was a strong correlation between the random effects for the intercepts of Asym and y0 (r=0.983) and random effects for y0 were removed. Random effects were ±0.0458. The standardized residuals were normally distributed, -0.1803 (-0.7387-0.5468).
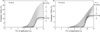
Modeling for the increase in ΔrSO2 for PETDESF
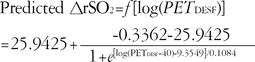
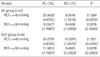
where PETCO2=40 mmHg in the Air group. In the model, R0 was constant at -0.3362 (0.2894) and Rmax, EC50 and θ were modified by a combination of PETCO2 and N2O (Table 3). No other covariates, such as MAP, HR, or CI, had a significant effect on the parameters (P≥0.05). The effects of CO2 on Rmax and θ were estimated within the course of the increase in PETDESF (Fig. 3). However, the typical values for the cerebrovascular reactivity to CO2 could be estimated by 1.5389%/mmHg in the Air group, and 1.2898%/mmHg in the N2O group (P≥0.05 between groups). Random effects were ± 2.3872. The standardized residuals were normally distributed, 0.1798 (-0.4629-0.4713).
DISCUSSION
During the rapid introduction of desflurane, the curve for the temporal increase in PET/FIDESF from a concentration of 4% to 12% in this study agreed reasonably well with a textbook example regarding the effect of PETCO2 and CI. High residuals are indicative of low predictability and the need of the two-exponential curves. We did not attempt to refine the model because it was beyond the interest of the present study. Prefilled N2O in the lung had no effect on the curve. The rapid introduction of desflurane produced a similar hemodynamic stimulatory effects to previous reports. Stimulation peaked at approximately 1.5 min from T0, which approximated to t0.5 of the curve for the increase in PET/FIDESF. N2O failed to block the stimulation of MAP and HR, or mildly promoted the increased pattern, which is comparable to the N2O-induced changes in pupil diameter reported by Daniel et al. (3). As expected, rSO2 also increased up to 24-25% according to the increase in PETDESF in a concentration-dependent manner. The residuals were extremely small and independent of any possible violation by the MAP, HR, or CI. This study did not examine the random effects in detail. The random effects were confined to refining the relationship between the predictors and the response by eliminating the individual variability. Modeling for the population was beyond the scope of this study. The fitted equation included three major parameters, Rmax, EC50, and θ.
Hypocapnia reduced the Rmax, and increased the slope in the Air group. EC50 was shifted to the right slightly but significantly. This suggests that the cerebrovascular reactivity to CO2 still subsists at more than 1.5 MAC desflurane. The CO2 reactivity was not measured while the patient was awake. Therefore, the absolute values for the reactivity cannot be used to draw any real conclusion as to whether it was intact or preserved. There are no reports on the reactivity to CO2 measured at high concentrations of desflurane that could be used to compare with the present study. With 0.5-1.0 MAC desflurane, the reactivity to CO2 is considered to be preserved (7-9). In a study of 1.5 age-adjusted MAC desflurane-anesthetized children, the reactivity to CO2 was impaired (8). The estimate of the overall reactivity to CO2 of rSO2 was 1.2898-1.5389%/mmHg, which is similar to the 1.1±0.67%/mmHg estimated results from 5% desflurane-anesthetized adults by Lee et al. (9). In this study, the reactivity to CO2 was estimated during the dynamic phase of the increasing concentration of desflurane, which is unlike the steady state used by others. Its importance is unknown and so any comparison might be invalid.
Although there is some discrepancy in the measurements or design, it can be generally summarized that the cerebrovascular effect of the solitary or additional N2O to volatile anesthetics causes an elevation (10-12), or at least no decrease (13-16) in the cerebral blood flow. Interpreting the effect of N2O on these parameters is quite complicated. During normocapnia, the addition of 60% N2O obviously increased the inverse slope factor θ and shifted EC50 to the right in order to reduce the change in rSO2 caused by an increase in desflurane concentration, while the Rmax was unchanged. These N2O-effects disappeared in hypocapnia. Lowering PETCO2 shifted the EC50 to the left and reduced the θs. Summary of the hypocapnia-effect in the N2O group is the right-shift and steepening of the curve. There may be two explanations for this observation. The rapid introduction of desflurane could cause a pronounced hyperemic condition of the brain, in which no more hyperemia could be reached even by adding N2O. The slower response in the N2O group might indicate a disturbance of the cerebral vasculatures to changes in the desflurane concentration. The other explanation is that hypocapnia overwhelms the effect of N2O.
The former explanation partly agrees with some previous studies that reported a cerebrovascular effect in anesthesia with a combination of N2O and volatile anesthetics, in which N2O had no additional effect on the volatile-induced change in cerebral blood flow velocity (16). Contradiction was also found. For example, N2O disturbs the flow/metabolism coupling when added to sevoflurane (12). No other report has estimated the additional N2O-effect even with a desflurane concentration of >1.5 MAC or with a variety of CO2 tension.
The latter explanation remains to be demonstrated. There are no reports of interactions between hypocapnia and N2O. Local factors of the brain should also be considered. N2O or volatile anesthetics redistribute rCBF (13, 17, 18). The rSO2 measurements were limited to the frontal pole of the brain, which represent neither the global CBF nor typical rCBF.
One limitation of this study is that the protocol included 3 ng/mL Ce of remifentanil during induction of anesthesia. It was clinically relevant to suppress the hemodynamic response due to laryngoscopy. By waiting 20 min from the discontinuation of the remifentanil infusion, it was confirmed the Ce fell below 0.3 ng/mL. This is the minimum concentration where no hemodynamic interaction between remifentanil and desflurane would be expected. Moreover, our episodic finding suggested that desflurane-induced sympathetic stimulation is unlikely repeat once it was stimulated, which was also inferred from the classical report by Weiskopf et al. (19).
Another shortcoming of this study is the well-known limitations of rSO2. It is believed that the confounders had been eliminated. The hemoglobin concentrations and PETCO2 values were similar in both groups, which would be regarded a major determinant for the change in rSO2. The SpO2 values were all within 98-100%, and the MAP values were within 44-123 mmHg. Only two subjects showed a MAP <50 mmHg. The within-subject variability was confirmed to be <10% with the reliability test using the intra-class correlation. The value of the intra-class correlation in examining the reliability of the repeated medical data was well described by Everitt and Rabe-Hesketh (20). The inter-subjects variability of rSO2 was also removed by considering the difference from the baseline. There was a relatively small number of subjects enrolled in this study. However, the nature of mixed-effects modeling can overcome the size of the sample. The limitations related to the small sample size always arise from the inevitable interindividual variability, which can be eliminated by mixed-effects modeling. The quality of our fitted model was exceptionally good, and the results and conclusions are strong.
In conclusion, a nonlinear mixed-effects model, which strongly predicted the response of rSO2 as the function of logarithm concentration of PETDESF, was modified only by PETCO2 and N2O. Hypocapnia shifted the response curve to the right and reduced the maximum response of rSO2 in the Air group. The cerebrovascular reactivity to CO2 still preserved within the scope of this study. It is difficult to interpret the effects of N2O on the response of rSO2 to the rapid introduction of desflurane. There are little or no N2O-induced hemodynamic changes and the effects of N2O are definitely due to its inherent cerebrovascular effect.
 XML Download