

 PDF
PDF ePub
ePub Citation
 Print
Print


Abstract
Purpose
To evaluate the efficacy of photodynamic therapy (PDT) in cases of classic choroidal neovascularization caused by age-related macular degeneration by using optical coherence tomography (OCT)
Methods
Thirty eyes of 30 patients diagnosed with predominantly classic-type choroidal neovascularization from age-related macular degeneration in the Department of Ophthalmology between March 1, 2004 and March 31, 2005 were treated with PDT. The efficacy of PDT was evaluated with OCT. From OCT findings, changes of the foveal contour, subretinal fluid, retinal pigment epithelial detachment (PED), and highly reflective external bands were analyzed and compared with findings from fluorescein angiography.
Results
After PDT, the foveal contour on OCT was recovered in 24 of 30 abnormal eyes (80%), subretinal fluid on OCT was absorbed in 18 of 26 abnormal eyes (69%), PED on OCT was reattached in 16 of 22 abnormal eyes (72%), and thick highly reflective external bands on OCT were thinned in 16 of 26 abnormal eyes (62%). The leakage on fluorescein angiography resolved in 20 of 30 abnormal eyes (67%).
Conclusions
Recovery of the foveal contour, reabsorption of subretinal fluid, reattachment of PED, and thinning of highly reflective external bands on OCT findings were achieved with PDT. The changes of foveal contour and highly reflective external band were correlated with signs of fluorescein leakage.
References
1. Huang D, Wang J, Lin CP, et al. Micron-resolution ranging of cornea and anterior chamber by optical reflectometry. Lasers Surg Med. 11:1991; 419–25.
2. Swanson EA, Huang D, Hee MR, et al. High-speed optical coherence domain reflectometry. Opt Lett. 17:1992; 151–3.

3. Hee MR, Huang D, Swanaon EA, Fujimoto JG. Polarization sensitive low coherence reflectometer for birefringence characterization and ranging. J Opt Soc Am. 1992; 9:903–8.
4. Kahn HA, Leibowitz HM, Ganley JP, et al. The framingham eye study. I. Outline and major prevalence findings. Am J Epidemiol. 1977; 106:17–41.
5. Klein R, Klein BE, Linton KL. Prevalence of age-related maculopathy. The Beaver Dam Eye Study. Ophthalmology. 1992; 99:933–43.
6. Klein R, Davis MD, Magli YL, et al. The Wisconsin age-related maculopathy grading system. Ophthalmology. 1991; 98:1128–34.
7. Ferris FL. Senile macular degeneration: Review of epidemiologic features. Am J Epidemiol. 1983; 118:132–5.
8. Macular Photocoagulation Study Group. Argon laser photocoagulation for neovascular maculopathy. Five-year results from randomized clinical trials. Arch Ophthalmol. 1991; 109:1109–14.
9. Macular Photocoagulation Study Group. Laser photocoagulation for juxtafoveal choroidal neovascularization. Five-year results from randomized clinical trials. Arch Ophthalmol. 1994; 112:500–9.
10. Macular Photocoagulation Study Group. Laser photocoagulation of subfoveal neovascular lesions of age-related macular degeneration. Updated findings from two clinical trials. Arch Ophthalmol. 1993; 111:1200–9.
11. Macular Photocoagulation Study Group. Visual outcome after laser photocoagulation for subfoveal choroidal neovascularization secondary to age-related macular degeneration. The influence of initial lesion size and initial visual acuity. Arch Ophthalmol. 1994; 112:480–8.
12. Treatment of age-related macular degeneration with photodynamic therapy (TAP) Study Group. Photodynamic therapy of subfoveal choroidal neovascularization in age-related macular degeneration with verteporfin: one-year results of 2 randomized clinical trial-TAP report. Arch Ophthalmol. 1999; 117:1329–45.
13. Verteporfin In Photodynamic Therapy Study Group. Verteporfin therapy of subfoveal choroidal neovascularization in age-related macular degeneration: two-year results of a randomized clinical trial including lesions with occult with no classic choroidal neovascularization-verteporfin in photodynamic therapy report 2. Am J Ophthalmol. 2001; 131:541–60.
14. Salinas-Alaman A, Garcia-Layana A, Maldonado MJ, et al. Using optical coherence tomography to monitor photodynamic therapy in age related macular degeneration. Am J Ophthalmol. 2005; 140:23–8.
15. Roger AH, Martidis A, Greenberg PB, Puliafito CA. Optical coherence tomography findings following photodynamic therapy of choroidal neovascularization. Am J Ophthalmol. 2002; 134:566–76.
16. Ting TD, Oh M, Cox TA, et al. Decreased visual acuity associated with cystoid macular edema in neovascular age-related macular degeneration. Arch Ophthalmol. 2002; 120:731–7.
17. Costa RA, Farah ME, Cardillo JA, et al. Immediate indocyanine green angiography and optical coherence tomography evaluation after photodynamic therapy for subfoveal choroidal neovascularization. Retina. 2003; 23:159–65.
18. Fukuchi T, Takahashi K, Ida H, et al. Staging of idiopathic choroidal neovascularization by optical coherence tomography. Graefes Arch Clin Exp Ophthalmol. 2001; 239:424–9.
19. Puliafito CA, Hee MR, Lin CP, et al. Imaging of macular disease with optical coherence tomography. Ophthalmology. 1995; 102:217–29.
20. Hee MR, Baumal CR, Puliafito CA, et al. Optical coherence tomography of age-related macular degeneration and choroidal neovascularization. Ophthalmology. 1996; 103:1260–70.
21. Brancato R, Introini U, Bolognesi G, et al. ICGA-guided laser photocoagulation of occult choroidal neovascularization in age-related macular degeneration. Retina. 2000; 20:134–42.
22. Berkow JW, Flower RW, Orth DH, Kelley JS. Flourescein and Indocyanine Green Angiography-Technique and Interpretation, 2nd ed. Vol. 1. San Francisco, CA: American Academy of Ophthalmology. 1997; 5:91–103.
23. Schmidt-Erfurth U, Miller J, Sickenberg M, et al. Photodynamic therapy of subfoveal choroidal neovascularization: clinical and angiographic examples. Graefes Arch Clin Exp Ophthalmol. 1998; 236:365–74.
24. Nicole Eter, Richard FS. Comparison of fluorescein angiography and optical coherence tomography for patients with choroidal neovascularization after photohynamic therapy. Retina. 2005; 25:691–6.
25. Arias L, Garcia-Arumi J, Ramon JM, et al. Optical coherence tomography analysis of a randomized study combining photodynamic therapy with intravitreal triamcinolone. Graefes Arch Clin Exp Ophthalmol. 2008; 246:245–54.
Figure 1.
Fluorescein angiograph of predominantly classic choroidal neovascularization due to age-related macular degeneration. Classic choroidal neovascularization is occupying over 50% of entire lesion area.
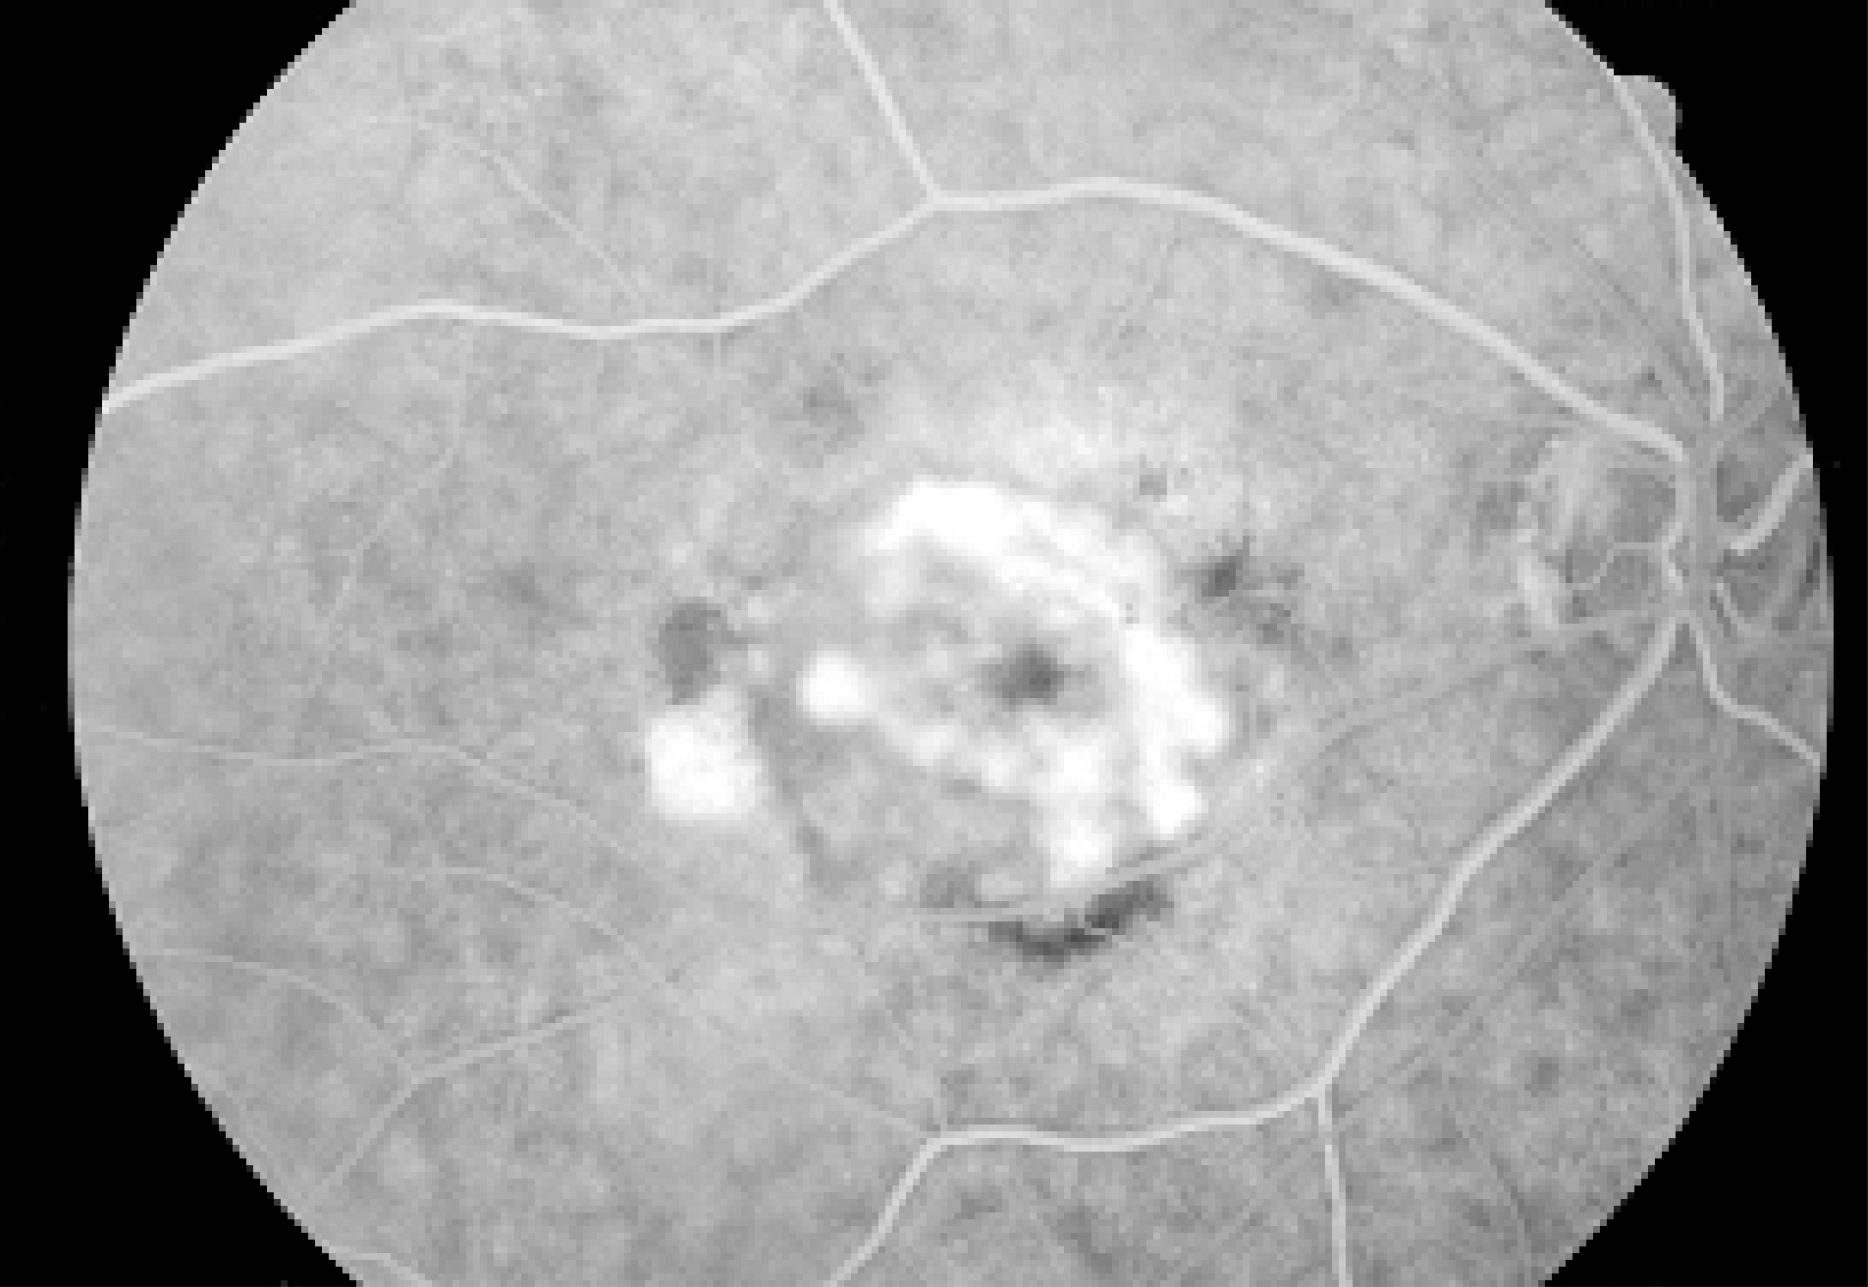
Figure 2.
Optical coherence tomographs from the eye with age-related macular degeneration. Abnormal foveal contour was seen. Sensory retinal detachment with subretinal fluid (A), retinal pigment epithelial detachment (B), and thickened high reflective external band (C) was detected.
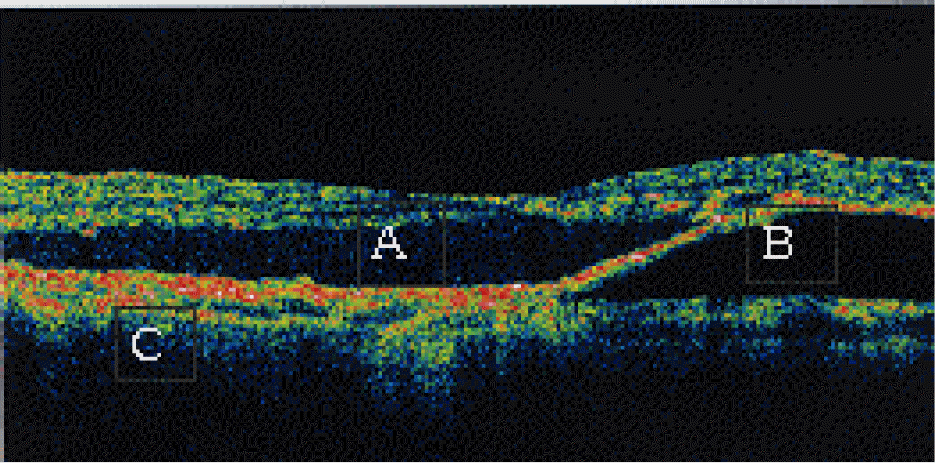
Figure 3.
Optical coherence tomographs with abnormal foveal contour before photodynamic therapy (A) and improved foveal contour after the second photodynamic therapy (B).
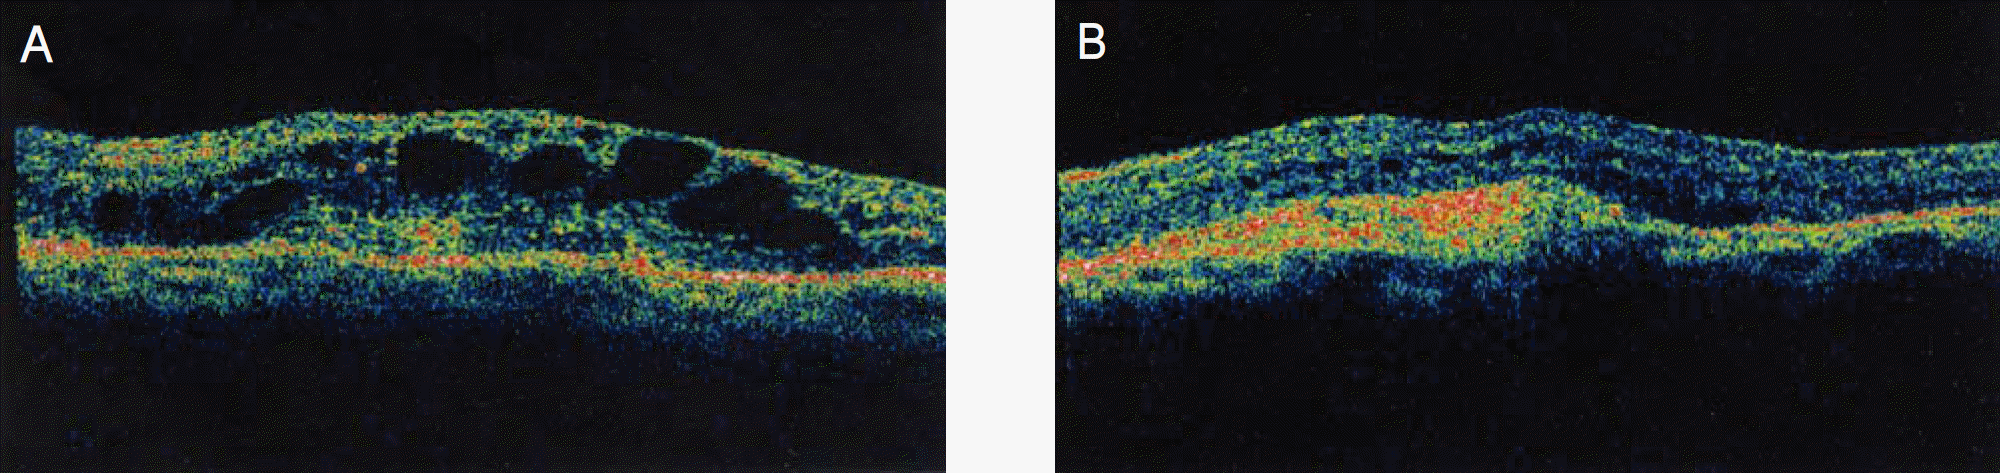
Figure 4.
Optical coherence tomographs with pigment epithelial detachment and sensory retinal detachment. Before treatment, pigment epithelial detachment with sensory retinal detachment was prominent (A). After treatment, only small pigment epithelial detachment was detected (B).
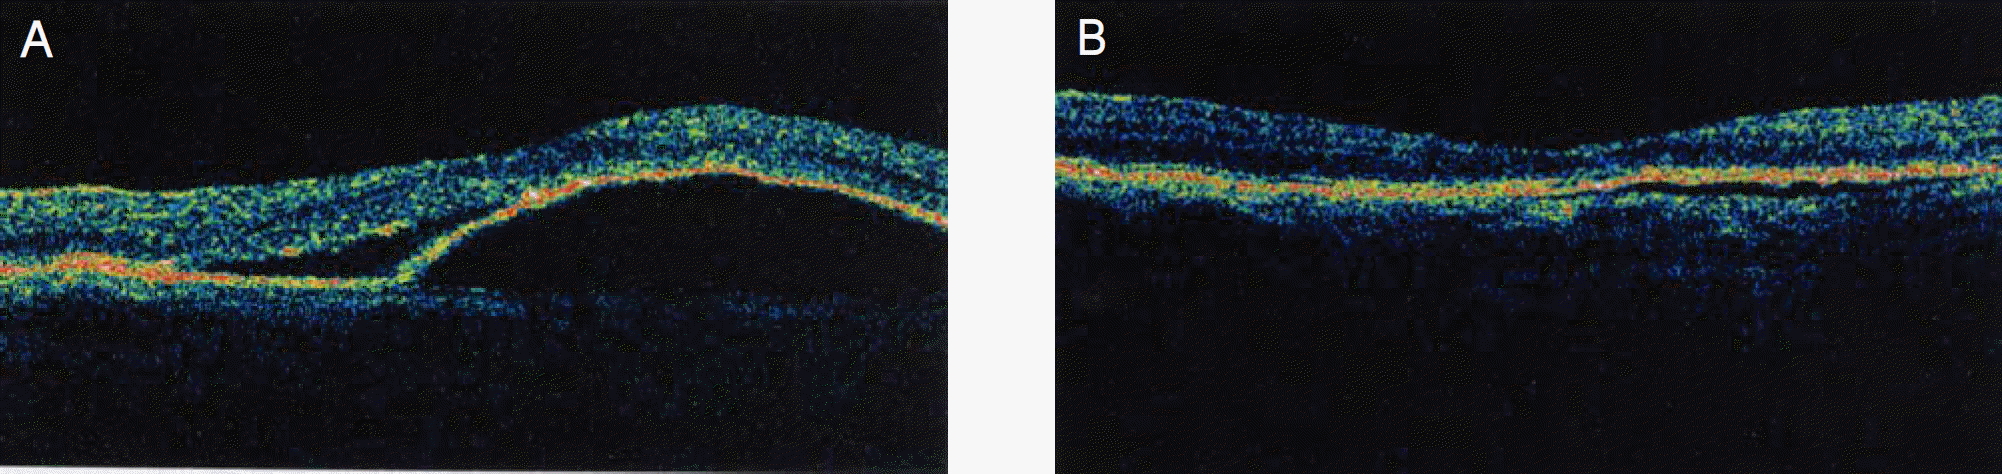
Figure 5.
Optical coherence tomographs of thick high reflective external band before photodynamic therapy (A) and thinner high reflective external band after the second photodynamic therapy (B).
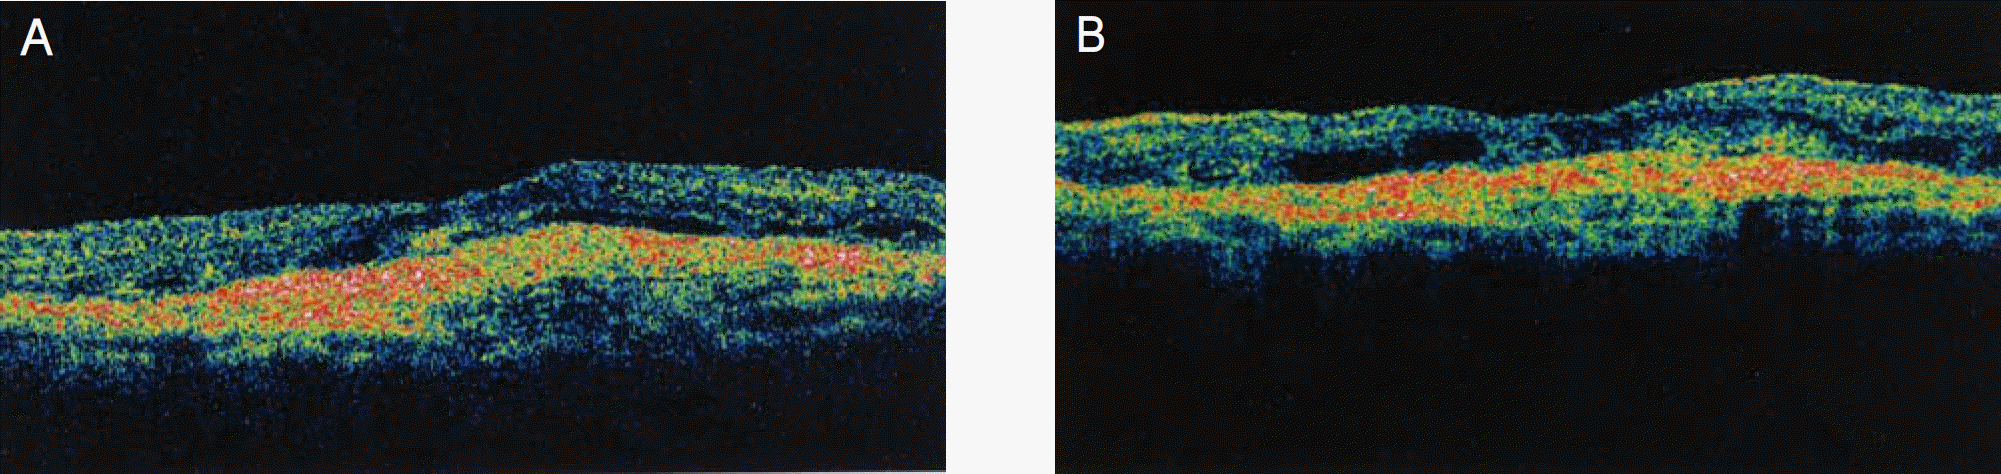
Table 1.
Abnormal OCT findings in ARMD
| OCT findings | Number (n=30) |
|---|---|
| Foveal contour loss (intraretinal fluid) | 30 (100%) |
| Serous RD | 26 (87%) |
| Thickened high reflective external band | 26 (87%) |
| PED | 22 (73%) |
Table 2.
Improved OCT findings
| OCT findings | After 1 st PDT | After 2 nd PDT | N |
|---|---|---|---|
| Foveal contour loss (intraretinal fluid) | 9 (30%) | 24 (80%)* | 30 |
| Serous RD | 13 (50%) | 18 (69%)* | 26 |
| Thickened high reflective external band | 8 (31%) | 11 (42%)* | 26 |
| PED | 12 (54%) | 16 (72%)* | 22 |
Table 3.
FAG findings before and after PDT (n=30)
| FAG findings | Before PDT | 10 weeks after 1 st PDT | 10 weeks after 2 nd PDT |
|---|---|---|---|
| Leakage (+) | 30 (100%) | 25 (83%) | 10 (33%) |
| Leakage (−) | 0 (0%) | 5 (17%) | 20 (67%) |
Table 4.
Relationship between leakage on FAG and foveal contour on OCT
|
After 1 st PDT |
|||
|---|---|---|---|
| Abnormal foveal contour | Improved foveal contour | Total | |
| Leakage | 20 (67%) | 5 (17%) | 25 (83%) |
| No leakage | 1 (3%) | 4 (13%) | 5 (17%) |
|
Total |
21 (70%) |
9 (30%) |
30 (100%) |
|
p*=0.009. |
|||
|
After 2 nd PDT |
|||
|
|
Abnormal foveal contour |
Improved foveal contour |
Total |
| Leakage | 5 (17%) | 5 (17%) | 10 (33%) |
| No leakage | 1 (3%) | 19 (63%) | 20 (67%) |
| Total | 6 (20%) | 24 (80%) | 30 (100%) |
Table 5.
Relationship between leakage on FAG and serous retinal detachment (RD) on OCT
|
After 1 st PDT |
|||
|---|---|---|---|
| Serous RD (+) | Serous RD (−) | Total | |
| Leakage | 12 (46%) | 11 (42%) | 23 (88%) |
| No leakage | 1 (4%) | 2 (8%) | 3 (12%) |
|
Total |
13 (50%) |
13 (50%) |
26 (100%) |
|
p*>0.99. |
|||
|
After 2 nd PDT |
|||
| Serous RD (+) | Serous RD (−) | Total | |
| Leakage | 5 (19%) | 3 (12%) | 8 (31%) |
| No leakage | 3 (12%) | 15 (57%) | 18 (69%) |
| Total | 8 (31%) | 18 (69%) | 26 (100%) |
Table 6.
Relationship between leakage on FAG and thickness of high reflective external band (HREB) on OCT
|
After 1 st PDT |
|||
|---|---|---|---|
| HREB↑ | HREB↓ | Total | |
| Leakage | 17 (66%) | 4 (15%) | 21 (81%) |
| No leakage | 1 (4%) | 4 (15%) | 5 (19%) |
|
Total |
18 (70%) |
8 (30%) |
26 (100%) |
|
p*=0.020. |
|||
|
After 2 nd PDT |
|||
|
|
HREB↑ |
HREB↓ |
Total |
| Leakage | 4 (15%) | 4 (15%) | 8 (30%) |
| No leakage | 1 (4%) | 17 (66%) | 18 (70%) |
| Total | 5 (19%) | 21 (81%) | 26 (100%) |
Table 7.
Relationship between leakage on FAG and pigment epithelial detachment (PED) on OCT
|
After 1 st PDT |
|||
|---|---|---|---|
|
|
PED (+) |
PED (−) |
Total |
| Leakage | 10 (45%) | 9 (41%) | 19 (86%) |
| No leakage | 0 | 3 (14%) | 3 (14%) |
|
Total |
10 (45%) |
12 (55%) |
22 (100%) |
|
p*=0.221. |
|||
|
After 2 nd PDT |
|||
|
|
PED (+) |
PED (−) |
Total |
| Leakage | 5 (23%) | 1 (4%) | 6 (27%) |
| No leakage | 1 (4%) | 15 (69%) | 16 (73%) |
| Total | 6 (27%) | 16 (73%) | 22 (100%) |
 XML Download