Abstract
Human mitochondrial DNA (mtDNA) is generally used to identify highly degraded forensic samples, particularly when the extracted DNA is not sufficient for nuclear DNA analysis. However, direct sequencing, the most widely used mtDNA analysis method, is laborious and time-consuming, and precludes the simultaneous analysis of many samples. Here, we describe a rapid and simple screening method for mtDNA analysis in Koreans using single base extension (SBE) methods. Sixteen highly polymorphic mtDNA SNPs from the control region were selected, and a multiplex SBE system was constructed to analyze them. Because the developed system consists of two duplex PCRs, which produce small amplicons with fewer than 270 bp, it works well with highly degraded samples such as old skeletal remains. Using this multiplex SBE system, 145 different haplotypes were expected to be observed from 593 unrelated Koreans. Seventy-three haplotypes were expected to be observed only once, and the most frequent haplotype was expected to occur 80 times. Since the mean number of pairwise differences was estimated to be 4.55, the developed system could be useful to exclude samples that do not match evidence and reference samples. Therefore, the multiplex SBE system used in this study will be a useful tool to analyze many samples simultaneously and to efficiently screen out non-matching mtDNA sequences in forensic casework.
REFERENCES
1. Butler JM. Fundamentals of forensic DNA typing. 2nd ed.San Diego: Elsevier Academic Press;2009.
2. Butler JM. Forensic DNA typing. Biology, technology and genetics of STR markers. 2nd ed.Burlington: Elsevier Academic Press;2005.
3. Vallone PM, Jakupciak JP, Coble MD. Forensic application of the Affymetrix human mitochondrial resequencing array. Forensic Sci Int Genet. 2007; 1:196–8.

4. Brandsta ¨tter A, Salas A, Niedersta ¨tter H, et al. Dissection of mitochondrial superhaplogroup H using coding region SNPs. Electrophoresis. 2006; 27:2541–50.

5. Grignani P, Turchi C, Achilli A, et al. Multiplex mtDNA coding region SNP assays for molecular dissection of haplogroups U/K and J/T. Forensic Sci Int Genet. 2009; 4:21–5.

6. Ko ¨hnemann S, Hohoff C, Pfeiffer H. An economical mtDNA SNP assay detecting different mitochondrial haplogroups in identical HVR 1 samples of Caucasian ancestry. Mitochondrion. 2009; 9:370–5.

7. Lee HY, Yoo JE, Park MJ, et al. East Asian mtDNA haplogroup determination in Koreans: haplogroup-level coding region SNP analysis and subhaplogroup-level control region sequence analysis. Electrophoresis. 2006; 27:4408–18.

8. Lee HY, Yoo JE, Park MJ, et al. Mitochondrial DNA control region sequences in Koreans: identification of useful variable sites and phylogenetic analysis for mtDNA data quality control. Int J Legal Med. 2006; 120:5–14.

9. Lee HY, Park MJ, Kim NY, et al. Simple and highly effective DNA extraction methods from old skeletal remains using silica columns. Forensic Sci Int Genet. 2010; 4:275–80.

10. Lee HY, Kim NY, Park MJ, et al. DNA typing for the identification of old skeletal remains from Korean War victims. J Forensic Sci. 2010; 55:1422–9.

11. Nei M. Molecular Evolutionary Genetics. New York: Columbia University Press;1987.
12. Schoske R, Vallone PM, Kline MC, et al. High-throughput Y-STR typing of U.S. populations with 27 regions of the Y chromosome using two multiplex PCR assays. Forensic Sci Int. 2004; 139:107–21.

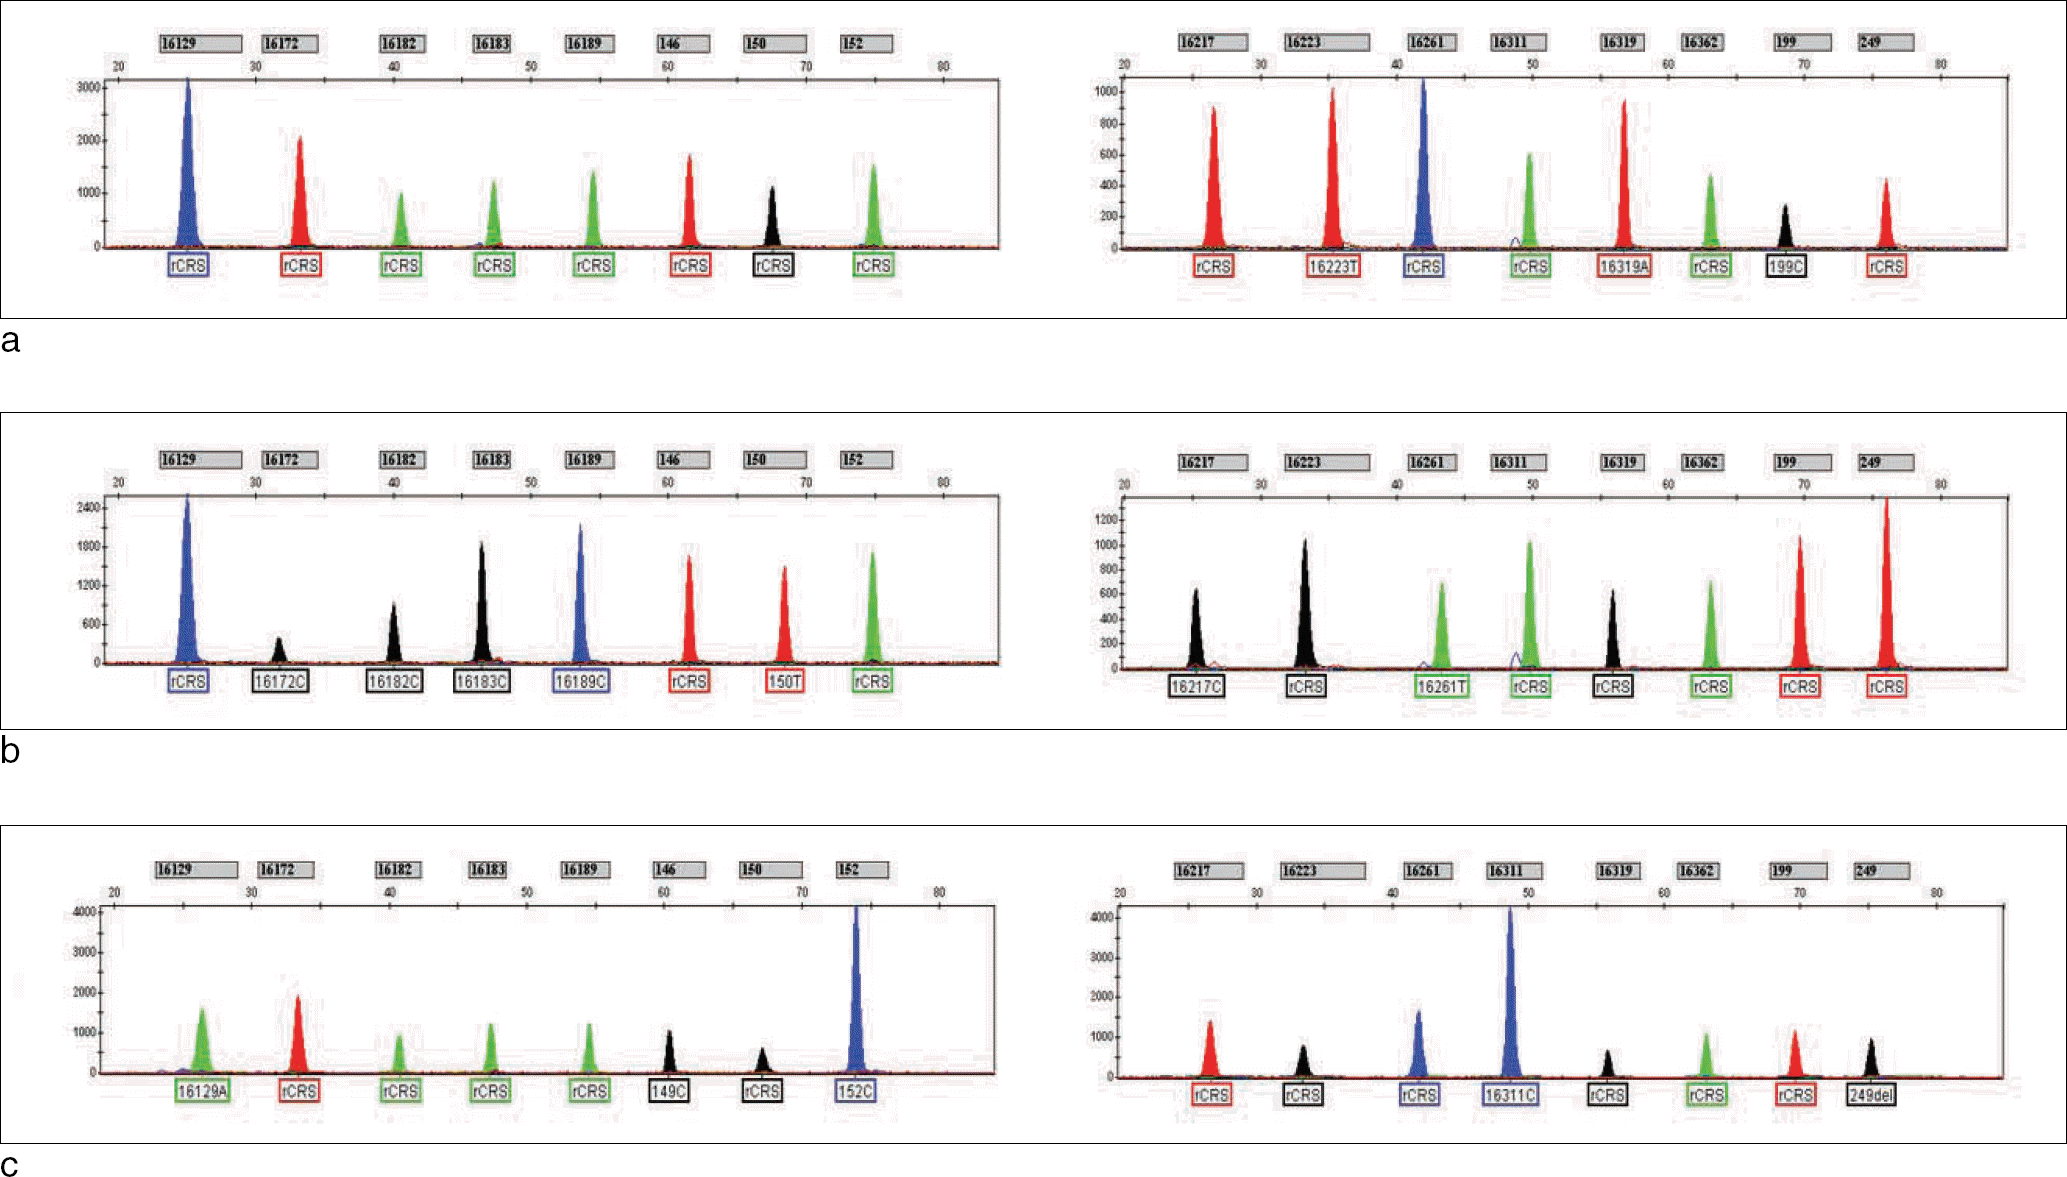
Fig. 1.
Multiplex SBE genotyping of various Korean mtDNA samples (a-c). Results for multiplex SBE I were shown on the left, and the results for multiplex SBE II were shown on the right.

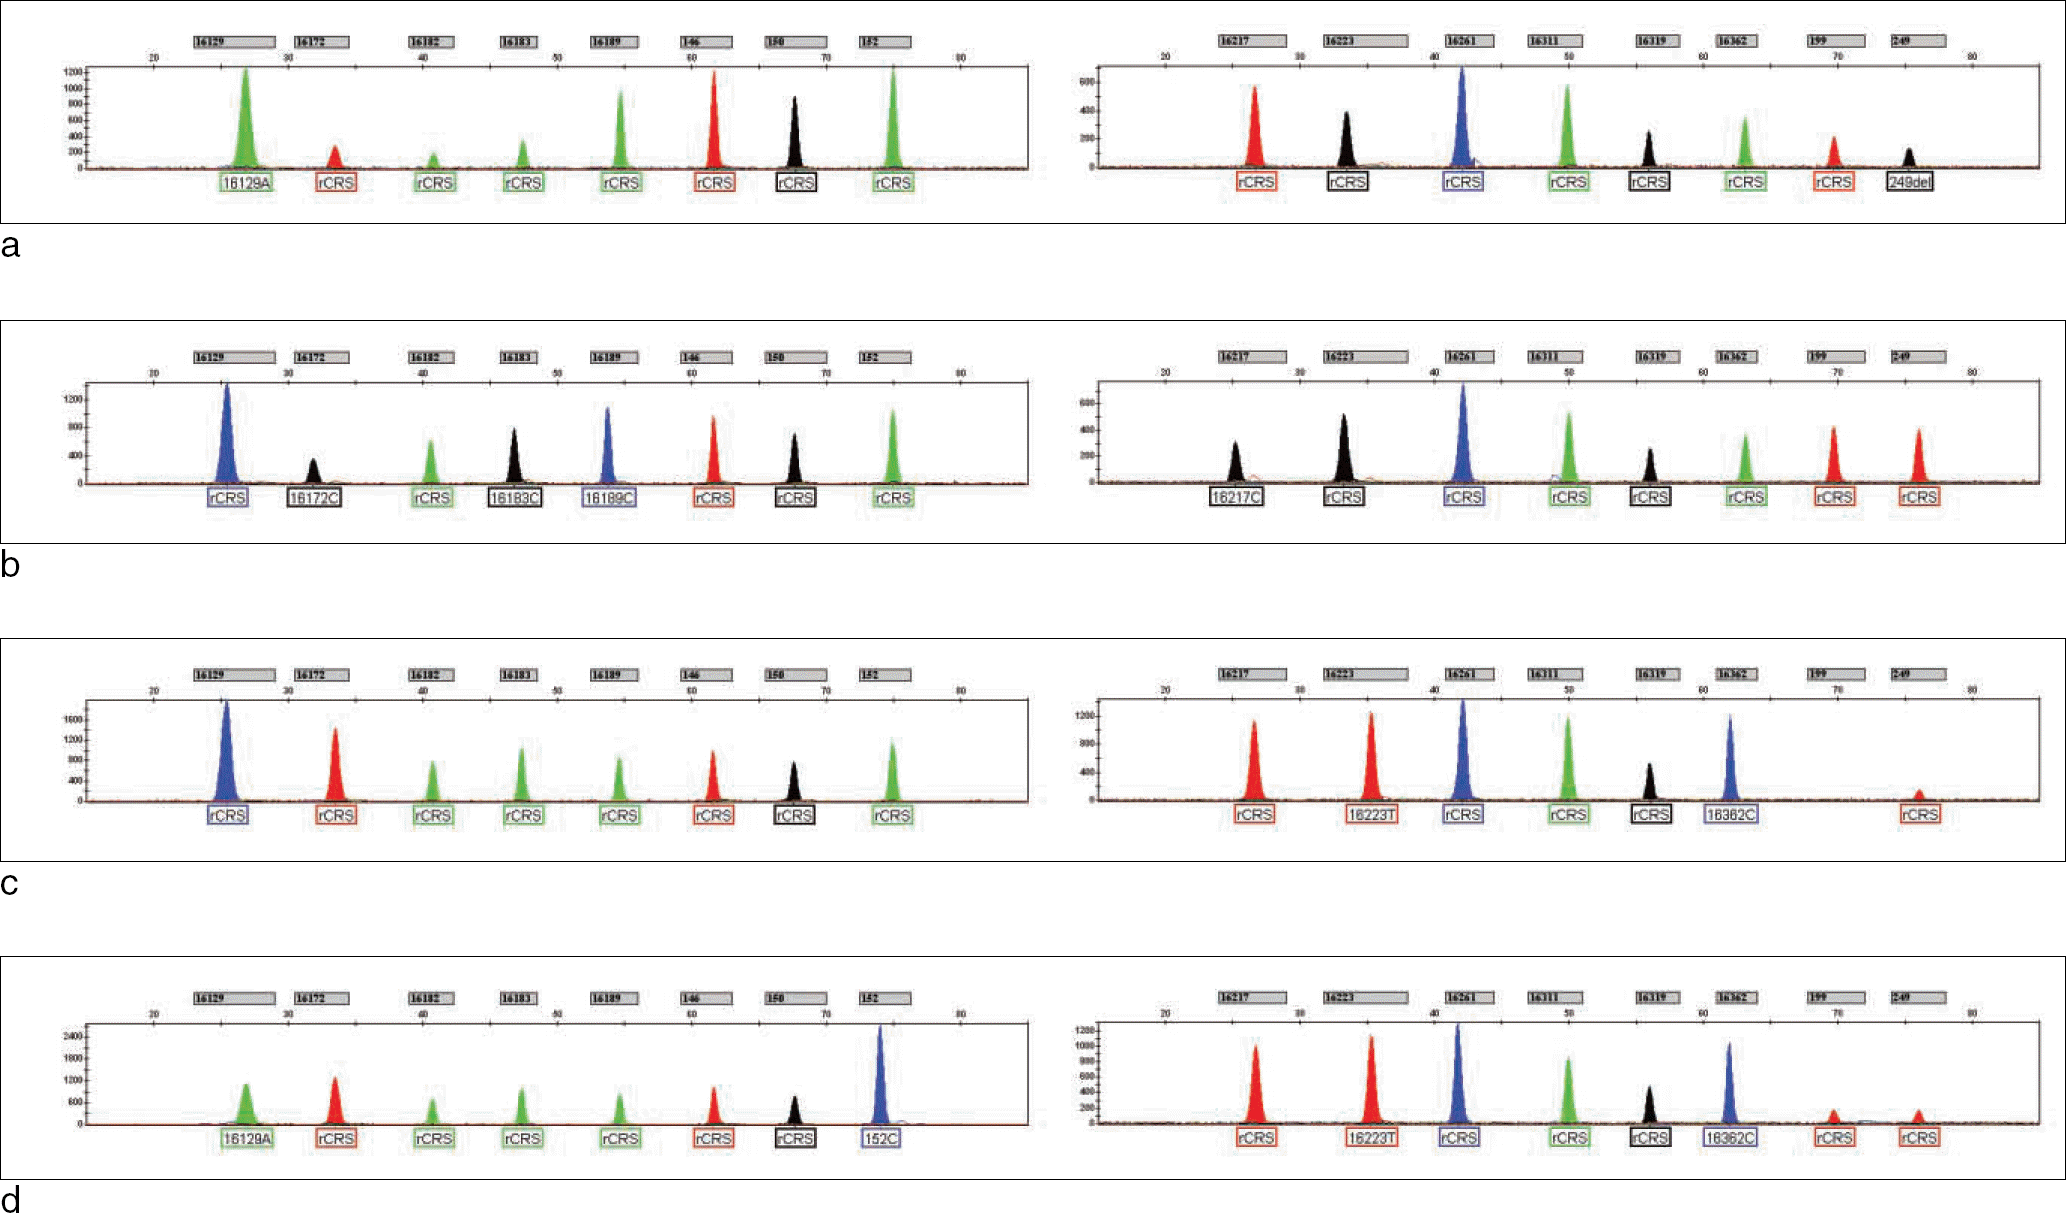
Fig. 2.
Electropherograms of multiplex SBE using degraded DNA obtained from old skeletal remains (a-d). Results for multiplex SBE I were shown on the left, and the results for multiplex SBE II were shown on the right.

Table 1.
Final Concentrations of Primer Sets for Each PCR System∗
Table 2.
SBE Primer Sequences and Final Concentrations of Multiplex SBE System
| SBE system | Primer | Sequences (5’→3’) | Conc. (uM) |
|---|---|---|---|
| I | 16129F21-21 | CAGCCACCATGAATATTGTAC | 0.13 |
| 16129-03CF20-21† | tAGCCACCATGAATATTGCAC | 0.10 | |
| 16129-18TF21-21† | CAGTCACCATGAATATTGTAC | 0.50 | |
| 16172F25-30 | (t)5CCACCTGTAGTACATAAAAACCCAA | 0.50 | |
| 16182-10YF26-39† | (t)13GTACATAAAAACCCAAYCCACATCAA | 2.00 | |
| 16183-11YF28m-46† | (t)17aAGTACATAAAAACCCAAYCCACATCAAM | 3.20 | |
| 16189R20-50 | (t)29aACTTGCTTGTAAGCATGGGG | 0.25 | |
| 146F23-58 | (t)35AGTATCTGTCTTTGATTCCTGCC | 0.20 | |
| 150F21-65 | (t)44TGTCTTTGATTCCTGCCTCAT | 0.30 | |
| 150-04CF19-65 | (t)46TCTTTGATTCCTGCCCCAT | 0.45 | |
| 152R24-72 | (t)48TTGAACGTAGGTGCGATAAATAAT | 0.35 | |
| II | 16217F23-23 | ATGCTTACAAGCAAGTACAGCAA | 0.40 |
| 16223-06YF22-32† | (t)10CAAGCAAGTACAGCAAYCAACC | 0.60 | |
| 16261R24-36 | (t)12TTTGTTGGTATCCTAGTGGGTGAG | 0.20 | |
| 16261+05AR24-36∗ | (t)12TTTGTTGGTATCCTAGTGGATGAG | 0.70 | |
| 16261+13TR24-36∗ | (t)12TTTGTTGGTATTCTAGTGGGTGAG | 0.60 | |
| 16261+17AR24-36∗ | (t)12TTTGTTGATATCCTAGTGGGTGAG | 0.40 | |
| 16311+08YR26-45† | (t)19GCTATGTACGGTAAATGGYTTTATGT | 0.80 | |
| 16311+14GR26-45∗ | (t)19GCTATGTACGGTGAATGGCTTTATGT | 0.60 | |
| 16319R25-52 | (t)26aGTAATGTGCTATGTACGGTAAATGG | 0.80 | |
| 16319+06GR25-52∗ | (t)26aGTAATGTGCTATGTACGGTGAATGG | 1.00 | |
| 16362R17-59 | (t)42GGGGGTCATCCATGGGG | 0.35 | |
| 199F27-67 | (t)40TTCAATATTACAGGCGAACATACTTAC | 0.20 | |
| 199-04CF27-67∗ | (t)40TTCAATATTACAGGCGAACATACCTAC | 0.10 | |
| 199-05TF27-67∗ | (t)40TTCAATATTACAGGCGAACATATTTAC | 0.50 | |
| 199-10GF27-67∗ | (t)40TTCAATATTACAGGCGAGCATACTTAC | 0.12 | |
| 249R18-73 | (t)55AAGCGGCTGTGCAGACAT | 0.15 |
Table 3.
Statistical Evaluation of 16 Control Region SNPs in the Present Study and 15 Coding Region SNPs of the Previous Report using 593 Unrelated Koreans’ mtDNA Sequences
| Number of haplotypes | Discrimination capacity (%) | Haplotype diversity | Mean number of pairwise differences | |
|---|---|---|---|---|
| 16 control region SNPs | 145 | 24.45 | 0.9691 | 4.55 |
| 15 coding region SNPs∗ | 020 | 03.37 | 0.8855 | 2.74 |
| 31 SNPs1 | 174 | 29.34 | 0.9836 | 7.62 |


 PDF
PDF ePub
ePub Citation
 Print
Print


 XML Download