

 PDF
PDF ePub
ePub Citation
 Print
Print


INTRODUCTION
Osteoporosis has been a global public health problem particularly among postmenopausal women, but its prevalence in males is getting increasing [123]. Recently, the prevalence of osteoporosis in Korean men aged over 65 years was reported as 15.2%, which was significantly lower than that in Korean women (57.6%), but osteoporosis is also becoming a major disease in aged men [4].
Bone mass increases primarily during the growth period, and peak bone mass is generally completed in between age 18 and 30. It has been reported that peak bone mass is one of important determinants of osteoporosis [567]. Genetic factors are the strongest determinants of peak bone mass [789], but environmental factors such as calcium or vitamin D intake, and physical activity are also important determinants [1011]. Particularly in men, risk factors for osteoporosis are not limited to aging, genetic factors, and inadequate dietary intake [12].
Demographically, drinking and smoking rates of young male adults in Korea are quite high. Our previous study reported that cigarette smoking accompanied by alcohol drinking during young adulthood reduced bone formation in Korean men [13]. On the other hand, the association between coffee or caffeine intake and bone metabolism is still controversial [14151617]. It has been suggested that the effects of caffeine intake on bone mass may depend on calcium intake; high caffeine consumption under insufficient calcium intake may have negative effects on bone metabolism [1415]. Coffee consumption is rather higher in Korean man than in Korean [18]. According to the recent report of the Korean National Health and Nutrition Examination Survey (2013 KNHANES), Korean men over 19 years drank coffee 14.3 times/week, while Korean women in the same age range drank coffee 9.6 times/week. In addition, calcium has been continually noted to be deficient in the average Korean diet [18]. In the case of Korean adult males, the average calcium intake level was reported to be 517.0 mg/day (68.9% of Recommended Intake [RI]) for men aged 19-29 years, 581.9 mg/day (77.6% of RI) for men aged 30-39 years, 571.1 mg/day (76.1% of RI) for men aged 40-49 years, and 554.0 mg/day (79.9% of RI) for men aged 50-64 years [18]. As can be seen from this report, calcium consumption of Korean young males who were in the period of achieving peak bone mass was the lowest among the different age groups. Therefore, a study is needed to investigate the effects of coffee consumption on bone metabolism in Korean young males whose calcium intake is insufficient.
Harris and Dawson-Haghes' prospective study provided practical information about coffee consumption to postmenopausal women for their bone health [15]. According to their study, among women with calcium intakes above the median (744 mg/day), 1-year rates of bone change did not differ by caffeine intake. However, among women consuming calcium less than the median, those with the highest caffeine intake (> 450 mg/day) had a significantly higher bone loss than did women consuming less caffeine. They calculated the caffeine amount to servings of brewed coffee and then concluded that daily consumption of caffeine in amounts equal to or greater than that obtained from about two to three servings of brewed coffee may accelerate bone loss in women with insufficient calcium intake. Through this study, limited coffee consumption (under two cups) is usually recommended for women's bone health.
However, to our knowledge, though coffee has become the most popular beverage especially among young adult males in Korea, coffee intake is associated with bone metabolism-related markers according to their dietary calcium intake levels. Thus, the purpose of this study was to investigate the association between coffee consumption and bone mineral density and bone metabolism-related markers according to calcium intake level in Korean young adult males.
MATERIALS AND METHODS
Subjects
This study was secondary analysis of our previous study on the relation between bone metabolism and drinking and smoking status of Korean young males [13]. Poster and announcement notices were used to recruit 483 Korean adult males aged 19-26 at Ajou University (Suwon, Korea). All subjects completed a questionnaire upon study entry and were absolved of anthropometrical characteristics. Bone mineral density of either calcaneus was measured by quantitative ultrasound and bone metabolism-related markers including serum total alkaline phosphatase activity (TALP) and N-mid osteocalcin (OC) concentrations were analyzed for each subject. Of the 483 participants, 153 subjects were excluded from the study because of a history of prior medication and cigarette use that may have led to alterations of bone metabolism. The study was approved by the Ajou University institutional review board, and informed consent was obtained from all participants.
Study design
The subjects were divided into two groups based on daily calcium intake level: a calcium-sufficient group (calcium intake ≥ 75% RI, n = 171) and a calcium-deficient group (calcium intake < 75% RI, n = 159). In this study, we considered subjects calcium-deficient if their calcium intake was below 75% of the calcium RI for their age [19]. Each group was then further divided into subgroups based on coffee consumption: no-coffee, less than one serving of coffee per day (< one-coffee group), and one serving or more of coffee per day (≥ one-coffee group) (Table 1). One serving was defined as 150 mL liquid coffee, based on the subjects' most commonly consumed serving size. In this study, the most commonly consumed coffee type was an instant mixed coffee which contained instant coffee powder and some sugar or cream.
Table 1
Distribution of the subjects by calcium and coffee intake

Anthropometrical measurements
Height was measured with a vertical measuring board from floor level. Subjects were weighed in the standing position lightly clothed. Body Mass Index (BMI) was calculated from the measured weight and height as weight/height2 (kg/m2).
Questionnaire interview
Each participant completed a questionnaire conducted by the investigators. The questionnaire included the participant's age, health status, cigarette smoking status, alcohol drinking history, doing regular exercise, sleep duration, and beverage consumption status including milk, carbonated beverage, and coffee. Questions about coffee consumption concerned whether they consumed coffee, their weekly frequency of coffee consumption, and the amount of coffee consumed per occasion were asked.
Food intake data were surveyed for 2 days under the guidance of investigators using the 24-hour recall method. Food models, cups, and spoons of various sizes were used to help the subjects recall the estimated portions eaten. Energy and nutrient intakes were analyzed using the CAN-Pro 3.0 (The Korean Nutrition Society, Seoul, Korea).
Measurement of bone mineral density (BMD)
Bone mineral density (BMD) of the calcaneus was measured a single time for each subject by quantitative ultrasound (Sahara, Hologic, Bedford, MA, USA). Using a Quality Control Phantom, the instrument was calibrated daily. The measurement values obtained included the broadband ultrasound attenuation (BUA), speed of sound (SOS), and Quantitative ultrasound index (QUI), from which BMD and T-score estimations were computed. The coefficients of variation (%CV) for BMD, BUA, SOS, and QUI of the calcaneus were 3%, 3.7%, 0.22%, and 3.7%, respectively.
Blood bone metabolism marker analysis
Ten milliliters of fasting blood were drawn from all subjects, and serum was separated by centrifugation at 3,000 rpm for 15 minutes and stored in a freezer at -70°C until analysis. The serum samples were analyzed for TALP (Autoanalyzer, Toshiba, Japan), OC (Osteo-RIACT, CIS bio international, France), and 1CTP (UniQ ICTP RIA, Orion Diagnostica, Finland).
Statistical analysis
The data were given numerically as means with standard deviations. The three coffee intake subgroups underwent ANOVA analysis (One-Way Analysis of Variance) and Duncan's multiple range tests to determine any significant differences. Chi-square tests were used to test significance of distribution proportions within the groups. Analysis of covariance (ANCOVA) was also used to compare least squares means (LSM) of the QUS and bone metabolism markers among the three coffee subgroups. The LSM represents the mean value adjusted for the average value of the covariate (age, energy intake, calcium intake, protein intake, milk intake, and carbonated beverage intake) among the three groups. Data analysis was conducted using the statistical software package for Windows (SAS version 9.03, SAS institute, Cary, NC, USA).
RESULTS
General characteristics
General characteristics of the subjects are shown in Table 2. The mean age of the subjects was 22.6 years, which was not significantly different among the three coffee consumption subgroups of the calcium-sufficient group. But, in the calcium-deficient group, the mean age of the ≥ one-coffee group was significantly higher than that in the non-coffee and < one-coffee groups. There were no significant differences in height, weight, and BMI between the calcium intake groups or among the three coffee consumption subgroups.
Table 2
General characteristics by coffee intake in healthy adult males with below and above 75% of recommended calcium intake

Energy, nutrients, and beverage intake status
Intake status of energy, nutrients, and beverages of the subjects is shown in Table 3. There were no significant differences in intakes of energy, calcium, and most of the nutrients among the three coffee consumption subgroups. In the calcium-deficient group, however, protein intake in the ≥ one-coffee group was significantly lower than that in the non-coffee and < one-coffee groups. Beverage intake status of the subjects was significantly different according to the coffee consumption status. In the calcium-deficient group, milk and carbonated beverage intake of the ≥ one-coffee group was significantly higher than those of the other groups in both calcium-deficient and calcium-sufficient subjects. But, no significant difference was found in alcohol drinking amount and BMI between the two calcium intake groups or among the three coffee consumption subgroups.
Table 3
Daily energy, nutrients, and beverage intake by coffee consumption in healthy adult males with below and above 75% of recommended calcium intake
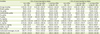
Quantitative ultrasound parameters and blood bone turnover markers
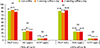
QUS parameters and serum 1CTP were not significantly different among either calcium intake groups or the three coffee consumption subgroups (Table 4). In the calcium-deficient subjects, serum TALP level was significantly lower (p < 0.05) in individuals who consumed over one serving of coffee a day compared to the other subgroups. Also, serum OC levels in individuals who consumed one or more servings of coffee a day tended to be higher than in individuals who consumed under one serving of coffee a day (Table 5). However, after adjusted for age, and energy, calcium, protein, and milk and carbonated beverage intakes, serum ALP and OC levels were not significantly different among the three coffee consumption groups in calcium-deficient subjects (Figure 1).
Table 4
Bone status by coffee intake in healthy adult males with below and above 75% of recommended calcium intake

Table 5
Serum bone metabolism-related parameters by coffee intake in healthy adult males with below and above 75% of recommended calcium intakes

Figure 1
Least square means of serum total alkaline phosphatase (TALP), N-mid osteocalcin (OC), and type 1 collagen C-terminal telopeptide (1CTP) in calcium-deficient subjects after adjusting for age, regular exercise status, and intake of energy, protein, calcium, sodium, milk, and carbonated beverages.
DISCUSSION
This study analyzed and compared the BMD and bone metabolism-related biomarkers according to coffee intake depending on calcium intake levels in young adult males. The major result was that the daily coffee intake at levels presently consumed by Korean young males was not significantly associated with bone status and metabolism according to the calcium intake level.
Previous studies have shown various results on the relationship between coffee intake and BMD. While Lloyd et al. [16] reported no association between caffeine intake and the frequency of fractures or changes in BMD, other studies have reported significant associations between caffeine intake and BMD [15]. This discrepancy may be due to differences in the methods of analyzing BMD, the study targets, the methods used to evaluate caffeine or coffee intake, and caffeine or coffee exposure levels in the study populations.
In this study of targeted young adult males, the BMD of the calcaneus according to coffee intake was not significantly different. Rico et al. [20] who measured bone status with the same method used in this study, reported that the caffeine intake of postmenopausal women had no significant relationship with the phalangeal bone ultrasound. Conlisk and Galuska [21] also reported no association between caffeine intake and BMD of the femoral neck and lumbar spine using dual-energy X-ray absorptiometry (DXA) in young adult males aged 19-26, a finding similar to that of this study. Although the subjects and the measurement method of BMD were different from those in this study, the results of no association between caffeine and coffee intake and BMD are consistent. Because the subjects were young under the age of 30 when peak bone mass is completed, it should be considered that their coffee consumption period was relatively short and the difference in BMD among the subjects may have been low. Consequently, we analyzed the difference in bone metabolism-related biomarkers according to coffee intake level. As a result, serum TALP as a bone formation marker of the subjects who consumed one or more servings of coffee per day with a calcium-deficient diet was lower than that of the low or no-coffee consumers. This result indicates that continuous drinking of one or more servings of coffee a day in young adult males may contribute to a deterioration of bone status by reducing bone formation. However, in the further analysis adjusting for possible confounders such as age, intake amount of energy, protein, calcium, milk, and carbonated beverage on bone metabolism, the significant difference in serum TALP level among the three coffee groups disappeared.
Although studies on the relation between caffeine or coffee intake and BMD are primarily targeted to women, only few studies have been conducted among the population of men. Studies of female subjects are divided into the premenopausal and postmenopausal women research because their bone metabolisms are dramatically different. This study is original in that it is a research conducted in the target population of young men with different consumption of coffee and during the period of accomplishing peak bone mass. Hallström et al. [22] reported that high coffee consumption, over 4 cups a day, had 4% lower BMD at the proximal femur compared with low or non-consumers of coffee in elderly men, but not in women. However, other previous studies targeting men showed no association between coffee consumption and BMD [2526]. In this study, the significant association between coffee intake and BMD and bone metabolism markers was not observed. Considering the results of Hallström et al. [22] and the tendency of reduced bone formation markers in one or more servings of coffee per day of young adult males with a calcium-deficient diet in this study, high coffee consumption may be connected to a decrease in BMD. However, a longitudinal study on the effects of coffee consumption on bone status should be conducted in the future.
Studies that evaluate caffeine or coffee intake and its relation to BMD mainly use the food-frequency questionnaire method. However, accurate assessment of the intake of caffeine is difficult because the range of caffeine content in coffee is broad depending on the type of coffee and its production method. In addition, because coffee contains a variety of ingredients including caffeine, the effect of coffee consumption on BMD can be different with that of caffeine only. Nevertheless, the relevance of coffee intake to BMD in most studies is interpreted by the effect of caffeine. The caffeine content of instant coffee investigated in this study was about 50 mg/cup (150 mL). Therefore, the daily caffeine intake of the subjects in this study was calculated under 20 mg for the < one-coffee group and about 100 mg for the ≥ one-coffee group. Caffeine is an ingredient in not only coffee but also tea, some soft drinks, cocoa, chocolate, etc. Lloyd et al. [16] reported that 90% of total caffeine intake/d is achieved through coffee and tea. Therefore, the actual caffeine intake of the subjects who consumed two cups of coffee per day in this study may have been slightly higher than 100 mg. Even though serum ALP of the ≥ one-coffee group tended to be lower than that of the other groups, their average caffeine intake of about 100 mg/day was not high enough to affect BMD and metabolism-related biomarkers.
Conlisk and Galuska [21] reported that the average caffeine intake evaluated using the intake frequency and amount of coffee, tea, caffeinated soft drink, and chocolate in 177 young adult women was 99.9 mg/day and caffeine intake at this level was not significantly related to BMD. Hasling et al. [23] reported that 112 mg of caffeine intake increases calcium loss by 0.24 mM/day (up to 10 mg). However, Rico et al. [20] reported that when the subjects were stratified into the no more and more than 100 mg/day of caffeine, the BMDs between the two groups were not significantly different. Choi et al. [24] reported that the BMDs of the femoral neck or lumbar spine among the premenopausal subjects who consumed less than a cup of coffee/day, one cup, two cups, and three cups were not significantly different. These results of previous studies with a similar level of caffeine or coffee intake to that in this study showed no significant relationship with BMD, in line with the result of this study.
Interestingly, we found a positive association between coffee consumption and other beverage consumption such as milk and carbonated beverage. In other words, young adult males who consumed more coffee were more likely to drink milk or carbonated beverages. The effects of milk and carbonated beverages on bone are contradictory. Some studies have proved positive effects of milk on BMD in Koreans [2728]. In contrast to milk, some of the epidemiologic studies reported negative effects of carbonated beverage (soda) consumption on bone health [293031]. Several mechanisms have been suggested to explain a potential association between soda consumption and bone health [29], one of which is caffeine, an ingredient in many sodas and a risk factor for osteoporosis via the interference with calcium absorption and excretion [32]. These contrasting two factors are high in the higher coffee consumption group; therefore, we included both factors as confounders when comparing bone status and serum bone metabolism markers among the coffee consumption subgroups.
There are some limitations to generalize the results of this study. First, BMD, the main dependent variable, was measured by quantitative ultrasound of the calcaneus instead of the major sites of the femoral neck and lumbar spine using DXA measurements, so interpretation of the relevance of coffee intake to BMD may be restricted. Second, since coffee intake in this study was evaluated using self-report of the subjects, this level may be slightly different from the real coffee and caffeine intake. Third, even after some adjustments were made, potential confounding factors may have remained. Lastly, the study had a small sample size and thus needs to be repeated using a larger population. Despite these limitations, this study has strength in its originality and significant findings on the relevance of coffee intake to BMD and bone metabolism markers in young adult males, an understudied population in such research.
CONCLUSION
This study analyzed and compared the BMD and bone metabolism markers according to coffee intake in Korean young adult men aged 19-26 years. No significant associations were found between current coffee consumption level in Korean young men, and bone status and metabolism according to the calcium intake levels. Considering that coffee consumption is continuously increasing, while the problem of dietary calcium-deficient intake has not been solved, continued research on the effects of coffee intake and bone health in men relative to calcium intake is required.
 XML Download