

 PDF
PDF ePub
ePub Citation
 Print
Print


Introduction
Hypertension is the main cause of cerebrovascular diseases, ischemic heart diseases, cardiac failure and kidney failure [1]. Hypertension is reported to be one of the most important causes of early death. More than 1/4 of the global adult population (approximately 1 billion people) were diagnosed with hypertension in 2000 and 29% of the population (1.56 billion people) is expected to have hypertension in 2025 [2]. The National Center for Health Statistics (NCHS) of the Centers for Disease Control and Prevention (CDC) reported that nearly 30% of Americans were diagnosed with hypertension in 2011 [3]. Established risk factors for hypertension include obesity, low physical activity, alcohol drinking, high sodium intake, and low intakes of fruits, vegetables, and potassium [4]. Also, several studies have suggested that intakes of sugars and sugar-sweetened beverages (SSBs) increased blood pressure [5-8].
Sugars are naturally present in many types of food such as fruits and dairy products and commonly used as additive substances to soften the texture of food and create a sweet flavor [9]. According to the U.S. Department of Agriculture (USDA), added sugars account for 16% of total calories in American meals and the sugars and syrups added in the food production or cooking process include high fructose corn syrup (HFCS), white sugar, black sugar, corn syrup, malt syrup, maple syrup, pancake syrup, fructose sweetener, liquid fructose, honey, molasses and anhydrous dextrose [10]. The high fructose corn syrup, commonly used as sweetener in processed foods such as sugar-sweetened beverages, is a monosaccharide composed of 55% fructose and 45% glucose [11]. SSBs are the major source of added sugars, so called caloric sweeteners, in the US [12]. The HFCS is often used as sweetener for soft drinks, fruit drinks, candied fruits, canned fruits, dairy desserts, flavored yogurts as well as most types of bread, grain and jelly products [13].
The amount of calories consumed among an American adult aged 19 or higher from SSBs was doubled from the 64.4 kcal/d in the 1970s to 141.7 kcal/d in 2006 [14]. According to the data presented by the National Health and Nutrition Examination Survey (NHANES), the proportion of adults consuming SSBs was increased from 58% in the NHANES 1988-1994 survey to 63% in the 1999-2004 survey. Also, energy intake from SSBs per adult was increased by 46 kcal/d, from 157 kcal/d in the NHANES 1988-1994 to 203 kcal/d in the NHANES 1999-2004 [12]. Intake of SSBs increased the risk of obesity [15], metabolic syndrome [16], type 2 diabetes [16], and coronary heart disease (CHD) [17]. Given that role of sugar in hypertension has not been clearly established, we examined the association between intakes of sugar and SSBs and the prevalence of hypertension using the data of the National Health and Nutrition Examination Survey 2003-2004 and 2005-2006.
Materials and Methods
Study population
Among 19,593 respondents (2003-2004; n = 9,950, 2005-2006; n = 9,643) in the National Health and Nutrition Examination Survey 2003-2004 and 2005-2006, participants were excluded if they were under age of 19 years, pregnant women and those who answered to have been diagnosed with hypertension, were told to have high blood pressure more than 2 times in the past or were taking hypertension medicine. We also excluded those who reported implausible daily calorie intake; below 800 kcal or above 5,000 kcal for men and below 500 kcal or above 4,500 kcal for women. As a result, a total of 3,044 participants, 1,481 men (48.7%) aged 19 years or above and 1,563 women (51.3%) aged 19 years or above, were included. Among participants included in our study, a total of 357 men and women had ≥140 mmHg of systolic blood pressure (SBP) or ≥90 mmHg of diastolic blood pressure (DBP), determined by direct measurement of blood pressure. NHANES was approved by the NCHS Research Ethics Review Board and written consent was received from research participants.
The National Health and Nutrition Examination Survey
The National Health and Nutrition Examination Survey [18] has been implemented by the NCHS of CDC from the early 1960s to evaluate the health and nutritional status of adults and children in the US. The survey has been conducted through interview and physical examination. The interview has been carried out on demographic items, socio-economic items, dietary survey and health-related items, whereas the physical examination includes medical and dental examinations, physiological measurements and biochemical examination.
Blood pressure measurement
Blood pressure measurement was measured by a trained physician by using the mercury sphygmomanometer and cuffs of suitable size at the Mobile Examination Center (MEC) using standardized protocol. Participants were asked to sit down and rest for 5 minutes before measurement. The blood pressure was measured in the right arm, or in the left arm if the measurements could not be taken in the right arm. The average blood pressure of participants whose blood pressures were measured more than 2 times was calculated by computing the average of blood pressures excluding the first blood pressure measurement. For participants whose blood pressures were measured only 2 times, the second blood pressure was selected as the average blood pressure [19]. One blood pressure reading was used if only one blood pressure was measured. According to the hypertension definition of the 7th report presented by the Joint National Committee (JNC), hypertension was classified into the case in which SBP was equal to or above 140 mmHg or DBP was equal to or above 90 mmHg [4].
Assessment of dietary factors
Participants completed the 24-hour dietary recall 2 times. The first 24-hour dietary recall was written through the personal interview at the MEC and the second 24-hour dietary recall was performed via phone 3-10 days later. Types and amount of food and beverages consumed, whether food was eaten at home, and name of eating occasion for each meal during the last 24 hours and its day of the week were asked. Various cups, plates, spoons and bottles were used to record the quantity of food. The NHANES FFQ was developed based on the National Cancer Institute (NCI) Diet History Questionnaire (DHQ), which measures the frequency of 124 food items widely used in nutritional epidemiology studies. However, information on portion sizes was not separately assessed in the NHANES [20].
The average intake of total sugar (g/d) was calculated through the two 24-hour dietary recalls. Information on intake of SSBs for each participant over the past 12 months was obtained from the intake frequency, during summer or the rest of the year, of soft drinks/soda and other fruit drinks such as cranberry cocktail, Hi-C, lemonade, or Kool-Aid on the FFQs. The servings per day on the FFQ in the NHANES was categorized into 10 groups; never, 1 time per month or less, 2-3 times per month, 1-2 times per week, 3-4 times per week, 5-6 times per week, 1 time per day, 2-3 times per day, 4-5 times per day, and 6 or more times per day. According to the algorithm presented in the NHANES, a daily frequency was assigned as follows; never to 0, 1 time per month or less to 0.03, 2-3 times per month to 0.08, 1-2 times per week to 0.21, 3-4 times per week to 0.50, 5-6 times per week to 0.79, 1 time per day to 1, 2-3 times per day to 2.5, 4-5 times per day to 4.5, and 6 or more times per day to 7. We distinguished intakes of SSBs from sugar-free beverages by using the frequency weight asked for soft drinks/soda and other fruit drinks.
For intakes of total energy and other nutrients, including carbohydrate, total, saturated, monounsaturated, and polyunsaturated fat, cholesterol, dietary fiber, folate, sodium, potassium, and sodium/potassium ratio, calcium, and caffeine, the average intake from the two 24 hour dietary recalls were calculated.
Assessment of non-dietary factors
Participants were asked about their gender, race, level of education, smoking habits, alcohol drinking, physical activity, and history of diabetes and hypertension. Weight and height were directly measured. Body mass index was calculated as weight in kilograms divided by squared height in meters. Metabolic equivalent-hours (MET-hours) of exercise per week was calculated from individuals' engagement in moderate or vigorous leisure-time activities over the past month.
Statistical analysis
The general characteristics were compared according to intakes of total sugar and SSBs using chi-square test for categorical variables and t-test for continuous variables. The multivariate logistic regression was used to calculate the Odds Ratio (OR) and 95% Confidence Intervals (CIs). Age (years, continuous), gender, BMI (in kg/m2; <23, 23 to <24.9, 25 to <29.9, ≥30), levels of education (less than high school graduate, high school graduate, some college/no degree or associate's degree, college graduate or higher), race (Hispanic, non-Hispanic white, non-Hispanic black, others), alcohol drinking (g/d, continuous), smoking (pack-years, continuous), sodium/potassium intake ratio (continuous), total caloric intake (kcal/d, continuous), physical activity (Mets-hr/wk, continuous), and history of diabetes (yes, no) were adjusted as potential confounding factors. All statistical analyses were performed by using SAS software version 9.2 (SAS Institute Inc., Cary, NC, USA) and p values < 0.05 were considered significant.
Results
General characteristics
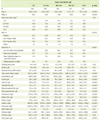
Table 1 shows the general characteristics of 3,044 participants according to the daily sugar intake. Those who had high sugar intake were more likely to be younger, male, and non-Hispanic black, and less likely to be physically active compared to those who had low sugar intake. Total caloric intake and intakes of carbohydrate, protein, total, saturated, monounsaturated, and polyunsaturated fats, cholesterol, dietary fiber, folate, sodium, potassium, and calcium were higher among those with high sugar intake compared to those with low intake.
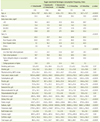
The general characteristics of participants according to intake of SSBs are presented in Table 2. High SSB consumers were more likely to be younger and non-Hispanic black and less likely to attend college and exercise compared to those with low SSB intake. Higher intakes of total calorie, carbohydrate, protein, total, saturated, monounsaturated and polyunsaturated fats, dietary fiber, folate, sodium, sodium/potassium intake ratio, and total sugars, but lower potassium intake were observed among those who consumed high SSBs compared to those with low intake of SSBs.
Intakes of sugar and SSBs and the prevalence of hypertension
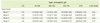
When we examined the association between intake of total sugars and the prevalence of hypertension by defining hypertensive cases as those who had high blood pressure, but were not aware of their hypertensive status, we did not observe the statistically significant differences in the prevalence of hypertension according to intake of total sugars (Table 3); OR (95% CIs) was 1.06 (0.62-1.82) comparing 175 g/d or greater sugar intake with <75 g/d of sugar intake in the model where we adjusted for age, gender, NHANES period, BMI, total caloric intake, race, pack-years of smoking, alcohol drinking, sodium/potassium intake ratio, physical activity, levels of education, and history of diabetes.
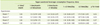
Table 4 presents the associations between intake of SSBs and the prevalence of unaware hypertension. The prevalence of hypertension was significantly higher among those who consumed SSBs of 3 or greater times per day compared to those who consumed less than once per month in the models 1 and 2. In model 1, which adjusted for age, gender and NHANES period, a 1.74 times higher prevalence of hypertension was observed among those who consumed SSBs of 3 or greater times per day when compared with those who consumed less than once per month (95% CI = 1.00-3.01; p for trend = 0.05). Model 2, which adjusted for age, gender, NHANES period, and BMI, presented an OR of 1.87 (95% CI = 1.06-3.26, p for trend = 0.03) comparing 3 or greater times per day with less than once per month of SSB intake. Although significant differences were not presented in model 3 or 4, where we additionally adjusted for other potential confounding factors, a tendency of higher prevalence of hypertension, was observed for 3 or greater times per day of SSB intake compared to less than once per month; ORs (95% CIs) were 1.41 (0.80-2.50) in model 3 with further adjustment for total caloric intake, race, pack-years of smoking, alcohol drinking, sodium/potassium intake ratio, physical activity, and levels of education and 1.50 (0.84-2.68) in model 4 where history of diabetes was additionally adjusted. Race and levels of education were factors that attenuated the association for SSB intake in relation to the prevalence of hypertension.
Discussion
In our analysis of the NHANES 2003-2006 data, we found that total sugar intake was not associated with the prevalence of hypertension, but intake of SSBs tended to be associated with the prevalence of hypertension.
Lack of the association between total sugar intake and the prevalence of hypertension may be because total sugar intake was calculated from the two 24-hour dietary recalls, which contained intra-individual variation, and thus could not presumably reflect the usual intake of total sugar intake. Meanwhile, intake of SSBs, assessed by the FFQ, was suggestively associated with the prevalence of hypertension in our study. Also, given that total sugars included several forms of sugars (fructose, sucrose, glucose, maltose and etc), if only specific type of sugars, for example fructose, is a contributing factor for hypertension development, combined sugars could appear to be unrelated to hypertension.
Several cross-sectional and few prospective studies examined the associations of sugar and SSBs in relation to hypertension. Jalal et al. [5] explored the association between intake of fructose, a major type of added sugar, and the prevalence of hypertension among 4,528 adults over aged 18 years who were free of medical history of hypertension in the NHANES 2003-2006 data and found a 77% higher prevalence of stage 2 hypertension among those who consumed 74 g/d or more of fructose compared to those who consumed less than 74 g/d of fructose. Brown et al. [6] analyzed the association between intake of SSBs and diet drinks and blood pressure in a cross-sectional design among 2,696 UK and US adults aged between 40-59 years who participated in the International Study of Macro/Micronutrients and Blood Pressure (INTERMAP), showing that one serving (355 mL) per day increment in intake of SSB was associated with SBP/DBP differences of +1.1/+0.4 mmHg. Long-term and short-term prospective studies also found that high SSB intake increased the risk of hypertension, but reduction in intake lowered blood pressure. In the combined analysis of the Nurses' Health Study I, II, and the Health Professionals' Follow-up Study with maximum follow-up of 38 years, a 13% higher incidence of hypertension was found among participants who drank 1 SSBs or greater per day compared with those who did not consume SSBs [7]. An 18-month behavioral intervention trial among 810 participating in the PREMIER study found that reduction in SSB intake by 1 serving per day (12 fl oz) lowered the SBP and DBP by 1.8 mmHg and 1.1 mmHg, respectively [8].
Previous studies have reported that the intake of SSBs was associated not only with hypertension, but also with other diseases, such as type 2 diabetes [16,21], metabolic syndrome [22] and LDL-cholesterol increase [23]. Furthermore, the excessive intake of SSBs could increase the risk of metabolic diseases not only among adults, but also among children and adolescents. According to the NHANES 2005-2008 analysis, the average intake of sugar drinks was higher among teenagers and young adults in the 20s compared with other age groups. Nearly half of the American population drink SSBs every day. Also, sugar drinks were more highly consumed among individuals with low income than those with high income, and more frequently consumed at home than in restaurants or schools [24]. Wang et al. [25] analyzed 9,882 children and 10,962 adolescents aged between 2-19 years who participated in the NHANES III (1988-1994) and NHANES 1999-2004 survey and showed that the daily caloric intake consumed from SSBs was increased from 204 kcal to 224 kcal and the contribution of SSBs to total caloric intake was increased from 9.8% to 10.7% from 1988-1994 to 1999-2004. In particular, the largest increase was observed among children aged between 6-11 years. Nguyen et al. [26] analyzed the 24-hour dietary recall of 4,867 adolescents aged between 12-18 years who participated in the NHANES 1999-2004 survey and found that intake of SSBs was higher among boys than girls and among adolescents with high levels of serum uric acid and SBP than those with low levels.
Hypertension related to excess SSB intake may be explained by adverse effect of fructose, a major form of added sugars in SSBs, on metabolic profiles. The majority of fructose (60-70%) absorbed in the intestine is transported to the liver [27]. Fructose is phosphorylated by fructokinase using ATP (adenosine triphosphate) to become fructose-1-phosphate. Different from glucose, whose phosphorylation is tightly regulated, excessive phosphorylation of fructose leads to ATP depletion, resulting in reduction in protein synthesis. Activation of adenosine monophosphate (AMP) deaminase generates inosine monophospate (IMP) from AMP and eventually results in uric acid rises in the cell [27,28]. Continuous ingestion of high fructose may induce hyperuricemia, inflammation, generation of oxidative stress, endothelial dysfunction, and reabsorption of sodium and water, all of which are possibly related to hypertension [29].
Limitations of our study include a cross-sectional study design, where we were not able to infer temporal relationships, and the possibility that residual or unmeasured confounding factors could exist. Measurement error in estimating intakes of total sugars and SSBs from 24 hour dietary recalls or FFQs could dilute or attenuate the associations. Also, because FFQ did not ask portion sizes, misclassification of SSB intake could be present.
There are several strengths in this study. We defined hypertensive cases as individuals who were not aware of hypertension when interviewed, but diagnosed with hypertension at the physical examination through direct measurement of blood pressure. Therefore, dietary or behavior change due to hypertension may not explain our findings. Because NHANES has been designed to include the partcipants nationally representative of the US population, our finding can be applied to the general population in the US.
Conclusion
In summary, total sugar intake was not associated with the prevalence of hypertension, however there was suggestion that intake of SSBs was associated with the prevalence of hypertension among US adults. Despite the similar prevalence of hypertension in Korean compared to American and increasing interest in intakes of sugar and SSBs in Korea, only a few Korean studies explored the association between intake of sugar and/or SSBs and risk of hypertension. Given increase in beverage intake and added sugar intake in Korean, our study warrants further prospective studies to elucidate role of sugar and SSBs in development of hypertension in Korean population.
 XML Download