Abstract
Purpose
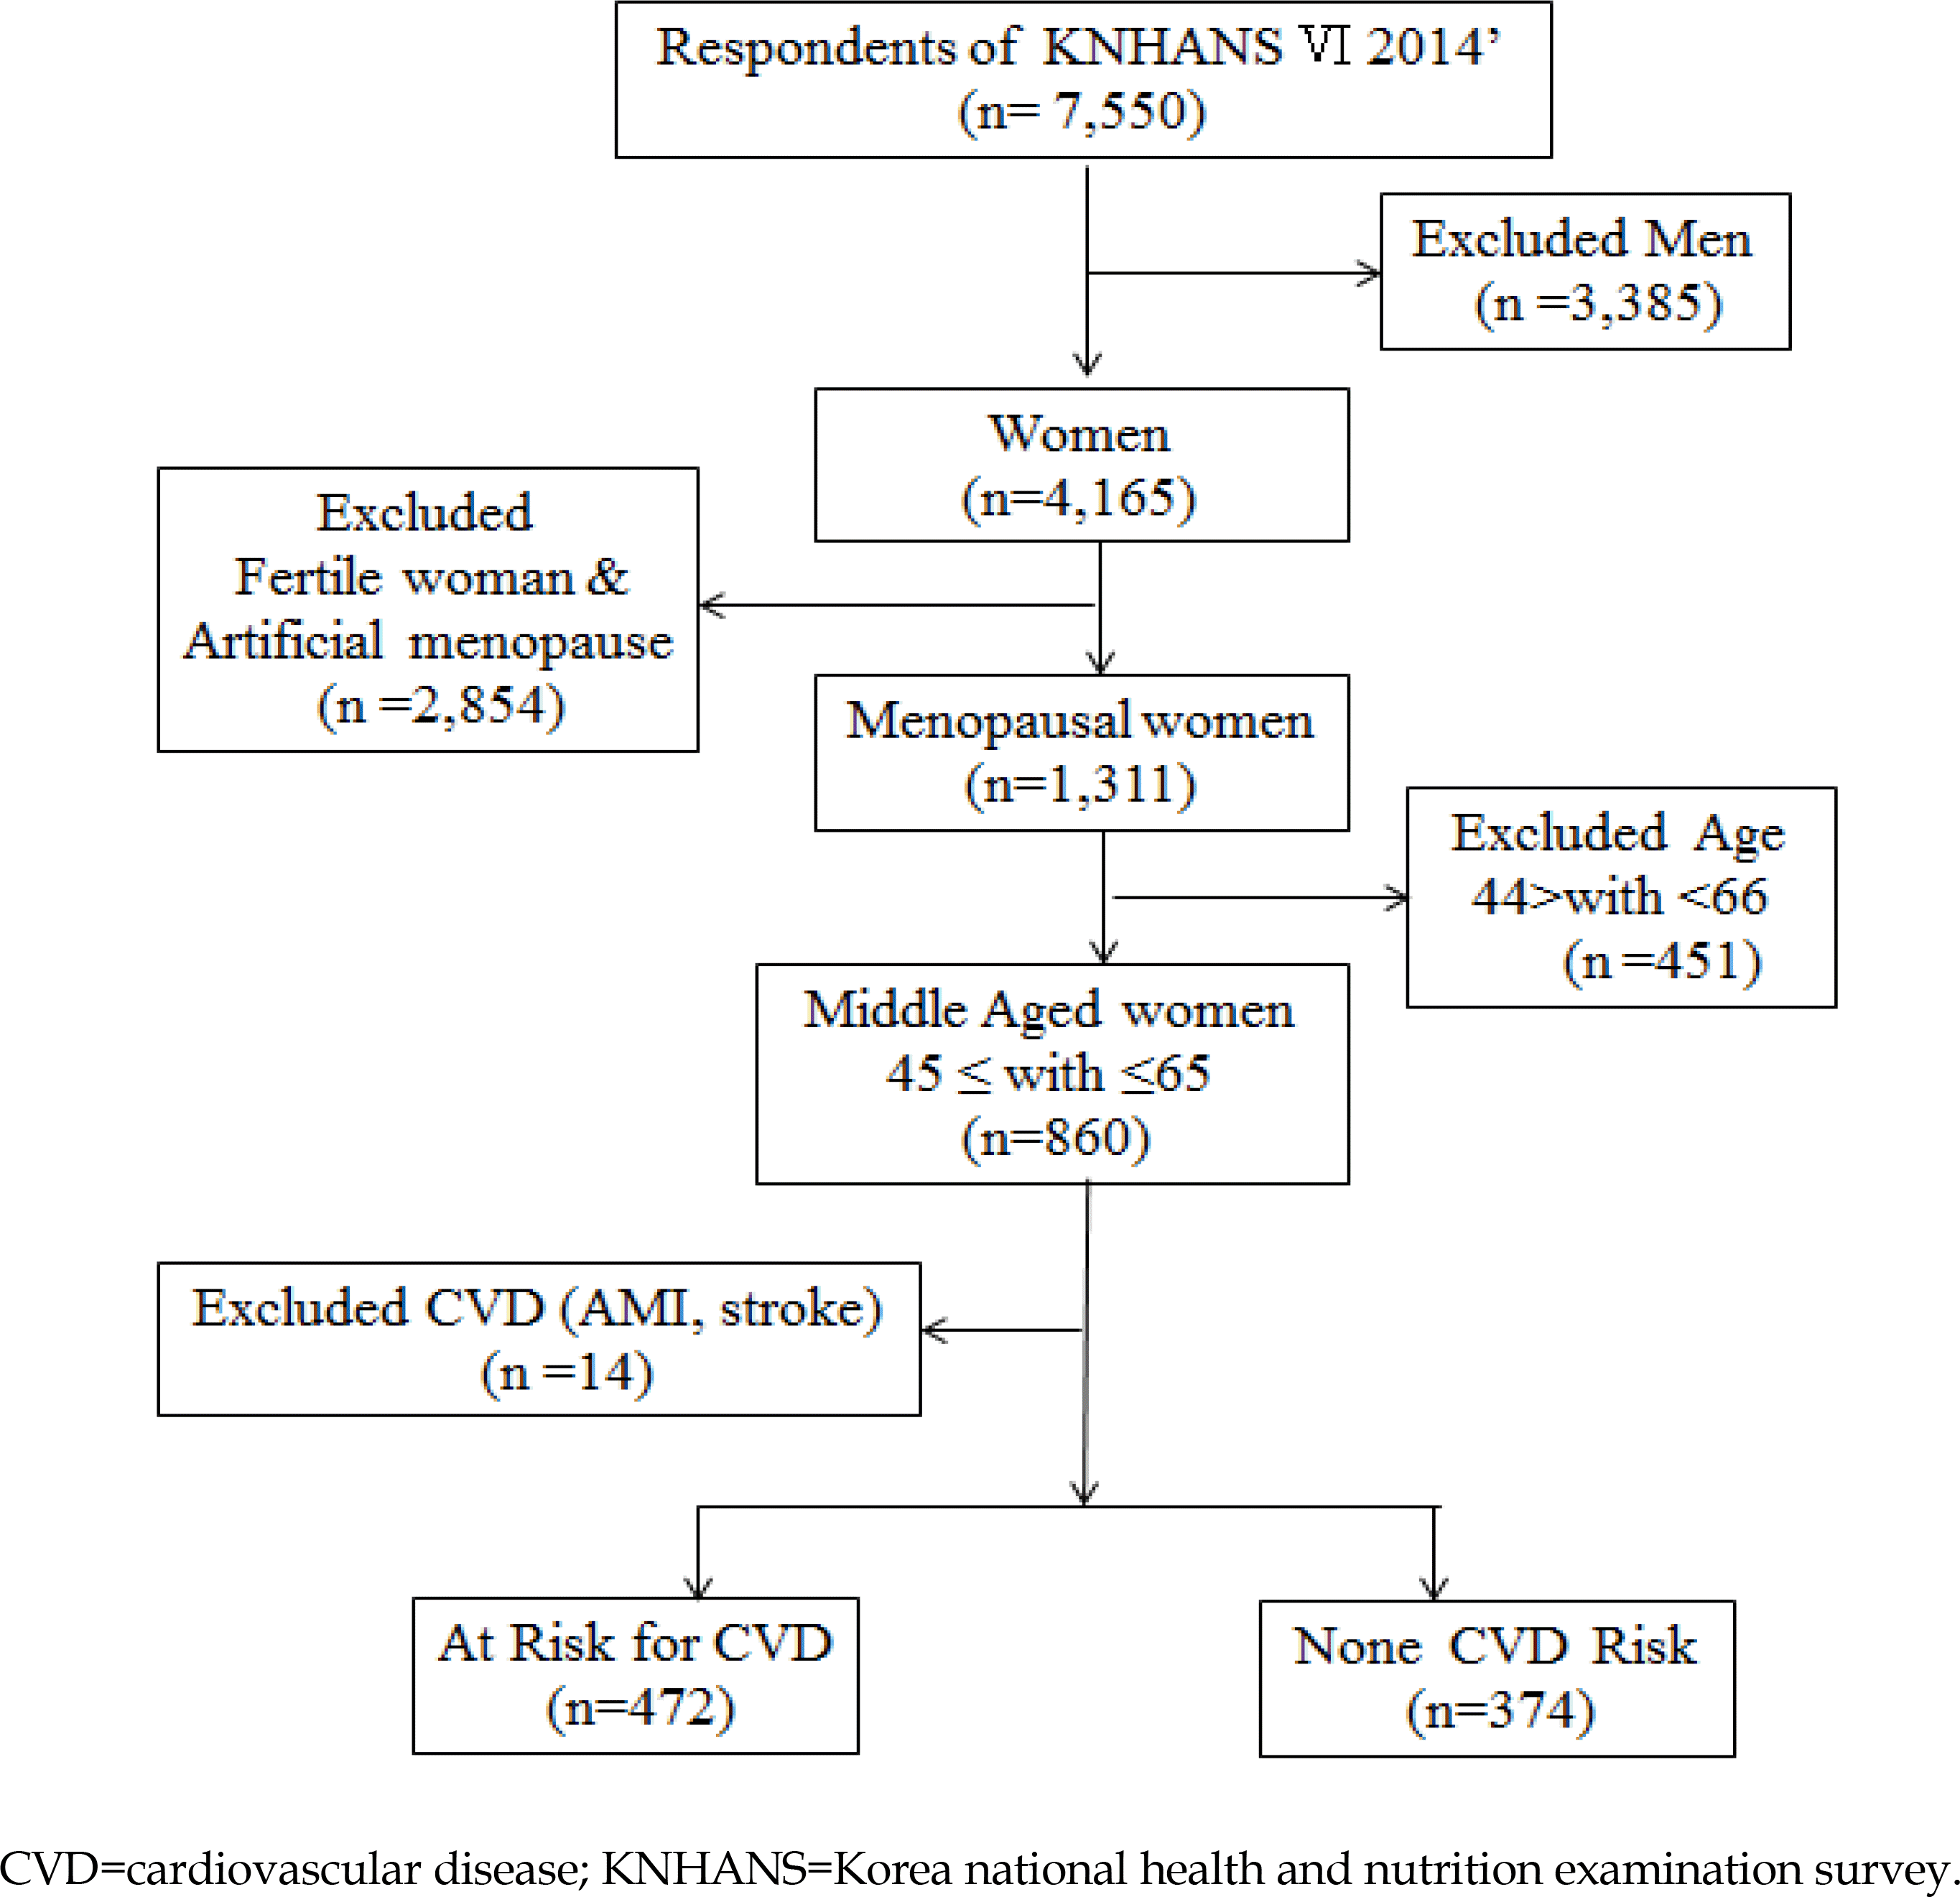
This study was a secondary data analysis using the 6th Korea National Health and Nutritional Examination Survey 2014. The purpose of the study was to identify and compare the impacts of Physical Activity (PA), central obesity and depression on health-related quality of life (HRQoL). The study sample was post-menopausal women aged 45~65 years of aged with or without cardiovascular risk factors. Specifically, the sample consisted of 472 women who had cardiovascular risk factors (risk group) and 374 women with no reported risk factors (no risk group).
Methods
The degree of PA (MET-min/week) was estimated based on the International PA Questionnaire and depression was measured by the Patient Health Questionnaire-9.
Results
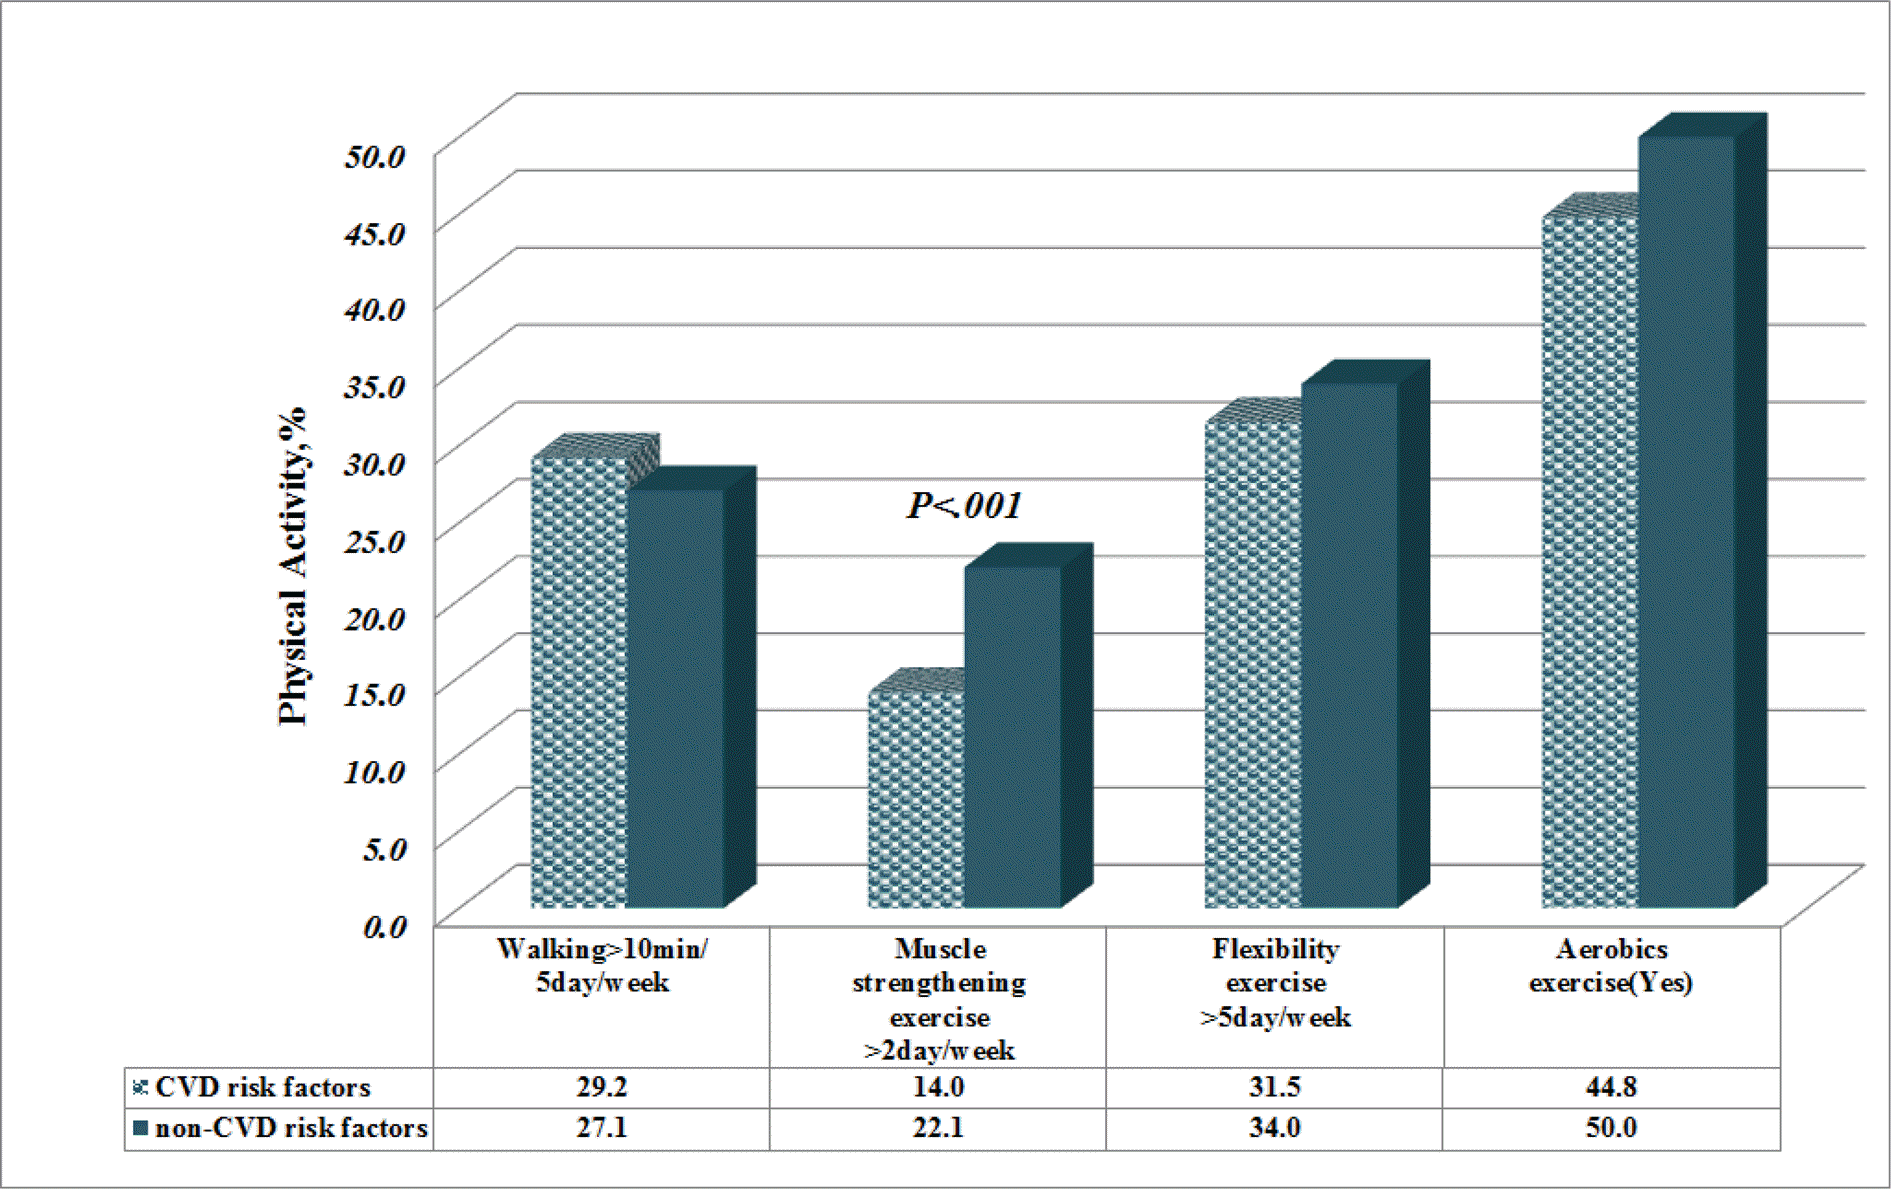
The scores from the PA were lower than the recommended PA scores among both groups, and muscle strengthening was significantly lower within the risk group compared to those in the no risk group (p<.001). Multiple linear regression analyses showed that depression, PA and WHtR accounted for 32.8% of the HRQoL in the risk group (R2=.328, F=64.49, p<.001), while depression and WHtR accounted for 28.5% of the HRQoL in the no risk group (R2=.256, F=35.18, p<.001).
REFERENCES
1. Statistics Korea. The lives of women looking to 2014 statistics [Internet]. Daejeon: Statistics Korea;2016. [cited 2016 June 28]. Available from:. http://kostat.go.kr/wnsearch/search.jsp.
2. Kim YJ, Kwak C. Prevalence and associated risk factors for cardiovascular disease: findings from the 2005, 2007 Korea National Health and Nutrition Examination Survey. Korean Journal of Health Promotion. 2011; 11(3):169–76.
3. Shifren JL, Gass ML, The North American Menopause Society Recommendations for Clinical Care of Midlife Women Working Group. The North American menopause Society recommendations for clinical care of midlife women. Menopause. 2014; 21(10):1038–62. https://doi.org/10.1097/GME.0000000000000319.
4. Van Dijk GM, Kavousi M, Troup J, Franco OH. Health issues for menopausal women: the top 11 conditions have common solutions. Maturitas. 2015; 80(1):24–30. https://doi.org/10.1016/j.maturitas.2014.09.013.

5. Ko HY, Lee JK, Shin JY, Jo E. Health-related quality of life and cardiovascular disease risk in Korean adults. Korean Journal of Family Medicine. 2015; 36(6):349–56. https://doi.org/10.4082/kjfm.2015.36.6.349.

6. Mansikkamäki K, Raitanen J, Malila N, Sarkeala T, Männistö S, Fredman J, et al. Physical activity and menopause-related quality of life-A population-based cross-sectional study. Maturitas. 2015; 80(1):69–74. https://doi.org/10.1016/j.maturitas.2014.09.009.
7. Ock M, Jo MW, Lee SI. Measuring health related quality of life using EQ-5D in South Korea. Journal of the Health Technology Assessment. 2013; 1:103–11.
8. Song HJ, Lee EK, Kwon JW. Gender differences in the impact of obesity on health-related quality of life. Asia-Pacific Journal of Public Health. 2016; 28(2):146–56. https://doi.org/10.1177/1010539515626267.

9. Ekelund U, Ward HA, Norat T, Luan JA, May AM, Weider-pass E, et al. Physical activity and all-cause mortality across levels of overall and abdominal adiposity in European men and women: the European Prospective Investigation into Cancer and Nutrition Study(EPIC). The American Journal of Clinical Nutrition. 2015; 101(3):613–21. https://doi.org/10.1038/sj.bdj.2015.122.
10. Kim JS, Ahn SH. Impact of menopausal status metabolic syndrome and its risk factors on impaired quality of life above middle-aged women. Korean Journal Women Health Nursing. 2016; 22(4):275–86. https://doi.org/10.4069/kjwhn.2016.22.4.275.

11. Lam BCC, Koh GCH, Chen C, Wong MTK. Fallows SJ. Comparison of body mass index (BMI), body adiposity index (BAI), waist circumference (WC), waist-to-hip ratio (WHR) and waist- to-height ratio (WHtR) as predictors of cardiovascular disease risk factors in an adult population in Singapore. PLoS One. 2015; 10(4):e0122985. https://doi.org/10.1371/journal.pone.0122985.
12. Lin CH, Chiang SL, Yates P, Lee MS, Hung YJ, Tzeng WC, et al. Moderate physical activity level as a protective factor against metabolic syndrome in middle aged and older women. Journal of Clinical Nursing. 2015; 24(9-10):1234–45. https://doi.org/10.1111/jocn.12683.
13. Jeon JA. Korean women's mental health indicators. Health and Welfare Forum. 2016; 235:47–60. https://www.kihasa.re.kr/common/filedown.do?seq=35198.
14. Bradley SM, Rumsfeld JS. Depression and cardiovascular disease. Trends in Cardiovascular Medicine. 2015; 25(7):614–22. https://doi.org/10.1016/j.tcm.2015.02.002 .

15. Garcia M, Mulvagh SL, Merz CNB, Buring JE, Manson JE. Cardiovascular disease in women. Circulation Research. 2016; 118(8):1273–93. https://doi.org/10.1161/CIRCRESAHA.116.307547.

16. Chin YR, Lee IS, Lee HY. Effects of hypertension, diabetes, and/or cardiovascular disease on health-related quality of life in elderly Korean individuals: a population-based cross-sectional survey. Asian Nursing Research. 2014; 8(4):267–73. https://doi.org/10.1016/j.anr.2014.10.002.

17. Mynarski W, Rozpara M, Nawrocka A, Borek Z, Powerska A, Garbaciak W. Physical activity of middle-age adults aged 50-65 years in view of health recommendations. European Review of Aging and Physical Activity. 2014; 11(2):141–7. https://doi.org/10.1007/s11556-014-0138-z.
18. Guan X, Sun G, Zheng L, Hu W, Li W, Sun Y. Associations between metabolic risk factors and body mass index, waist circumference, waist-to-height ratio and waist-to-hip ratio in a Chinese rural population. Journal of Diabetes Investigation. 2016; 7(4):601–6. https://doi.org/10.1111/jdi.12442.

19. Vetter ML, Wadden TA, Lavenberg J, Moore RH, Volger S, Perez JL, et al. Relation of health-related quality of life to metabolic syndrome, obesity, depression and comorbid illnesses. International Journal of Obesity. 2011; 35(8):1087–94. https://doi.org/10.1038/ijo.2010.230.

20. Ludt S, Wensing M, Szecsenyi J, Van Lieshout J, Rochon J, Freund T, et al. Predictors of health-related quality of life in patients at risk for cardiovascular disease European primary care. PloS One. 2011; 6(12):e29334. https://doi.org/10.1371/journal.pone.0029334.
21. Garner RE, Feeny DH, Thompson A, Bernier J, McFarland BH, Huguet N, et al. Bodyweight, gender, and quality of life: a pop-ulation-based longitudinal study. Quality of Life Research. 2012; 21(5):813–25. https://doi.org/10.1007/s11136-011-9989-1.

22. Kim MS, Sohn CM. Sarcopenia and sarcopenic obesity and their association with cardiovascular disease risk in postme-nopausal women: results for the 2008-2011 Korea national health and nutrition examination survey. Korean Journal of Community Nutrition. 2016; 21(4):378–85. https://doi.org/10.5720/kjcn.2016.21.4.378.

23. Dankel SJ, Loenneke JP, Loprinzi PD. Determining the importance of meeting muscle-strengthening activity guidelines: is the behavior or the outcome of the behavior (strength) a more important determinant of all-cause mortality? Mayo Clinic Proceedings. 2016; 91(2):166–74. https://doi.org/10.1016/j.mayocp.2015.10.017.
24. Moreira MA, Zunzunegui MV, Vafaei A, da Câmara SM, Oli-veira TS, Maciel ÁC. Sarcopenic obesity and physical performance in middle aged women: a cross-sectional study in Nor-theast Brazil. BMC Public Health. 2016; 16(1):43. https://doi.org/10.1186/s12889-015-2667-4.

25. So ES. Waist circumference and health-related quality of life by sex in the Korean elderly. Journal of Aging and Health. 2014; 26(6):887–99. https://doi.org/10.1177/0898264314531618.

26. McGregor RA, Cameron-Smith D, Poppitt SD. It is not just muscle mass: a review of muscle quality, composition and me-tabolism during ageing as determinants of muscle function and mobility in later life. Longevity & Healthspan. 2014; 3(1):9. https://doi.org/10.1186/2046-2395-3-9.

27. Chew BH, Mohd-Sidik S, Shariff-Ghazali S. Negative effects of diabetes- related distress on health-related quality of life: an evaluation among the adult patients with type 2 diabetes mel-litus in three primary healthcare clinics in Malaysia. Health and Quality of Life Outcomes. 2015; 13(1):187. https://doi.org/10.1186/s12955-015-0384-4.

28. Lee BG, Lee JY, Kim SA, Son DM, Ham OK. Factors associated with self-rated health in metabolic syndrome and relationship between sleep duration and metabolic syndrome risk factors. Journal of Korean Academy Nursing. 2015; 45(3):420–8. https://doi.org/10.4040/jkan.2015.45.3.420.

29. Huxhold O, Miche M, Schüz B. Benefits of having friends in older ages: differential effects of informal social activities on well-being in middle-aged and older adults. The Journals of Gerontology Series B: Psychological Sciences and Social Sciences. 2014; 69(3):366–75. https://doi.org/10.1093/geronb/gbt029.

Figure 2.
Performance rate by type of physical activity according to cardiovascular disease risk factors.

Table 1.
General Characteristics according to Cardiovascular Risk (N=846)
Table 2.
Physical Activity, Central Obesity, Depression, and Quality of Life according to Cardiovascular Risk (N=846)
| Variables | Risk group (n=472) | Non-risk group (n=374) | x2 or t | p |
|---|---|---|---|---|
| n (%) or M± SE | n (%) or M± SE | |||
| PA (MET-min/week) | ||||
| Low (≤599) | 230 (47.0) | 172 (43.9) | 0.53 | .466 |
| Moderate (600~1,499) | 134 (28.0) | 109 (31.6) | ||
| High (≥1,500) | 108 (25.0) | 93 (24.5) | ||
| WHtR | 0.54±0.1 | 0.48±0.1 | 216.14 | <.001 |
| ≥0.52 | 306 (61.7) | 81 (27.9) | 13.90 | <.001 |
| <0.52 | 166 (38.3) | 293 (72.1) | ||
| Systolic blood pressure (mmHg) | 126.2±1.0 | 114.9±1.0 | 69.00 | <.001 |
| Diastolic blood pressure (mmHg) | 77.4±0.6 | 73.3±0.5 | 28.33 | <.001 |
| Total cholesterol (mg/dL) | 194.6±1.9 | 202.2±1.8 | 8.71 | .040 |
| HDL (mg/dL) | 52.6±0.6 | 56.0±0.7 | 16.91 | <.001 |
| LDL (mg/dL) | 122.1±4.6 | 127.4±5.9 | 0.48 | .489 |
| Triglyceride (mg/dL) | 138.8±4.3 | 112.1±4.2 | 20.80 | <.001 |
| Fasting blood sugar (mg/dL) | 105.9±1.3 | 95.1±0.9 | 45.71 | <.001 |
| HbA1c (%) | 6.1±0.1 | 5.7±0.3 | 54.68 | <.001 |
| CVD risk factors† | ||||
| Diabetes | 78 (15.7) | - | - | - |
| Hypertension | 243 (50.3) | - | - | - |
| Dyslipidemia | 173 (33.3) | - | - | - |
| Angina, ESRD | 50 (10.3) | - | - | - |
| BMI (≥25 kg/m2), Smoking | 295 (63.3) | - | - | - |
| Depression (PHQ-9≥10) | 39 (8.6) | 26 (6.6) | 3.88 | .186 |
| 3.3±0.2 | 3.1±0.3 | |||
| EQ-5D score | 0.90±0.1 | 0.94±0.1 | 9.89 | .002 |
| Smoking | ||||
| Current smoker | 22 (5.2) | - | 302.52 | <.001 |
| Ex-smoker or never | 450 (94.8) | 374 (100.0) | ||
| Alcohol drinking | ||||
| Daily | 8 (2.0) | 64 (17.6) | 120.60 | <.001 |
| ≥2/week | 165 (18.0) | 140 (38.2) | ||
| <1/months | 212 (36.1) | 164 (42.4) | ||
| None | 212 (43.8) | 6 (1.8) |
PA=physical activity; PHQ=patient health questionnaire; CVD=cardiovascular disease; WHtR=waist to height ratio; BMI=body mass index; HDL=high-density lipoprotein; LDL=low-density lipoprotein; ESRD=endstage renal disease; MET=metabolic equivalent of task; SE=standard error; n=unweighted count; %=weighted count; EQ-5D score=EuroQol five dimensions questionnaire;
Table 3.
Predicting Factors on Quality of Life in Groups with or without Cardiovascular Risk (N=846)


 PDF
PDF ePub
ePub Citation
 Print
Print


 XML Download