Abstract
We investigated that the relationship between body fat content and maximal muscle strength when skeletal muscle mass was matched. Muscle mass was measured from 140 preliminary selected people, and 30 males were finally selected and divided into one of four experimental groups: low body fat (group 1, ≤11.9%), low-moderate fat (group 2, 12.0%−16.9%), moderate-high fat (group 3, 17.0%−22.9%), high fat (group 4, ≥23.0%). All subjects undertook one repetition maximum (1RM) test of abdominal and back upper body's and lower body's, and bench press, squat, and back strength dynamometer was used. Repeated oneway analysis of variance and Tukey's post-hoc test was adopted to specify mean differences among groups. Statistical significance level was set at α=0.05. 1RM of bench press was not different among groups (p>0.05) even though values from group 2 was marginally higher (15.9%) than group 1 values (p=0.091). 1RM of squat was higher in group 4 compared to group 2 and group 3 (p<0.05), and maximal back muscular strength was higher in group 1 and group 3 than group 2 (p<0.05). However, total 1RM values, sum of 1RM obtained from different exercises, did not reveal any statistical differences. No notable correlation was found between percent body fat (%BF) and maximal muscular strength. Interestingly, negative correlation of muscular strength was observed between %BF and relative (per kilogram) body mass (p<0.001), but not with between %BF and relative skeletal muscle mass. Therefore, it was concluded that maximal muscular strength is influenced not by fat mass but by skeletal muscle mass.
References
1. Kim YM, Cho DG, Kang SH. Analysis of factors associated with geographic variations in the prevalence of adult obesity using decision tree. Health Soc Sci. 2014; 36:157–81.
2. Simova I, Denchev S. Endothelial functional and structural impairment in patients with different degrees of coronary artery disease development. Heart Vessels. 2008; 23:308–15.

3. Yoon DH, Park JH, Lee CM, Shin CS, Cho SH, Oh BH. The relationship between obesity and depression in Korean women. Korean J Psychosom Med. 2007; 15:51–5.
4. Choi JW, Kang SG, Kim YS. Physiological and psychological benefits of exercise participation in an obese adolescent. Korean J Phys Edu. 2000; 39:349–61.
5. Kim HN, Han SN. Psychological characteristics of obese adult participants in the weight management program. J Korean Soc Study Obes. 2014; 23:281–8.

6. Dengel DR, Hagberg JM, Coon PJ, Drinkwater DT, Goldberg AP. Effects of weight loss by diet alone or combined with aerobic exercise on body composition in older obese men. Metabolism. 1994; 43:867–71.

7. Martin WH 3rd. Effects of acute and chronic exercise on fat metabolism. Exerc Sport Sci Rev. 1996; 24:203–31.
8. Braith RW, Stewart KJ. Resistance exercise training: its role in the prevention of cardiovascular disease. Circulation. 2006; 113:2642–50.
9. Stevens VK, Parlevliet TG, Coorevits PL, et al. The effect of increasing resistance on trunk muscle activity during extension and flexion exercises on training devices. J Electromyogr Kinesiol. 2008; 18:434–45.

10. Lee MG, Sung SC, Lee SE, Jung WS. Effects of 12 weeks of resistance exercise training on resting metabolic rate (RMR), and adipocytokines in obese men of 20s. Exerc Sci. 2011; 20:405–16.
11. Lee SI, Lim SG. Prediction of one repetition maximum from isokinetic test. Korea Sport Res. 2004; 15:1965–77.
12. Suh SH, Park SY, Kim KB. One repetition maximum by circumference of muscles in weight training beginners. Korean J Meas Eval Phys Educ Sports Sci. 2008; 10:57–68.
13. Visser M, Deeg DJ, Lips P, Harris TB, Bouter LM. Skeletal muscle mass and muscle strength in relation to lower-extremity performance in older men and women. J Am Geriatr Soc. 2000; 48:381–6.

14. Newman AB, Haggerty CL, Goodpaster B, et al. Strength and muscle quality in a well-functioning cohort of older adults: the Health, Aging and Body Composition Study. J Am Geriatr Soc. 2003; 51:323–30.

15. Choi HG, Cho JH, Kim MJ, et al. Relationship between percent body fat and health-related fitness in college females. Korean J Phys Edu. 2003; 42:801–7.
16. Lue YJ, Chang JJ, Chen HM, Lin RF, Chen SS. Knee isokinetic strength and body fat analysis in university students. Kaohsiung J Med Sci. 2000; 16:517–24.
17. Kim MO, Kim SH, Hur SH, Lee JS. Influences of percent body fat and body mass index difference on one repetition maximum in different gender of untrained young adults. J Coach Dev. 2016; 18:145–53.
18. Earle RW. Weight training exercise prescription. National Strength and Conditioning Association, editor. Essentials of personal training symposium workbook. Lincoln (NE): NSCA Certification Commission;1999. p. 305.
19. Fleck SJ, Kraemer WJ. Designing resistance training programs. 2nd ed.Champaign: Human Kinetics;1997.
20. Hur SH, Koo JM, Lee JS, editors. Percent body mass can be determination of initial load during 1 RM measurement. Proceedings of 2015 Spring Academic Conference of Society of Physical Education of Daegu-Gyeongbuk; 2015 May 1; The Society of Physical Education of Daegu-Gyeongbuk. Daegu:;2015.
21. Choi YT, Seong NK. The body composition and physical fitness according to body type by BMI of the male/female high school student. Korea Sport Res. 2006; 17:103–12.
22. Kim NS, Kim TW, Sung SC, Kim SH. Accuracy of 1RM prediction equations from 7–10RM in hand ball players. Korea J Sports Sci. 2011; 20:1151–61.
23. Kim JS, Park JK, Jang SA. Effects of percent body fat and leg muscle mass on isokinetic and isometric strength of knee strength. Korean J Exerc Rehabil. 2008; 4:93–100.
24. Kang TW, Heo J. Comparison of physical fitness according on the levels %fat and BMI in boy's elementary school students. Korean J Growth Dev. 2008; 16:271–7.
25. Lee DK, An KO. Difference in body composition ratio, basal metabolic rate, and physical fitness level based on the percentage body fat on female freshmen in a university of education. Korean J Elem Edu. 2013; 24:1–13.
26. Park SJ, Choi KJ, Song HS, Kim KJ, Sung BJ, So WY. Association between percent body fat and physical fitness in Korean men: a community-based study. Korea J Sports Sci. 2012; 21:1305–14.
27. Byun J, Kim K. Comparison of body composition, blood lipid profiles, HOMA, and physical fitness according to BMI in elementary school boys. Korean J Growth Dev. 2012; 20:67–73.
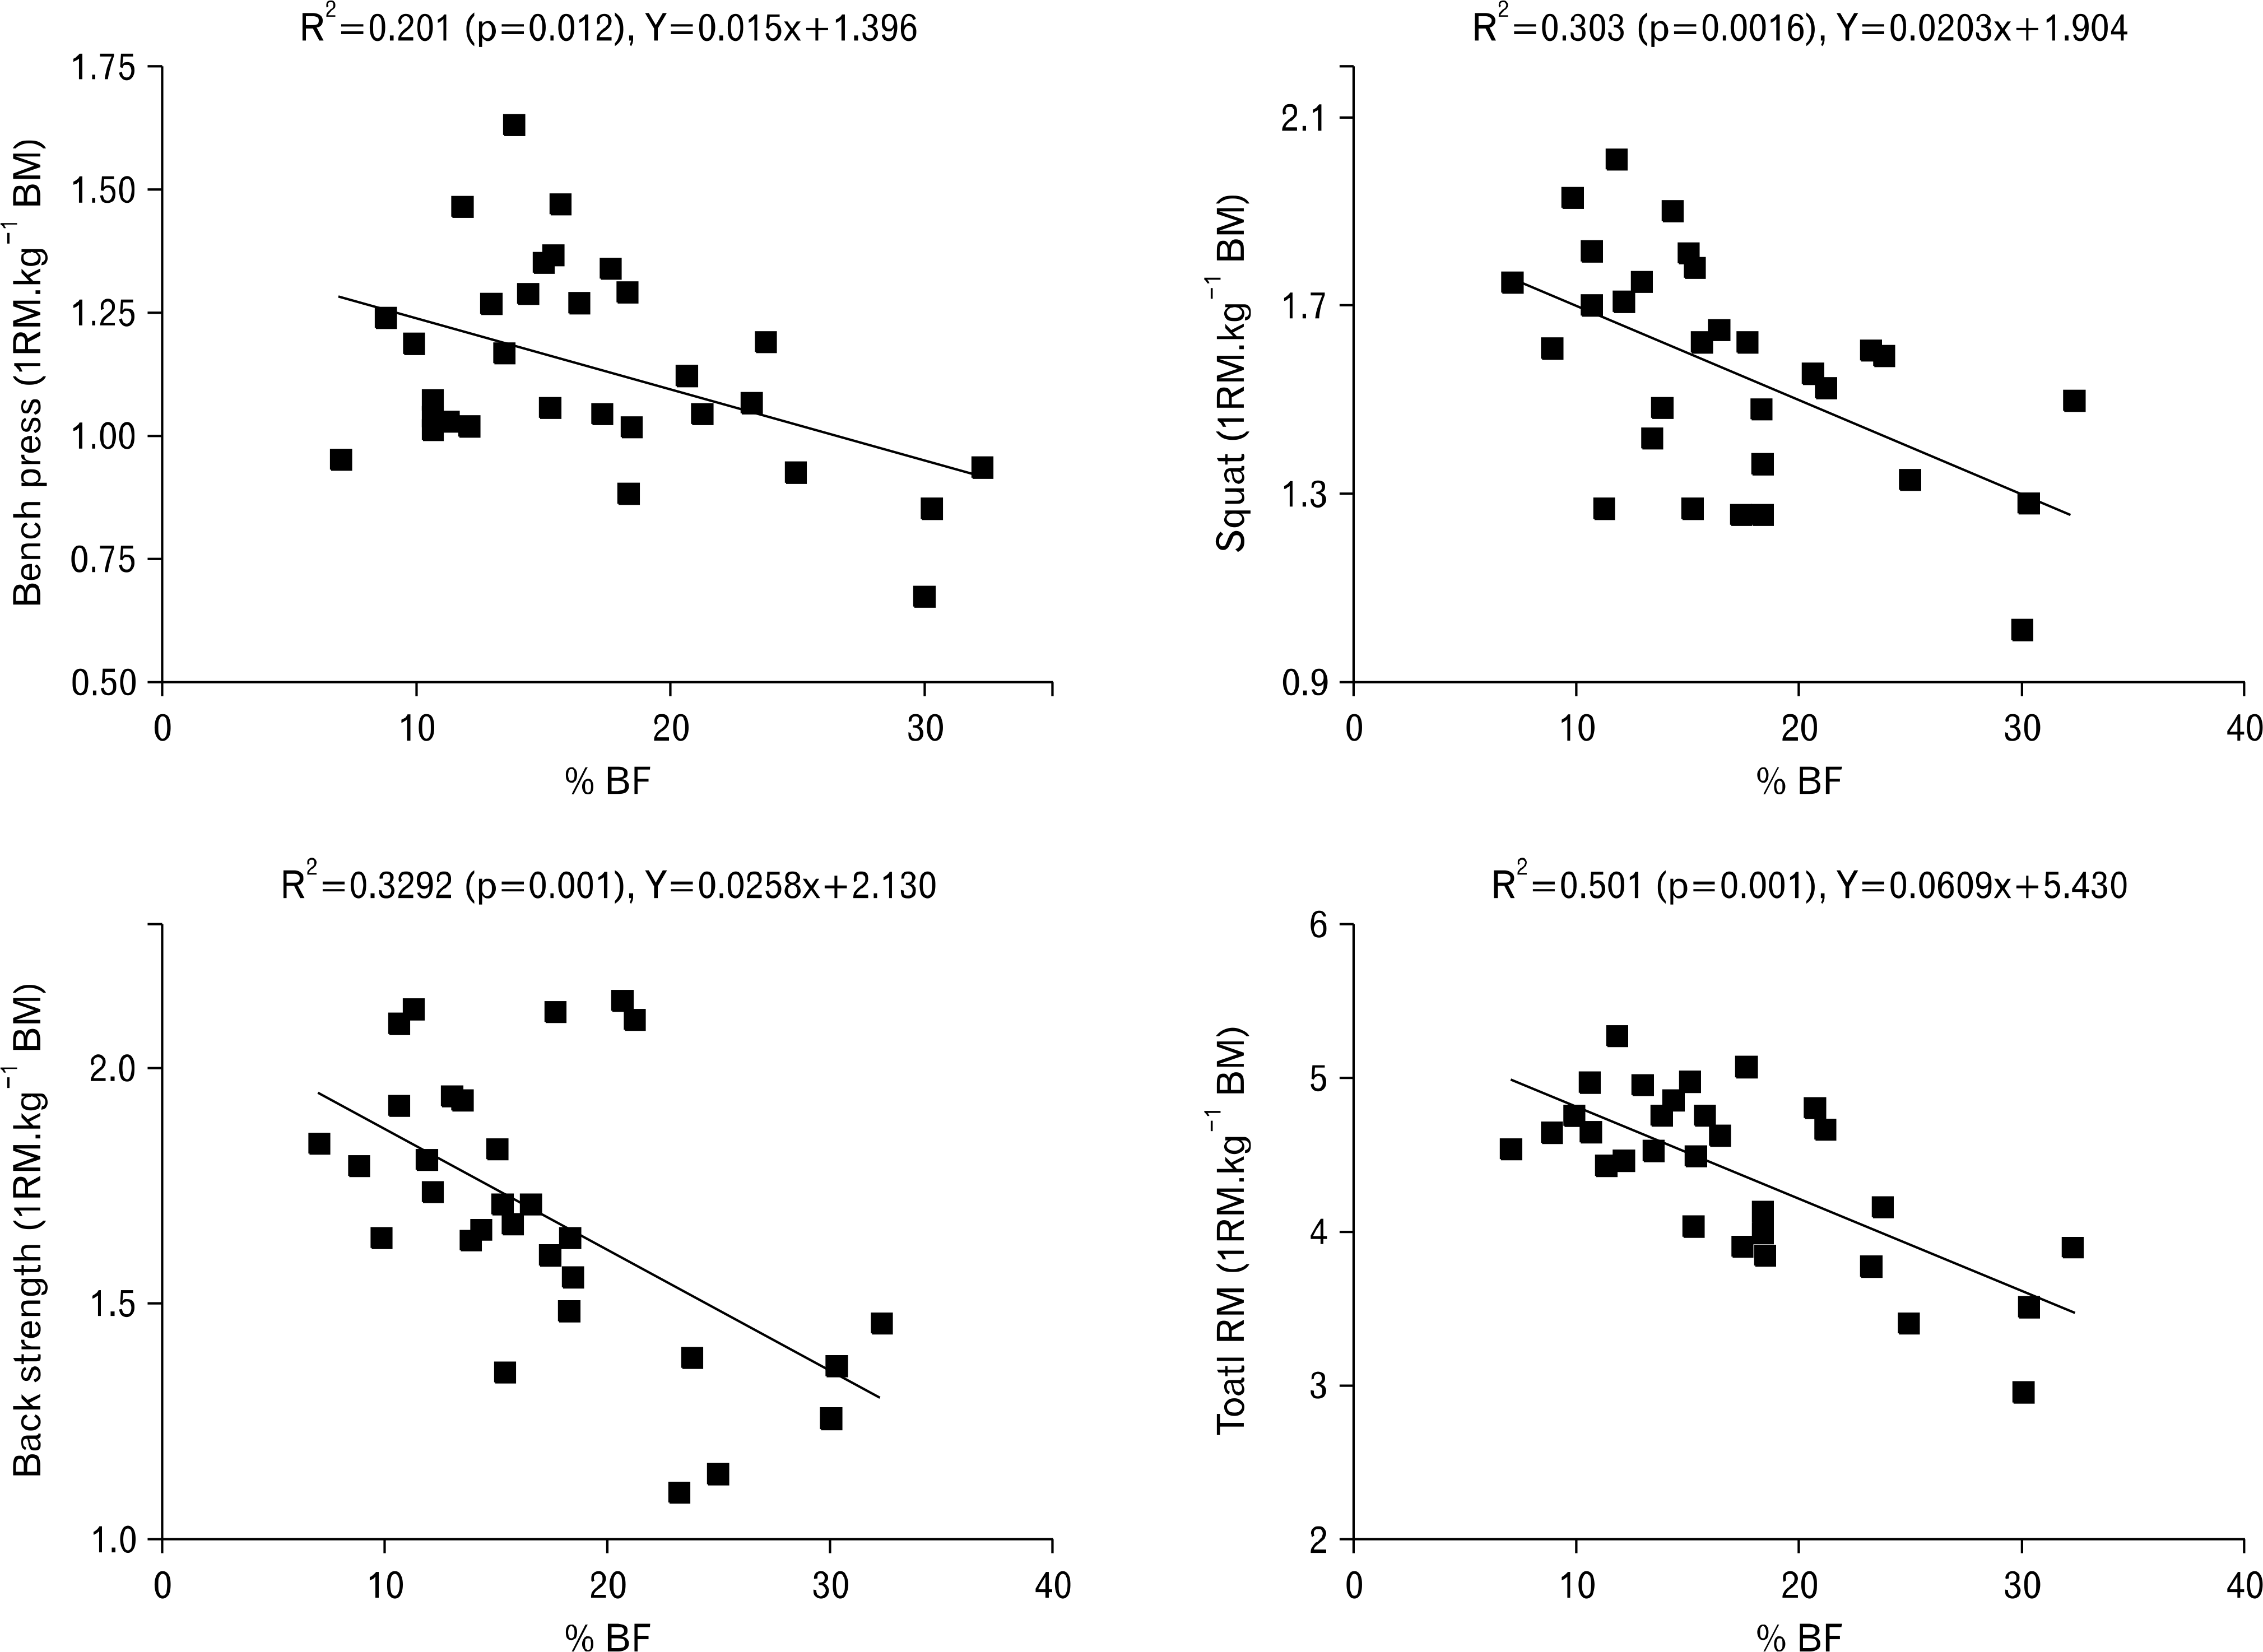
Fig. 3.
Correlation between one repetition maximum (1RM) and kilogram of body mass. BM, body mass; %BF, percent body fat.

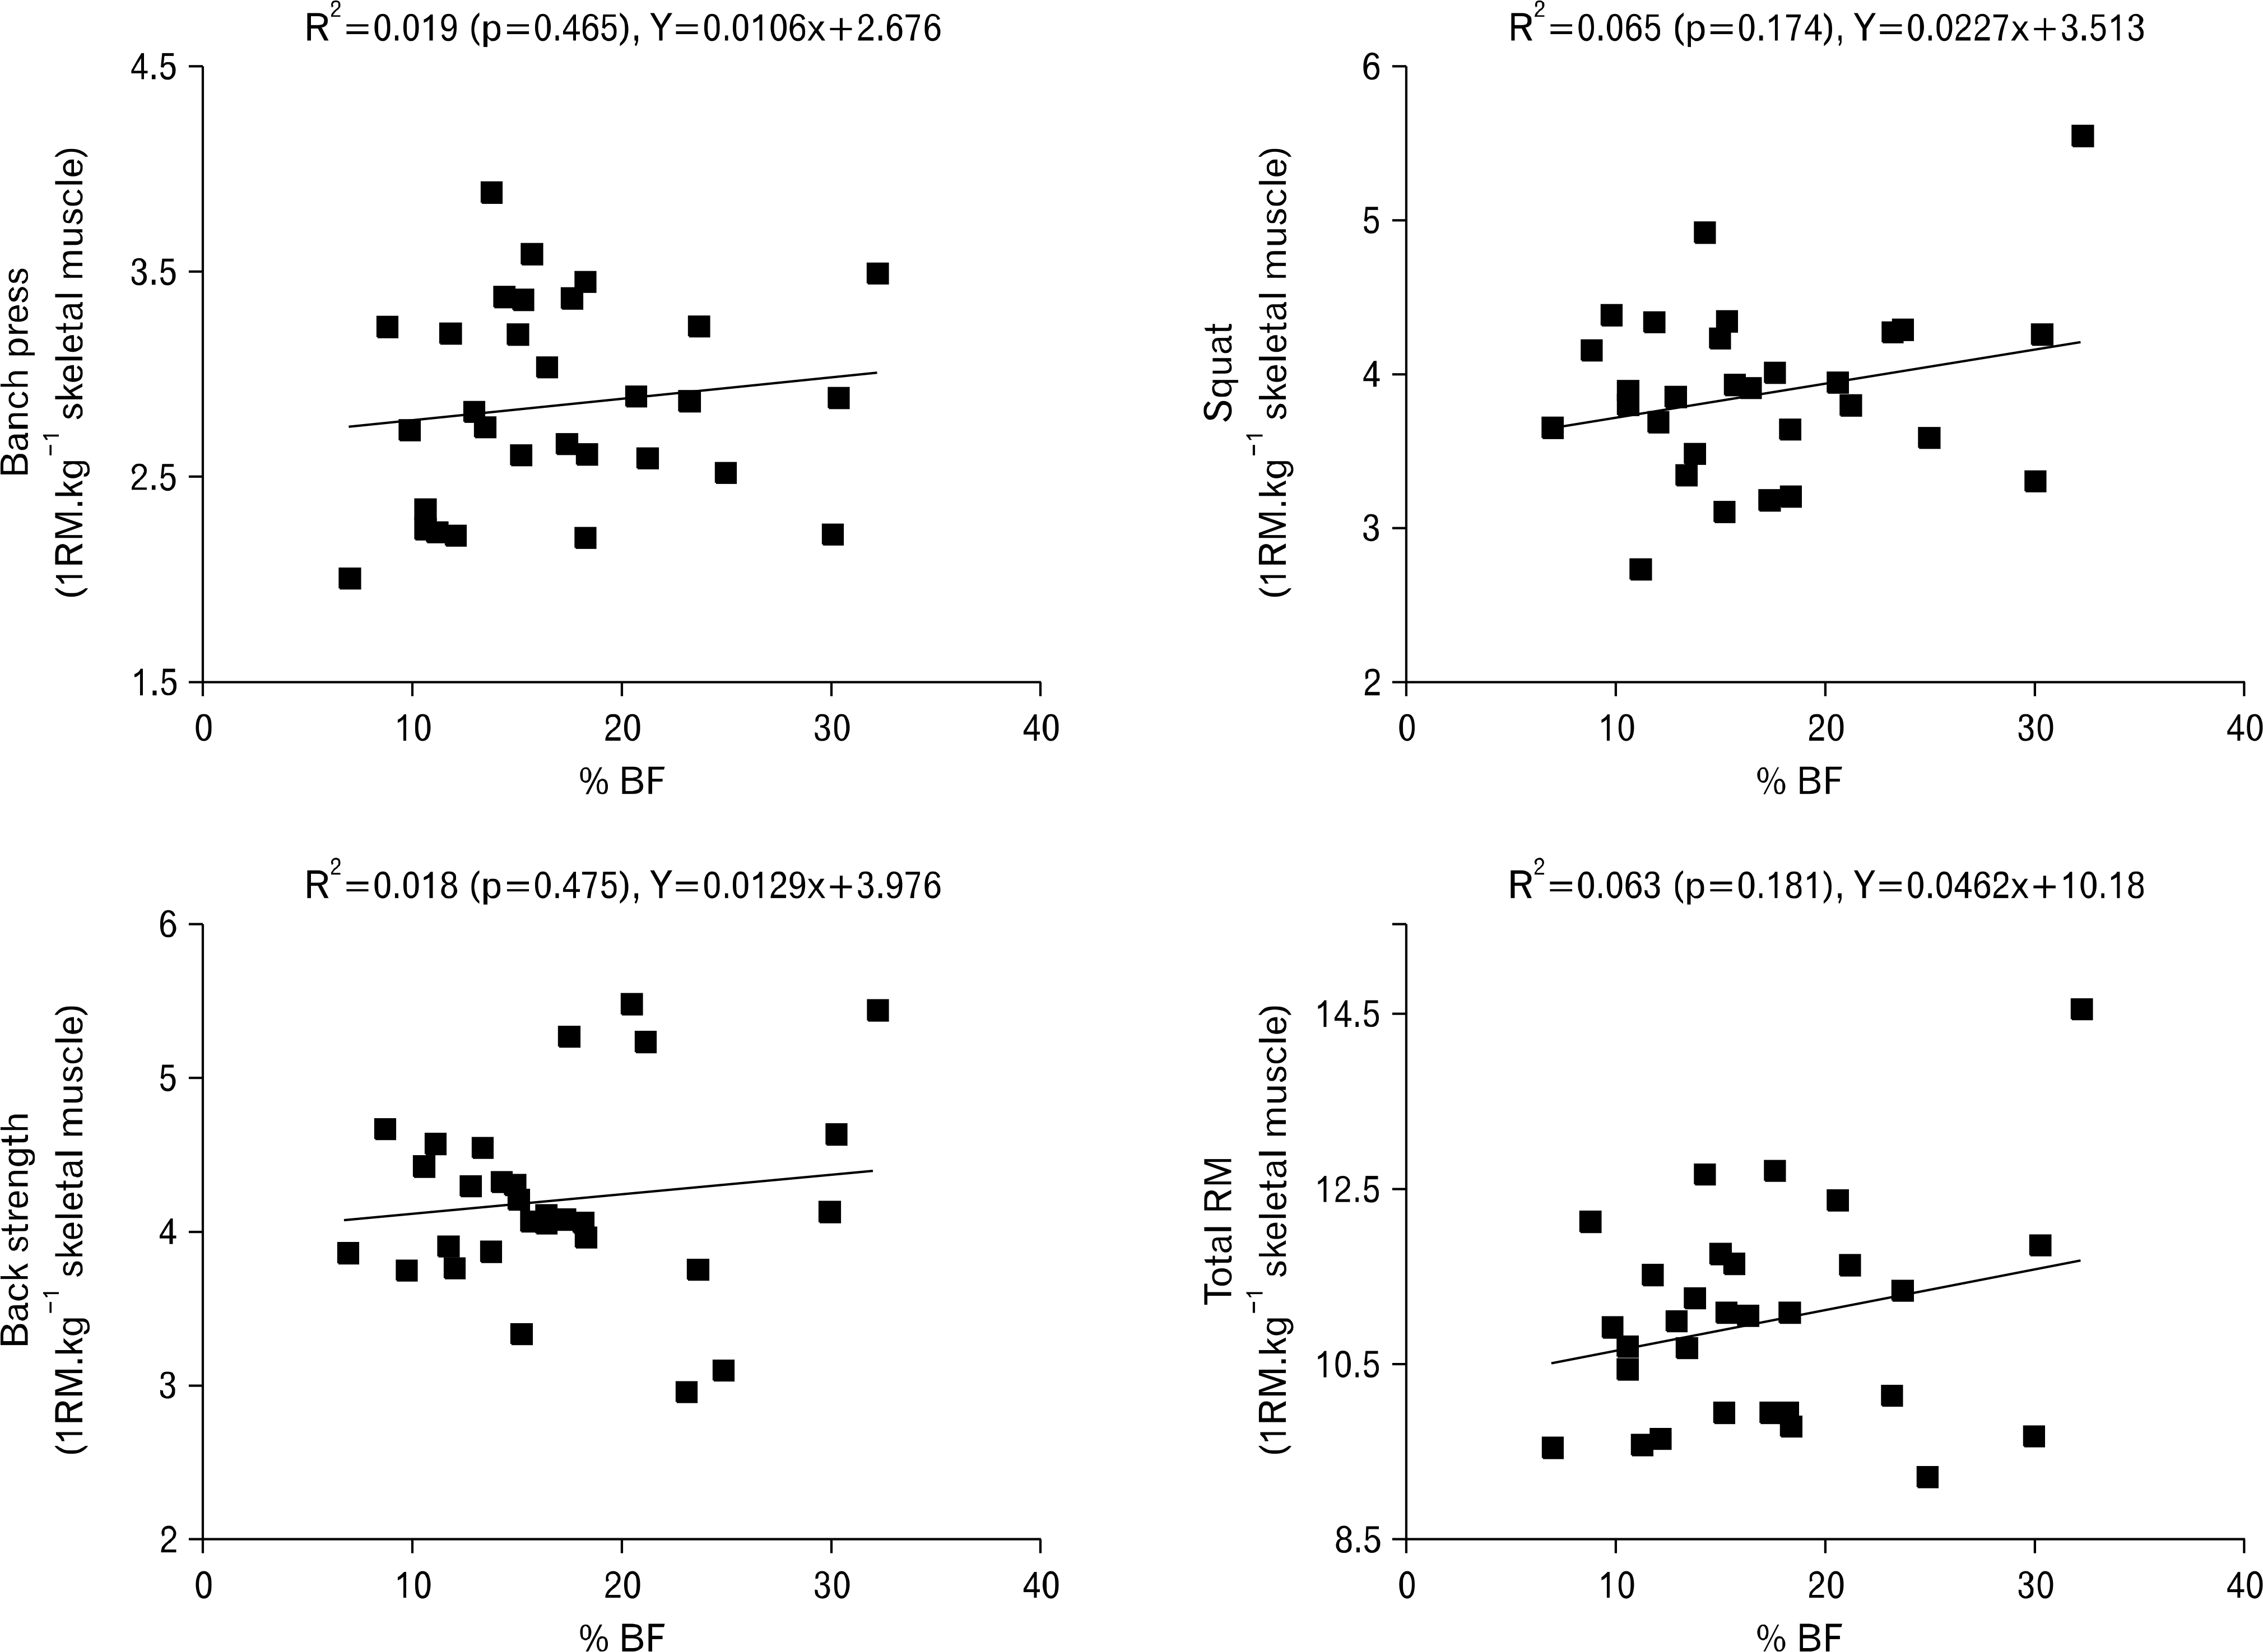
Fig. 4.
Correlation between one repetition maximum (1RM) and kilogram of skeletal muscle mass. %BF, percent body fat.

Table 1.
Physical characteristics of subjects
Table 2.
One repetition maximum values obtained from bench press test
| %Body fat | Value (kg) |
|---|---|
| ≤11.9% | 72.9±13.8 |
| 12.0%−16.9% | 84.5±13.6 |
| 17.0%−22.9% | 78.6±14.6 |
| ≥23.0% | 80.0±14.1 |
Table 3.
One repetition maximum values obtained from squat test
| %Body fat | Value (kg) |
|---|---|
| ≤11.9% | 110.0±17.3 |
| 12.0%−16.9% | 107.0±15.5∗ |
| 17.0%−22.9% | 101.4±13.5∗ |
| ≥23.0% | 118.3±24.0 |
Table 4.
One repetition maximum values obtained from back strength test
| %Body fat | Value (kg) |
|---|---|
| ≤11.9% | 120.0±8.38∗ |
| 12.0%−16.9% | 111.7±8.98 |
| 17.0%−22.9% | 127.9±24.67∗ |
| ≥23.0% | 111.7±27.67 |
Table 5.
One repetition maximum values obtained from the sum of bench press, squat, and back strength test
| %Body fat | Value (kg) |
|---|---|
| ≤11.9% | 302.9±25.10 |
| 12.0%−16.9% | 303.2±24.48 |
| 17.0%−22.9% | 307.9±46.59 |
| ≥23.0% | 310.0±59.32 |
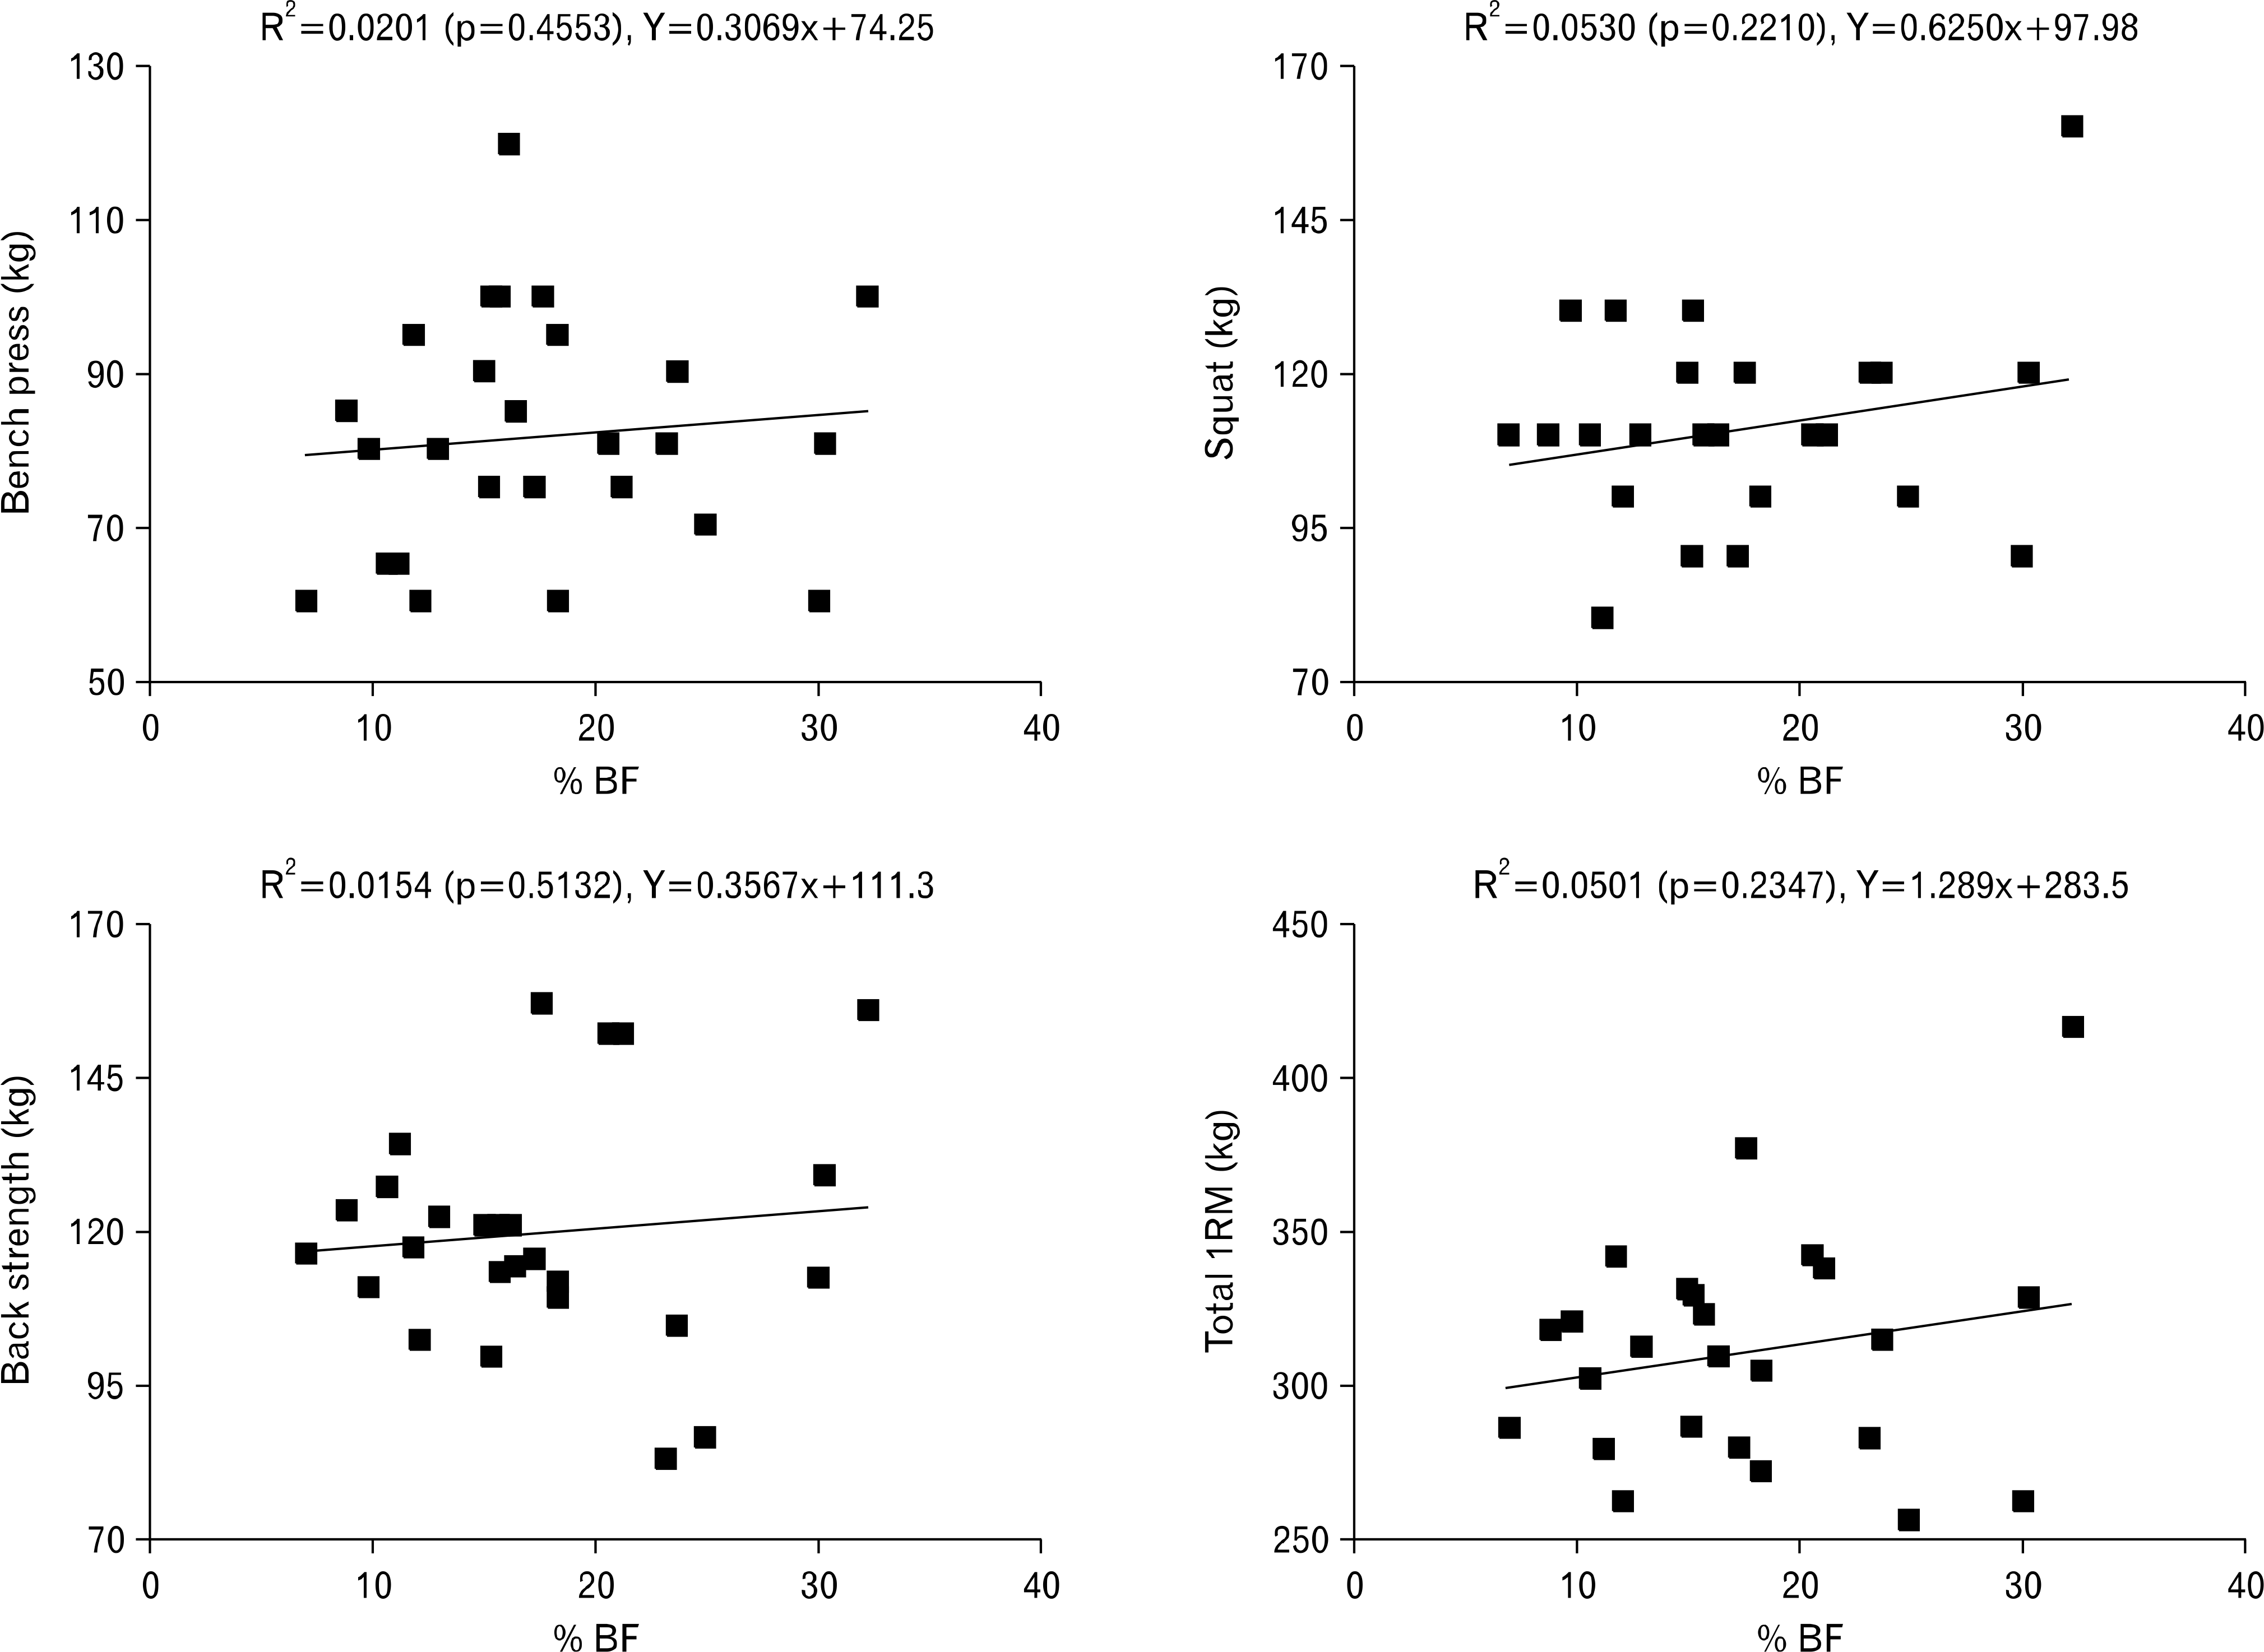
Table 6.
Relationship between one RM and percent body fat
| Bench press | Squat | Back strength | Total RM | |
|---|---|---|---|---|
| R2 value | 0.0201 | 0.0530 | 0.0154 | 0.0501 |
| Regression equation | Y=0.3069x+74.25 | Y=0.6250x+97.98 | Y=0.3567x+111.3 | Y=1.289x+283.5 |
Table 7.
Relationship between one RM and kilogram of body mass
| Variable | Bench press | Squat | Back strength | Total RM |
|---|---|---|---|---|
| R2 value | 0.201 | 0.303 | 0.3292 | 0.501 |
| Regression equation | Y=−0.015x+1.396 | Y=−0.0203x+1.904 | Y=−0.0258x+2.130 | Y=−0.0609x+5.430 |


 PDF
PDF ePub
ePub Citation
 Print
Print


 XML Download