

 PDF
PDF ePub
ePub Citation
 Print
Print


Abstract
Objectives
Methods
Results
Figures and Tables
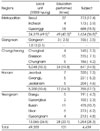
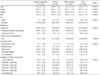
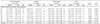
Table 3
Perception of environmental factors related to salt reduction and experience of low sodium product
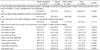
Table 4
The change of positive outcome expectation of reducing sodium intake
1) P value from chi-square test by subject group in each category at the baseline
2) P value from chi-square test by subject group in each category after nutrition education
3) Q1: Decrease of blood pressure, Q2: Prevention to stroke and heart diseases, Q3: Weight loss, Q4: Reduction of swelling in body, Q5: Skin enhancement, Q6: Prevention to osteoporosis, Q7: Prevention to cancer
4) N (%): The response number and rate of 'yes' in each item.
5) P value from chi-square test in each item of same subject group (*: p < 0.05, **: p < 0.01, ***: p < 0.001)
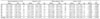
Table 5
The change of negative barriers to practice reducing sodium intake
1) P-value from ANCOVA adjusted by age, sex, height and weight among subject group in each category at the baseline
2) P-value from ANCOVA adjusted by age, sex, height and weight among subject group in each category after nutrition education
3) Q1:Bad taste, Q2:Hard to prepare and cook, Q3:Limitation to choose food, menu and restaurant, Q4:Limited information, knowledge and skills to practice Q5:Interference with to social relationship when dining with family and friends, Q6:Preference to broth dishes (soup, stew), Q7:Preference to Kimchi, salted fish, fermented sauces
4) Mean±SD, Mean values with different superscripts are significantly different among the groups at baseline(before) at α=0.05 as determined by Duncan's multiple range test The lower score means less barriers to practice reducing sodium intake (1=very hard to agree, 2=hard to agree, 3=agree a little, 4=agree, 5=agree a lot)
5) P from paired t-test in each subject group (*: p < 0.05, **: p < 0.01, ***: p < 0.001)
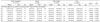
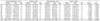
Table 6
The change of subjects' perceptions and self-efficacy related to reducing sodium intake
1) P-value from ANCOVA adjusted by age, sex, height and weight among subject group in each category at the baseline
2) P-value from ANCOVA adjusted by age, sex, height and weight among subject group in each category after nutrition education
3) Q1:I feel unfulfilled or unsatisfied when eating foods with less salt, Q2:I usually recognize the sodium contents in food or dish, Q3:Practicing low-sodium diet will improve my health status, Q4:I will buy fresh food rather than processed or instant food, Q5:I will request less salty when eating-out, Q6:I will choose dishes with native flavor and taste rather than hot, salty, spicy one, Q7:I will have concern for low-sodium recipe. Q8:I think that influence of consumers' sodium reduction can induce the change of social surroundings.
4) Mean±SD. Mean values with different superscripts and subscripts are significantly different among the groups at baseline (before) and after nutrition education, respectively, at α=0.05 as determined by Duncan's multiple range test. The higher score means better perceptions and self-efficacy (1=very hard to agree, 2=hard to agree, 3=agree a little, 4=agree, 5=agree a lot. The 1'st question was coded conversely)
5) P from paired t-test in each subject group (*: p < 0.05, **: p < 0.01, ***: p < 0.001)
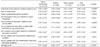
Table 7
The change of subjects' knowledge for behavioral capability to reduce sodium intake
1) P-value from chi-square test by subject group in each category at the baseline
2) P value from chi-square test by subject group in each category after nutrition education
3) Q1:Excess intake of sodium can increase the risk of osteoporosis, Q2:The amount of sodium and the amount of salt are the same in the same food, Q3:Two tablespoons of salt are the goal intake of salt in a day, Q4:Sodium is necessary to keep the balance and equilibrium of body fluids, Q5:Sodium exists in various food additives such as baking powder and preservatives, Q6:Sufficient intake of vegetables and fruits helps with sodium excretion, Q7:For nutrition labeling, salt content is indicated in the labeling, Q8:Grilled fish with sauce has much more salt than grilled fish itself, Q9:One tablespoon of salt has the same amount of sodium as one tablespoon of soybean paste (miso), Q10:The amount of sodium in the noodle itself is more than that in the broth of Ramen
4) N (%) : the number and rate of correct answer.
5) P value from chi-square test in each item of same subject group (*: p < 0.05, **: p < 0.01, ***: p < 0.001)
6) Mean±SD : Sum of correct answers out of ten items. Mean values with different superscripts and subscripts are significantly different among the groups at baseline(before) and after nutrition education, respectively, at α=0.05 as determined by Duncan's multiple range test.
Table 8
The evaluation results of education according to target group
1) Mean±SD. Mean values with different subscripts are significantly different among the groups at α=0.05 as determined by Duncan's multiple range test. The higher score means agreement to the questions (1=very hard to agree, 2=hard to agree, 3=agree a little, 4=agree, 5=agree a lot)
2) P-value from ANCOVA adjusted by age, sex, height and weight among subject group in each category
 XML Download