

 PDF
PDF ePub
ePub Citation
 Print
Print


Abstract
Objectives
This study was carried out to determine nutritional status of elderly patients in a long-term care hospital according to meal type and eating ability.
Methods
Subjects were 47 female patients aged over 65 (79.3 ± 7.1 years) who resided in a long-term care hospital in Seoul. Thirty seven patients who ate diet orally were grouped according to meal type (27 general diet and 10 soft diet) and eating ability (26 eating by oneself and 11 eaten with help) and 10 were on tube feeding. Nutritional status was determined by food consumption and mid-arm circumference.
Results
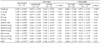
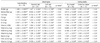
The mean adequacy ratios (MARs) of 12 nutrients (protein, calcium, phosphorus, zinc, vitamin A, vitamin B1, vitamin B2, vitamin B6, niacin, folic acid, vitamin C) were 0.687 for general diet, 0.565 for soft diet, 0.680 for eating by oneself and 0.677 for eaten with help, which were significantly lower than 0.982 for tube feeding (p < 0.05 or p < 0.01). The patients on tube feeding had significantly lower % arm circumference compared to those who ate general diet (84.0% vs. 95.4%, respectively, p < 0.05). Nutrients intakes, nutrient adequacy ratio (NAR) and index of nutritional quality (INQ) were not different between meal types as well as eating ability. The most insufficiently consumed nutrients by the patients on diet were folic acid, vitamin B2, and calcium (NAR 0.334~0.453, 0.515~0.539, and 0.516~0.533, respectively).
Conclusions
The results suggested that regardless of meal type or eating ability, the subjects who were on diets in this study might have inadequate intake of folic acid as well as vitamin B2, and calcium, which need to be reflected on menu planning. The measurement of mid-arm circumference presented more risk of malnutrition of patients on tube feeding than those on diets, despite apparently better nutrient consumption.
Figures and Tables
Table 1
General characteristics of elderly female patients in long-term care hospital according to meal types.
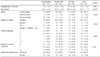
Table 2
Health-related factors of elderly female patients in long-term care hospital according to meal types and eating ability
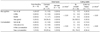
Table 3
Factors affecting eating of elderly female patients in long-term care hospital according to meal types and eating ability
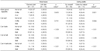
Table 4
Arm circumferences of elderly female patients in long-term care hospital according to meal types and eating ability
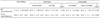
Table 5
Nutrition intakes of elderly female patients in long-term care hospital according to meal types and eating ability
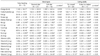
Table 6
Nutrition adequacy ratio of elderly female patients in long-term care hospital according to meal types and eating ability
1) p value between meal types (tube feeding, general diet, soft diet)
2) p value between eating ability (tube feeding, by oneself, eaten by helper)
3) Mean ± SD
4) MAR: Mean Nutrient Adequacy Ratios (sum of NAR/12)
ab/AB: Means with different superscripts are significantly different from each other at α = 0.05 by Duncan's multiple range test.
References
1. Ahn HJ. The nutritional intake of elderly patients in long-term car hospital according to meal types and eating dependency. Daejjin University;2014. 39–40. MS thesis.
2. Baik HW. Focus on nutritional assessment and nutritional support of the elderly. Korean J Med. 2010; 79(2):S517–S518.
3. Baik HW. Management and treatment of malnutrition in the elderly. In : Proceedings of 2009 Symposium of Korean Soc Parenter Enteral Nutr; 2009. p. 135–136.
4. Bautista EN, Tanchoco CC, Tagan MG, Magtibay EV. Effect of flavor enhancers on the nutritional status of older persons. J Nutr Health Aging. 2013; 17(4):390–392.
5. Choi HM, Lee SI, Byun KW, Han YS, Jung SJ. What and how eating in our children? Ikkibooks;2005. p. 28–210.
6. Cohen AJ, Roe FJ. Review of risk factors for osteoporosis with particular reference to a possible aetiological role of dietary salt. Food Chem Toxicol. 2000; 38(2-3):237–253.
7. D'Elia L, Rossi G, Ippolito R, Cappuccio FP, Strazzullo P. Habitual salt intake and risk of gastric cancer: a meta-analysis of prospective studies. Clin Nutr. 2012; 31(4):489–498.
8. Furuta M, Komiya-Nonaka M, Akifusa S, Shimazaki Y, Adachi M, Kinoshita T, Kikutani T, Yamashita Y. Interrelationship of oral health status, swallowing function, nutritional status, and cognitive ability with activities of daily living in Japanese elderly people receiving home care services due to physical disabilities. Community Dent Oral Epidemiol. 2013; 41(2):173–181.
9. Health Insurance Review & Assessment Service. 3/4 Quarterly statistical indicators in medical fee. 2012. cited December 4, 2013. Available from http://www.hira.or.kr/dummy.do?pgmid=HIRAA020045010000.
10. Hur H. Nutrition screening and assessment of patients for malnutrition. J Korean Soc Parent Enter Nutr. 2013; 5(1):2–9.
11. Kim BH, Jung E. The changes of types of nutritional risk and nutritional intake according to depression and self-esteem among the elderly in Chunnam province. J Korean Home Econ Assoc. 2008; 46(8):97–107.
12. Kim EK, Nam HW, Park YS, Myung CY, Lee KW. Nutrition through the life cycle. Shinkwang Publishing Co;2007. p. 236.
13. Kim IS, Yoo HH, Kim YS. A study on nutrient intake, food behavior and health condition according to food intake diversity in the elderly in a local city. Korean J Community Nutr. 2001; 6(2):205–217.
14. Kim SH, Kim KS. The advantages of enteral nutrition. J Korean Soc Parent Enter Nutr. 2010; 3(1):3–8.
15. Korean National Statistical Office. Elderly statistics. 2011a. cited Feburary 4, 2014. Available from http://kostat.go.kr/portal/korea/kor_nw/2/6/1/index.board?bmode=read&aSeq=180000.
16. Korean National Statistical Office. Population Projections for Korea: 2010~1060. 2011b. cited February 4, 2014. Available from http://kostat.go.kr/wnsearch/search.jsp.
17. Korean Nutrition Society. Dietary reference intakes for Koreans. 1st revision. 2010. cited December 7, 2013. Available from http://www.kns.or.kr.
18. Kwak KS, Bae YJ, Kim MH. Nutritional status and dietary quality in the low income elderly residing at home or health care facility. J Korean Diet Assoc. 2008; 14(4):337–350.
19. Lee MS, Kim MH. Medical service satisfactions of main caregivers of elderly inpatients according to the grades of long-term care hospitals. Glob Health Nurs. 2013; 3(2):73–81.
20. Lee JW, Lee MS, Kim JH, Son SM, Lee BS. Nutrition Assessment. Seoul: Kyomunsa;1999. p. 199.
21. Lee SS, Oh SH. Prevalence of obesity and eating habits of elementary school students in Kwangju. Korean J Community Nutr. 1997; 2(4):486–495.
22. Ministry of Health and Welfare, Korea Centers for Disease Control and Prevention. Korea National Health and Nutrition Examination Survey (KNHANES V-3). 2013. cited February 4, 2013. Available from https://knhanes.cdc.go.kr/knhanes/index.do.
23. Ministry of Health and Welfare. National Health Statistics. 2011. cited December 5, 2013. Available from http://stat.mw.go.kr/front/statData/publicationView.jsp?bbsSeq=13&nttSeq=20503&menuId=47.
24. Park HK, Yim BK, Choi SH, Lee HR, Lee DS. Verification of the appropriateness when a shortened version of the mini nutritional assessment (MNA) is applied for determining the malnutrition state of elderly patients. J Korean Soc Parent Enter Nutr. 2009; 2(1):13–18.
25. Park JE, An HJ, Jung SU, Lee YN, Kim CI, Jang YA. Characteristics of the dietary intake of korean elderly by chewing ability using data from the korea national health and nutrition examination survey 2007-2010. J Nutr Health. 2013; 46(3):285–295.
26. Park JH, Kwon HK, Kim BI, Choi CH, Choi YH. A survey on the oral health condition of institutionalized elderly people resident in free asylum. J Korean Acad Dent Health. 2002; 26(4):555–566.
27. Paker-Eichelkraut HS, Bai-Habelski JC, Overzier S, Strathmann S, Heseker H, Stehle P, Lesser S. Nutritional status and related factors in elderly nursing home residents: comparative cross-sectional study in migrants and native Germans. J Nutr Gerontol Geriatr. 2013; 32(4):330–342.
28. Seo JS, Lee JH, Yoon JS, Joo SH, Choi YS. Assessment of nutritional and practice. Powerbook;2008. p. 60–81.
29. Shin BM, Bae SM, Ryu DY, Choi YK. The relationship between the number of natural teeth and nutritional status of elderly in korea-based on 2007~2009 national health and nutrition survey data-. J Korean Soc Dent Hyg. 2012; 12(3):521–531.
30. Stamler R. Implications of the Intersalt Study. Hypertension. 1991; 17:1 Suppl. I16–I20.
31. Takachi T, Inoue M, Shimazu T, Sasazuki S, Ishihara J, Sawada N, Yamaji T, Iwasaki M, Iso H, Tsubono Y, Ysugane S. Consumption of sodium and salted foods in relation to cancer and cardiovascular disease: the Japan public health center-based prospective study. Am J Clin Nutr. 2010; 91(2):456–464.
32. Whitney EN, Cataldo CB, Rolfes SR. ndersstanding Normal and Clinical Nutrition. 6th edition. Wadsworth: 2002. p. 545–546.
33. Yim KS. Elderly nutrition improvement program in the community health center: nutritional evaluation of the elderly using the Index of nutritional quality and food group intake pattern. J Korean Diet Assoc. 1997; 3(2):182–196.
34. Yim KS. Nutrient intake assessment of korean elderly living in inje area, according to food group intake frequency. Korean J Food Cult. 2008; 23(6):779–792.
35. Yim YS, Cho KJ, Nam HJ, Lee KH, Park HR. A comparative study of nutrient intakes and factors to influence on nutrient intake between Low-income elderly living in urban and rural areas. J Korean Soc Food Sci Nutr. 2000; 29(2):257–267.
36. Yoon MO, Moon HK, Kim SY, Kim BH. Nutritional assessment and management in long-term care insurances home visit care service. Korean J Community Nutr. 2013; 18(2):142–153.
37. Yoon YS, Kim SM. A study on the nutritional assessment and the effects of enteral nutritional supports of tube feeding inpatients. J Korean Soc Food Sci Nutr. 1996; 25(5):855–864.
38. 2002; 19:suppl.
 XML Download