

 PDF
PDF ePub
ePub Citation
 Print
Print


Type 2 diabetes mellitus (T2DM), one of most prevalent metabolic diseases, is characterized by high levels of insulin and peripheral insulin resistance [12]. The hippocampus is a highly insulin-sensitive organ with a high abundance of insulin receptors [13]. Accumulating evidence indicates that chronic T2DM leads to cognitive problems, including dementia and Alzheimer's disease [1456789]. Among animal models for T2DM, the Zucker diabetic fatty (ZDF) rats are most frequently used for T2DM models deficient in leptin receptors [10]. Leptin receptor-based animal models shows similar phenotypes with humans including hyperphagia, defective non-shivering thermogenesis, increased efficiency for food utilization, and preferential deposition of energy in adipose tissue [1112]. ZDF rats start to increase blood glucose levels from 7 weeks of age [1314] and demonstrate a reduction in vascular permeability and expression of tight junction proteins in the hippocampus at 40 weeks of age [15].
T2DM affects the conditions of neurons as well as neuroglia in the hippocampus [1617]. In the previous study, we observed the microglia in ZDF rats showed activated morphology (e.g., hypertrophied cytoplasm with retracted processes) at 30 weeks of age and we also found the subsequent increases in interleukin-1β immunoreactive structures in the hippocampus of ZDF rats at 30 weeks of age near the astrocytes and microglia [18]. In addition, we also found the decreases in the integrity of blood-brain barrier and ultrastructural morphology of blood vessels and its adjacent structures at 40 weeks of age [15]. However, there were few reports on the T2DM-induced changes of myelin proteins in the hippocampus.
Myelin basic protein (MBP), which is an essential component of myelin formation, is one of the most abundant proteins in the central nervous system (CNS). Mutations in the MBP gene lead to a lack of compact CNS myelin in mice [19] and rats [20]. MBP is closely associated with cytoskeletal proteins, such as actin, tubulin, tau, and microtubule-associated protein 2 [21222324]. There has been conflicting evidence about changes in MBP expression in the brain of several diseases, including Alzheimer's disease [21222324], scopolamine-induced amnesia [25]. Streptozotocin-induced diabetes also decreased MBP protein levels in the rat cerebral cortex, 1 month after treatment [26] and the level of MBP mRNA in the rat spinal cord after 3 months [27]. However, there are few studies on the effects of T2DM on MBP expression in the hippocampus at various stages of diabetes.
Thus, in the present study, we investigated the changes of MBP immunoreactivity and protein levels in the hippocampus of rats with diabetes at various ages.
Materials and Methods
Experimental animals
Male and female heterozygous (Leprfa/+) Zucker diabetic fatty (ZDF) rats were purchased from Charles River Laboratories (Wilmington, MA) and mated. They were housed under standard conditions with adequate temperature (22℃) and humidity (60%) control, a 12-hr light/12-hr dark cycle, and free access to water and Purina 5008 diet were provided as recommended by Genetic Models. The handling and care of the animals conformed to the guidelines established to comply with current international laws and policies (NIH Guide for the Care and Use of Laboratory Animals, NIH Publication No. 85-23, 1985, revised 2011) and were approved by the Institutional Animal Care and Use Committee (IACUC) of Seoul National University (Approval number: SNU-120312-10). All experiments were conducted with an effort to minimize the number of animals used and the physiological stress caused by the procedures employed. All experimental procedures were conducted according to ARRIVE guidelines [28].
Check for body weight and blood glucose levels
The genotype of the fa gene was determined by polymerase chain reaction described in our previous study [29]. Based on the genotyping, homozygous ZDF (Leprfa/fa) and Zucker lean control (ZLC, Lepr+/+) rats were used for diabetic and its control group, respectively. Body weight was measured and blood was sampled by “tail nick” between 9:00 and 11:00 am, using a 27 G needle without fasting. Fed glucose levels before sacrifice were analyzed using a blood glucose monitor (ACCU-CHEK®, Boehringer Mannheim Corp., Indianapolis, IN).
Tissue processing for histology
For immunohistochemical analysis, animals were anesthetized with 2 g/kg urethane (Sigma), before being perfused transcardially with 0.1M phosphate-buffered saline (PBS; pH 7.4), and then with 4% paraformaldehyde in 0.1M PBS (pH 7.4). Rat brains were removed, and the brain was postfixed in the same fixative for 12 h. Brains were cryoprotected with an overnight 30% sucrose immersion. Thereafter, 30-µm-thick brain sections were cut serially in the coronal plane using a cryostat (Leica, Wetzlar, Germany). Sections were collected into six-well plates containing PBS.
Immunohistochemistry for myelin basic protein (MBP)
To obtain accurate data for immunohistochemistry, free-floating sections from all rats were processed carefully under the same conditions as described previously [30]. For each animal, tissue sections were selected with reference to a rat brain atlas [31], between 3.00 and 4.08 mm posterior to the bregma. Ten sections, 90 µm apart, were sequentially treated with 0.3% hydrogen peroxide (H2O2) in PBS for 30 min and 10% normal horse serum in 0.05 M PBS for 30 min thereafter. The sections were then incubated with a rabbit anti-MBP antibody (1:1,000, Abcam, Cambridge, UK) overnight at 25℃, before being sequentially treated with either biotinylated goat anti-rabbit IgG, or a streptavidin-peroxidase complex (1:200, Vector, Burlingame, CA). Sections were visualized by the reaction with 3,3-diaminobenzidine tetrachloride (Sigma) in 0.1 M Tris-HCl buffer (pH 7.2). The sections were then dehydrated, before being mounted onto gelatin-coated slides, using Canada balsam (Kanto, Tokyo, Japan).
In order to establish the specificity of primary antibody, procedure included the omission of the anti-MBP antibody, goat anti-rabbit, and substitution of normal goat serum for the anti-MBP antibody. As a result, immunoreactivity disappeared completely in tissues. All experiment procedures in the present study were performed under the same circumstance and in parallel.
Data analysis
Analysis of the hippocampal CA1, CA3, and dentate gyrus regions was performed using an image analysis system and ImageJ software v. 1.5 (National Institutes of Health, Bethesda, MD), according to a previously described method [30]. Digital images of the mid-point of hippocampal CA1, CA3, and molecular layer dentate gyrus regions were captured with a BX51 light microscope (Olympus, Tokyo, Japan), equipped with a digital camera (DP72, Olympus) connected to a computer monitor. Images were calibrated into an array of 512×512 pixels corresponding to a tissue area of 1,200 µm×900 µm (100× primary magnification). Each pixel resolution was 256 gray levels, and the intensity of MBP immunoreactivity was evaluated by relative optical density (ROD), which was obtained after transformation of the mean gray level using the following formula: ROD=log(256/mean grayscale level). The ROD of background staining was determined in unlabeled portions of the sections based on the immunohistochemistry staining data with omission of primary antibody using Photoshop CC 2018 software (Adobe Systems Inc., San Jose, CA), and this value was subtracted to correct for nonspecific staining, using ImageJ v. 1.50 software (National Institutes of Health). Data were expressed as a percentage of the 12-week-old ZLC group values (set to 100%).
Western blot analysis for myelin basic protein (MBP)
To quantify changes in the level of MBP in the hippocampus, ZLC and ZDF rats (n=4 per group) were euthanized at 12, 30, and 52 weeks of age. Hippocampal tissue was dissected for western blot analysis as described previously [15]. Briefly, hippocampal tissues were homogenized in 50 mM PBS (pH 7.4), containing 0.1 mM ethylene glycol-bis(2-aminoethylether)-N,N,N,N-tetraacetic acid (pH 8.0), 0.2% Nonidet P-40, 10 mM ethylenediaminetetraacetic acid (pH 8.0), 15 mM sodium pyrophosphate, 100 mM β-glycerophosphate, 50 mM NaF, 150 mM NaCl, 2 mM sodium orthovanadate, 1 mM phenylmethylsulfonyl fluoride, and 1 mM dithiothreitol (DTT). After centrifugation, protein levels in the supernatants were determined using a Micro bicinchoninic acid assay kit according to the manufacturer's instructions (Pierce Chemical, Rockford, IL). Aliquots containing 20 µg of total protein were denatured by boiling in loading buffer, which contained 150 mM Tris (pH 6.8), 3mM DTT, 6% sodium dodecyl sulfate, 0.3% Bromophenol Blue, and 30% glycerol. Each aliquot was loaded onto a polyacrylamide gel. After electrophoresis, proteins were transferred to nitrocellulose membranes (Pall Crop, East Hills, NY), which were then blocked in 5% non-fat dry milk in PBS/0.1% Tween 20 for 45 min, prior to incubation with a rabbit anti-MBP antibody (1:1,000, Abcam). Detection was performed using the peroxidase-conjugated anti-rabbit IgG (Vector) and an enhanced luminol-based chemiluminescent kit (Pierce Chemical). The blots were scanned, and densitometry was performed, using Scion Image software (Scion Corp., Frederick, MD). Blots were stripped and re-probed with an antibody against β-actin for internal loading control. Data were normalized to the β-actin level in each lane.
Statistical analysis
The data shown here represent the mean±standard error of mean (SEM) of experiments performed for each experimental area. Data were analyzed using the GraphPad Prism 5.01 software (GraphPad Software, Inc., La Jolla, CA), and differences among the means were statistically analyzed with two-way ANOVA with Bonferroni's post-hoc test to elucidate differences owing to age and diabetes. Threshold for statistical significance was set to P<0.05.
Results
Changes in body weight and blood glucose levels
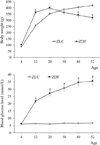
In the ZLC group, body weight steadily increased with age and weight gain was prominent earlier (i.e., 4 and 20 weeks of age) rather than later (i.e., between 30 and 52 weeks of age). In the ZDF group, body weight, which increased by 20 weeks of age, was significantly higher compared to the age-matched ZLC group. However, body weight gradually decreased in the ZDF group, from 30 to 52 weeks of age. Further, it was significantly lower than that in age-matched rats in the ZLC group (Figure 1). At 40 and 52 weeks of age, the body weight of ZDF rats was lower than 12-week-old rats in the ZDF group.
The blood glucose levels of rats in the ZLC group, which was 6.0–6.7 mmol/L, was similar at all ages. In the ZDF group, blood glucose levels sharply increased between 4 and 12 weeks of age, and steadily increased thereafter until 52 weeks of age (Figure 1).
Changes in myelin basic protein (MBP) immunoreactivity in the hippocampus
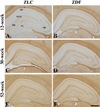
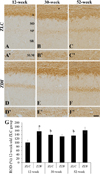
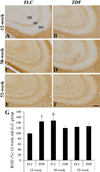
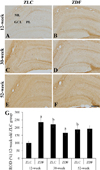
In the 12-week-old ZLC group, MBP immunoreactivity was found in the alveus, strata pyramidale, and lacunosum-moleculare of the CA1 region, the strata pyramidale and radiatum of the CA3 region, and the subgranular zone, polymorphic layer, and molecular layer of the dentate gyrus (Figures 2A, 3A, 3A′, 4A, 5A). The MBP immunoreactivity in the hippocampus of the 12-week-old ZDF group was similar to the age-matched ZLC group (Figures 2B, 3D, 3D′, 4B, 5B). In the 12-week-old ZDF group, MBP immunoreactivity was particularly higher in the stratum pyramidale of the CA1, stratum radiatum of the CA3, and outer molecular layer of the dentate gyrus (Figures 3G, 4G, 5G).
The MBP immunoreactivity in the hippocampus of rats in the 30-week-old ZLC group was similar to that in the 12-week-old ZDF group (Figures 2C, 3B, 3B′, 4C, 5C), except that it was lower in the stratum pyramidale of the CA1 region in the 30-week-old ZLC group (Figure 3G). Further, the MBP immunoreactivity in the 30-week-old ZDF group was also lower in the stratum pyramidale of the CA3 region and molecular layer of the dentate gyrus, compared to that in the 12-week-old ZDF group and age-matched ZLC group (Figures 2D, 3E, 3E′, 3G, 4D, 4G, 5D, 5G).
At 52 weeks of age, the MBP immunoreactivity in the hippocampus of rats in the ZLC group, was similar to the 30-week-old ZLC group, except that it had decreased in the stratum lacunosum-moleculare of CA1 region (Figures 2E, 3C, 3C′, 3G, 4E, 4G, 5E, 5G). Further, although the MBP immunoreactivity in the 52-week-old ZDF group was similar to the age-matched ZLC group, it was higher in the stratum pyramidale of the CA1 region compared to the age-matched ZLC group (Figures 2F, 3F, 3F′, 3G, 4F, 4G, 5F, 5G).
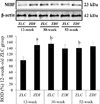
Changes in the level of myelin basic protein (MBP) in the hippocampus
The level of MBP was higher in the hippocampus of the 12-week-old ZDF group, compared to the 12-week-old ZLC group. Except this, the level of MBP in the hippocampus did not significantly differ between groups, although it was slightly, but not significantly, increased in the 52-week-old ZDF group compared to the age-matched ZLC group (Figure 6).
Discussion
In the present study, we investigated changes in the body weight and blood glucose levels of ZLC and ZDF rats, at various ages. Compared to ZLC rats, the blood glucose levels dramatically increased in ZDF rats at 4–12 weeks of age, thereafter, steadily increasing and tapering at 52 weeks of age. However, in ZDF rats, body weight peaked at 20 weeks of age and gradually decreased thereafter, although blood glucose levels steadily increased by 52 weeks of age. This result corroborated with previous studies, which demonstrated that the difference in body weight and body mass index between ZDF and ZCL rats had disappeared at 15 weeks of age [3233]. Another study, however, reported that a higher body weight in ZLC rats, compared to ZDF rats, at 24 weeks of age [34]. Based on this observation, we divided the animals with the following three subgroups: early diabetic (12 weeks of age), chronic diabetic (30 weeks of age), and late diabetic (52 weeks of age) groups, and assessed MBP expression in the hippocampus.
The distribution pattern of MBP was consistent with previous studies, where MBP immunoreactivity was found in the alveus, stratum pyramidale, and stratum lacunosum-moleculare of the CA1 region, the stratum pyramidale and radiatum of the CA3 region, and the molecular layer, subgranular zone, and polymorphic layer of the dentate gyrus [253536]. In the ZLC rats, MBP immunoreactivity peaked at 30 weeks of age, before decreasing at 52 weeks. This result was in line with a previous study reporting a significant reduction in MBP immunoreactivity in the hippocampal CA1 region of senescence-accelerated mice, at 5 or 10 months of age, in comparison to age-matched control mice [35]. In addition, the stratum lacunosum-moleculare is the most susceptible regions to scopolamine-induced decreases in MBP expression [25]. Fewer and shorter myelinated fibers are visible in stratum lacunosum-moleculare of CA1 region in control and Down syndrome patients with age [37]. In the present study, MBP immunoreactivity transiently decreased in ZDF rats in the stratum lacunosum-moleculare and molecular layer of dentate gyrus at 30 weeks of age, compared to the age-matched ZLC group. In addition, our proteomic approach demonstrated the reduction of MBP expression in the hippocampal homogenates at 40 weeks of age [38]. However, we failed to observe any significant changes in MBP immunoreactivity in the hippocampus at 52 weeks, although MBP immunoreactivity was higher in the stratum pyramidale of CA1 region in ZDF rats. Chronic T2DM reduced cognitive function, with or without Alzheimer's disease pathology [3940]. In addition, Hussain et al. quantitatively observed the substantial neuronal loss in the cerebral cortex of a young rat model of T2DM in comparison to age-matched healthy Wistar rats [41]. In the previous studies, we also demonstrated the reduction of integrity of blood-brain barrier [15] and disarrangement of myelin in the hippocampal tissue [38]. Further, several studies have reported that the MBP level and its mRNA expression increased in the brain in Alzheimer's disease [424344].
However, MBP immunoreactivity did not significantly change with age in ZDF rats. This suggested that diabetes may decrease the plasticity of oligodendrocytes in the hippocampus and may be associated with reduction in regenerating process in various insults with T2DM. In the peripheral region, ischemia upregulated the expression of MBP in the hindlimbs limbs of wild-type mice, but no significant changes were observed in T2DM mice [45]. Similarly, in the central region, compared to non-DM ischemic rats, MBP immunoreactive density sharply decreased in the hippocampus and subcortical white matter of rats, at 13 months of age, due to diabetes and ischemia, which were induced by nicotinamide and streptozotocin [46]. In the T1DM rats induced by streptozotocin, MBP protein levels were similarly observed in the cerebral cortex of rats in the control and diabetic rats at 20 weeks after STZ treatment [47]. In the peripheral system, MBP expression showed conflict results in streptozotocin-induced T1DM. MBP expression levels are decreased in the sciatic nerve of diabetic rats [4748], while similar MBP expression levels were found in the sciatic nerve 4 weeks after streptozotocin treatment [48]. In isolated primary Schwann cells, hyperglycemia significantly decreased the expression of MBP and this effect has been blocked by insulin treatment [48]. Diabetes or hyperglycemia decelerates the regenerative neurogenesis in the stroke [46] and stab wound injury [49].
In conclusion, MBP immunoreactivity changed in the hippocampus of non-diabetic control aged animals, but not in the diabetic animals. The sustained expression of MBP in the diabetic rats may be associated with the decrease in the plasticity of oligodendrocytes in the hippocampus.
 XML Download