

 PDF
PDF ePub
ePub Citation
 Print
Print


INTRODUCTION
Metabolic syndrome (MS) is associated with the development of diabetes and cardiovascular disease [1], and is characterized by a collection of interdependent disorders, including abdominal obesity, dyslipidemia, hyperglycemia, hypertension, and diabetes [2]. Cardiovascular disease is the most common cause of death in many countries, and persons with MS are 5 times more likely to develop type 2 diabetes [3]. The risk of severe disease and mortality posed by MS is increased by synergistic effects of the risk factors and by exacerbation of each component of MS [4]. Although the evidence is insufficient, some data indicate that cardiovascular disease is becoming more common in Iran [5].
The primary cause of MS has not been established, although abdominal obesity and insulin resistance appear to be the main mediators of MS [6]. The definitions of MS proposed by the World Health Organization (WHO) and the National Cholesterol Education Program-Adult Treatment Panel III (ATP III) have focused on diabetes and blood cholesterol, respectively. In contrast, the International Diabetes Federation (IDF) presented a new definition of MS that includes central adiposity, measured by waist circumference, as a crucial element of MS that must be verified by ethnicity- and sex-specific cutoff values [35]. As plans for the prevention of non-infectious diseases emphasize the appropriate evaluation and management of risk factors, assembling reliable information about the prevalence of MS in various nations can be an important component in the development and successful use of preventive plans targeting such diseases [7].
It is generally accepted that the prevalence of MS is influenced by ethnicity, gender, age, race, cultural habits, environmental factors, and sedentary lifestyle, and as the exposure to some ecological risk factors is increasing in many nations, the incidence of MS is increasing as well [8]. Thus, its prevalence has large variations among different societies [7]. Middle Eastern populations have an ethnic predisposition to MS [9], making MS a particular concern; in fact, MS is projected to lead to a significant increase in the total burden of diabetes by 2020 [10]. The various cultures, economic conditions, lifestyle behaviors, and ecological factors of the Iranian people affect their morbidity due to MS [1112]. Since it is very important to have local assessments of its prevalence in addition to nationwide data, the current study aimed to estimate the prevalence of MS in the city of Qom, a city in central Iran with a variety of ethnicities (Persian, Arab, and Turkish). Moreover, we aimed to assess the effect of participants' fasting blood glucose (FBG) levels and lipid profile on the prevalence of MS.
MATERIALS AND METHODS
1. Setting and subjects
The current population-based screening program was conducted in the city of Qom, a metropolis in central Iran. The geographic setting of the screening program and methods for recruiting and selecting subjects have been described in our recent work in more detail [13]. The study population included 845 urban adult men over 25 years old, who were assessed in 2014 for FBG, fasting lipid profile, and demographic characteristics. The sampling was conducted using proportional stratified and systematic random sampling methods in 2 phases to select eligible subjects.
2. Ethics statement
All participants provided written informed consent and the ethical committee of Qom University of Medical Sciences approved the study protocol as previously described [13].
3. Measurements
Before conducting any laboratory tests, all subjects were interviewed to evaluate their self-reported health status. Then, based on the study protocol, male participants between 25 and 85 years old were invited to participate in the screening, and were evaluated as described elsewhere [13]. A serum lipid profile, including total cholesterol, high-density lipoprotein (HDL) cholesterol, low-density lipoprotein (LDL) cholesterol, very low-density lipoprotein (VLDL) cholesterol, triglyceride (TG), and hemoglobin (Hb) tests, was ordered for subjects after no caloric intake for at least 8 hours, and the laboratory results were assessed. The main outcome in this study was MS, which was defined in our research according to the ATP III criteria [14] by the presence of 3 or more of the following items: 1) high blood pressure (≥130/85 mmHg or a history of hypertension); 2) abdominal obesity (waist circumference >102 cm [40 inches] in males); 3) FBG ≥110 mg/dL (or a history of diabetes mellitus); 4) fasting HDL cholesterol <40 mg/dL in males; and 5) fasting TGs ≥150 mg/dL.
Additional data were collected in an interview in which the following information was gathered: demographic characteristics, including age; waist circumference; and blood pressure measurements.
4. Statistical analysis
After data collection, the results of laboratory tests were categorized based on the ATP III criteria [14] and dyslipidemia was defined based on the lipid profile, as in our previous work [13], using an established protocol [15]. Data were analyzed using the chi-square test and the t-test in the univariate analysis. Additionally, multiple logistic regression was used to determine the attributable effect of each component of MS and dyslipidemia. Data were analyzed in PASW ver. 18 (IBM Co., Armonk, NY, USA). The p-values of less than 0.05 were considered statistically significant.
RESULTS
According to the results shown in Table 1, 70.8% of the participants were married and 20.9% were younger than 35 years old. There was a significant difference in the prevalence of MS between married and single people (18.9% vs. 29.4%). Moreover, the highest prevalence rate was seen in those 55 to 64 years old, after which point it decreased with age. The prevalence of MS in those 75 years old and older was 20.3%, in comparison to 25.2% and 20.7% in those 35 to 44 years and those who were 45 to 54 years old, respectively.
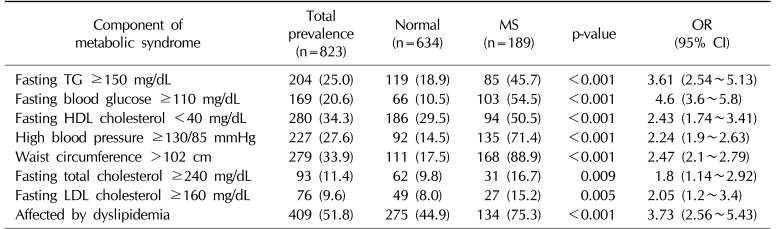
As shown in Table 2, the overall prevalence of MS and dyslipidemia was 23.0% and 51.8%, respectively. The prevalence of different dimensions of MS was as follows: fasting TG ≥150 mg/dL was present in 25.0% of subjects, fasting HDL cholesterol <40 mg/dL in 34.3%, FBG ≥110 mg/dL in 20.6%, blood pressure ≥130/85 mmHg in 27.6%, and waist circumference >102 cm in 33.9%. According to the chi-square test, there was a significant difference between individuals with or without MS for all components of MS. Moreover, a fasting LDL cholesterol level ≥160 mg/dL and a Hb level <13 mg/dL were associated with MS.
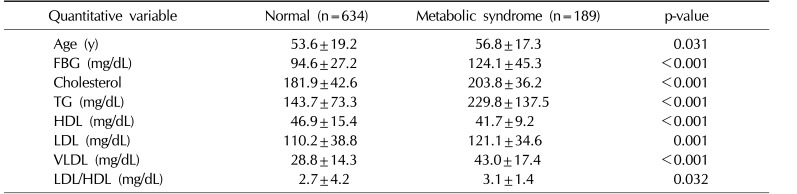
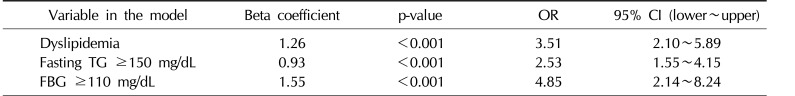
The independent t-test (Table 3) found a significant difference in the mean values of the lipid profile, including cholesterol, TG, HDL, LDL, VLDL, the LDL/HDL ratio, and FBG, as well as in the age of the participants. Nevertheless, the mean Hb level was not significantly different between the 2 groups. According to a multivariate regression model (Table 4), an FBG level ≥110 mg/dL was the factor most strongly associated with MS (odds ratio [OR]=4.85, 95% confidence interval [CI], 2.14∼8.24). In addition, dyslipidemia (defined as having at least one abnormal value in the lipid profile) (OR=3.51, 95% CI, 2.10∼5.89) and a fasting TG level ≥150 mg/dL were factors associated with MS in the final model.
DISCUSSION
The overall prevalence of MS was 23.0%. The prevalence of MS in 2,941 urban dwellers in Zanjan Province was reported to be 23.7% [16], and in another study conducted in 2012 using the ATP III criteria [17], as in our study, MS was reported to be present in 30.1% of Iranian men. Moreover, a national study in Iran showed that the age-standardized prevalence of MS was 34.7% according to the ATP III criteria, and was estimated to be 37.4% based on the IDF definition [18]. A large study in Iranian adults found that the prevalence of MS was 32.1% based on the IDF definition, 33.2% based on the ATP III criteria, and 18.4% according to the WHO definition. Moreover, Zabetian et al [5] showed that the IDF definition of MS exhibited high agreement with the ATP III criteria and a low agreement with the WHO definition in the Iranian population. However, it is remarkable that the prevalence of MS was found to be higher in Iranians than in the populations of European countries such as France [17].
The highest prevalence of MS was seen in participants who were 55 to 64 years old, and it decreased with age. Furthermore, the prevalence of MS in those 75 years of age and older was 20.3%, whereas it was 25.2% and 20.7% in those under 35 and 35 to 44 years old. In the study of Sharifi et al [16], the prevalence of MS had a direct relationship with age, and increased from 7.5% in those younger than 30 years to 45.6% in those older than 50 years of age. In addition, 2 other studies [1920] in students and adolescents showed a lower prevalence, which could have been related to their younger age. The results of the study of Gholipour et al [20] in students in Tehran showed that the prevalence of MS was 5.4%, and this rate was 6.67% in males versus 2.7% in females. In another study that was conducted in a population-based cross-sectional study of 3,036 students who were 10 to 19 years of age, the prevalence of MS was determined to be 10.1% for Iranian adolescents in general and 10.3% for boys [19]. However, the lower rate of MS in those 2 studies was likely related to the target population of adolescents, whereas our subjects were men at least 25 years of age.
The most common prevalent metabolic abnormalities in our study were as follows: HDL<40 mg/dL in 34.3% of participants, waist circumference >102 cm in 33.9%, blood pressure ≥130/85 mmHg in 27.6%, fasting TG ≥150 mg/dL in 25.0%, and FBG ≥110 mg/dL in 20.6%. In other studies of urban populations in the west of Iran [1617] low HDL was the most common metabolic abnormality. In addition, in another study, low HDL (42.8%) and high TG (37.5%) were the most common abnormalities associated with MS [19]. Moreover, a comparative study in Iran and France showed that the main cause of high prevalence of MS in Iranians was insufficient HDL cholesterol levels in the Iranian population [17].
The univariate analysis showed that the dyslipidemia-related factors of a fasting LDL cholesterol level ≥160 mg/dL and a Hb level <13 mg/dL were factors associated with MS in addition to the main components of the ATP III criteria for MS. This means that some revisions might be needed to develop a new definition of MS in Iranians or that the cutoff points for labeling abnormalities should be changed, as suggested by Azizi et al [21]. The results of the current study showed a significant difference between participants with and without MS in the mean values of the lipid profile, including cholesterol, TG, HDL, LDL, VLDL, the LDL/HDL ratio, and FBG, as well as the age of patients. Therefore, in the present study, the lipid profile and dyslipidemia were clearly found to be risk factors for MS in addition to fasting HDL cholesterol and fasting TG, as recommended by the ATP III guidelines. The multivariate regression model showed that an FBG level ≥110 mg/dL was the most important factor associated with MS, and increased the chance of MS more than 4.8-fold. In addition, having a disorder in the lipid profile increased the odds of MS 3.5-fold. Moreover, a fasting TG level ≥150 mg/dL was found to increase the prevalence of MS 2.5-fold. However, in another study in Iran, Azizi et al [21] proposed a new definition for diagnosing MS in Iran and changed some elements of MS based on the ATP III criteria, such as obesity and waist circumference cutoff points among Iranian adults. Moreover, preventing and controlling obesity and diabetes as major health problems in population are essential steps for preventing MS [222324]. Although we estimated the prevalence of MS and other metabolic abnormalities in men living in Qom for the first time, it is not clear how many patients did not know about their disease or were not treated. Moreover, we were not able to report the prevalence of MS according to demographic characteristics such as smoking and other likely relevant factors. Although, considering religious factors in developing care plans is effective in increasing the self-care of patients and should be approached [25].
CONCLUSIONS
Our results showed that the prevalence of MS in men in Qom, a city in central Iran, was higher than has been reported in other countries, but lower than the mean values that have been reported elsewhere in Iran. The prevalence of all metabolic abnormalities was high in men in Qom, especially low HDL cholesterol, abdominal obesity, and high TG. Our results showed that FBG was the factor most strongly associated with MS, although all elements of the lipid profile were associated with MS. Therefore, preventing dyslipidemia and working towards a balanced lipid profile can be expected to be effective steps for reducing the prevalence of MS.

 XML Download