

 PDF
PDF ePub
ePub Citation
 Print
Print


INTRODUCTION
Gastric cancer is the fifth most common malignancy worldwide, representing 6.8% of all new cancers [123], and the third leading cause, accounting for 8.8%, of all cancer-related deaths. The 5-year survival rate declines rapidly with the extent of the cancer, from 65.4% for patients with localized lesions to 29.9% for those with regional metastases, decreasing further to 4.5% for those with distant metastases [3]. Owing to the generally asymptomatic nature in the early stages of gastric cancer, up to two-thirds of patients present with regional or distal metastatic disease [456].
Surgical resection is the primary treatment for non-metastatic gastric cancer, and several studies have suggested prognostic indices for these patients. However, patients with metastatic disease are treated with systemic chemotherapy, with few studies aimed at determining prognostic indices for these populations. The Royal Marsden Hospital [78] proposed a prognostic index from 4 factors associated with poor prognosis in first-line therapy: performance status (PS) ≥2, liver metastasis, peritoneal metastasis, and elevated alkaline phosphatase (ALP). This analysis was performed using data exclusively from Western centers, although the index was validated in 2 independent datasets in Korea [9] and Japan [10]. Takahari and colleagues [10], noting that there are “substantial differences” in the prognosis of Asian and Western patients with advanced gastric cancer, proposed a prognostic index for first-line chemotherapy based on 4 similar risk factors: PS ≥1, number of metastatic sites ≥2, no prior gastrectomy, and elevated ALP [10]. However, this secondary analysis was performed exclusively with an Asian population [10]. There is a paucity of prognostic data after first-line chemotherapy in gastric cancer patients. Catalano and colleagues [11], and more recently, Kanagavel and colleagues [12], proposed prognostic indices to identify low-, intermediate-, and high-risk groups of patients with metastatic gastric cancer receiving second-line chemotherapy. However, both studies were limited by small sample sizes (n=175 and n=126, respectively) and a retrospective, non-randomized study design.
In contrast to other cancer types, such as non-Hodgkin lymphoma, multiple myeloma, and cancers of the breast, kidney, prostate, or colon, no common prognostic index exists for advanced gastric cancer, in part due to the limited numbers of studies performed, low patient numbers, or limited geographic reach. Development of a generally applicable prognostic index for advanced gastric cancer would be valuable for assessing survival prognosis of individual patients, aiding in stratification for new randomized clinical trials (RCTs), and guiding decisions for optimal treatment strategies [7810121314].
Improvement in quality of life (QoL), even in the absence of prolonged survival time, is an important outcome that should be considered when recommending second-line therapy [13]. Evaluation of QoL includes physical, psychological, and social dimensions, and best reflects how patients perceive their own state of health [715]. Chau and colleagues [7] found that a higher baseline QoL was associated with improved survival with first-line chemotherapy, indicating that QoL reflects a patient's overall well-being and has prognostic value.
The present analysis was undertaken using 2 large RCTs with Western and Asian populations to devise a prognostic index for survival in patients with previously treated advanced gastric/gastroesophageal junction (GEJ) cancer. A secondary analysis that considered baseline QoL was also performed.
MATERIALS AND METHODS
Patient data were obtained from 2 large global RCTs of second-line therapy for advanced gastric/GEJ cancer that included patients from Asia, Europe, North and South America, Australia, and Africa. For the REGARD study (NCT00917384), 355 patients were randomized between October 2009 and January 2012 in 29 countries to receive either ramucirumab (Cyramza®; Eli Lilly and Company, Indianapolis, IN, USA) (8 mg/kg; n=238) or placebo (n=117), intravenously once every 2 weeks plus best supportive care [16]. The RAINBOW study (NCT01170663) was conducted with 665 patients who were randomized between December 2010 and September 2012 [17] to receive either ramucirumab (8 mg/kg, n=330) or placebo (n=335), intravenously on days 1 and 15, plus paclitaxel (Taxol®; Bristol-Myers Squibb Company, Princeton, NJ, USA) (80 mg/m²) intravenously on days 1, 8, and 15 of a 28-day cycle. The study designs and consolidated standards of reporting trials diagrams have been previously published [1617].
Patient selection
Both studies had similar eligibility criteria. Patients had advanced gastric/GEJ adenocarcinoma and disease progression within 4 months of first-line chemotherapy (platinum and/or fluoropyrimidine with or without an anthracycline). Patients had an Eastern Cooperative Oncology Group (ECOG) PS of 0 or 1, and measurable or non-measurable evaluable disease [1617] as defined by response evaluation criteria in solid tumors (RECIST) version 1.1 (RAINBOW) or version 1.0 (REGARD) [18]. Both studies assessed QoL using the European Organization for Research and Treatment of Cancer (EORTC) 30-item Quality of Life Core Questionnaire (QLQ-C30) version 3.0 [19]. The individual data from the REGARD and RAINBOW studies were pooled (1,020 patients, 794 deaths), providing the largest to date second-line gastric cancer population to be analyzed for prognostic factors.
Both studies were conducted in accordance with the ethical principles originating in the Declaration of Helsinki, good clinical practices, and all applicable laws and regulations. The Institutional Review Board at each site approved the study, and all subjects provided written informed consent before undergoing any study procedure.
Statistical analysis
The endpoint for the present analysis was overall survival (OS), defined as the time from randomization to time of death from any cause, with patients censored at the last-known-alive date if they were not known to have died at the time of the data cut-off.
Given the large sample size of the pooled studies (1,020 patients, 794 events), the model can accommodate a large number of covariates. A covariate pool was generated from all 41 baseline factors common in both studies (18 clinical characteristics, 22 laboratory parameters, and geographic region). The clinical characteristics included: age, race, ethnicity, sex, weight loss, ECOG PS, body weight, disease progression during first-line therapy or within 4 months, time since diagnosis, histologic subtype, presence of liver metastases, disease measurability, number of metastatic sites, primary tumor location, presence of primary tumor, time to progression since prior therapy, tumor differentiation, and presence of peritoneal metastasis. The laboratory parameters included: levels of alanine aminotransferase (ALT), ALP, aspartate aminotransferase (AST), lactate dehydrogenase (LDH), albumin, bilirubin, creatinine, erythrocytes, hematocrit, hemoglobin, leucocytes, lymphocytes, neutrophils, platelets, phosphate, potassium, magnesium, sodium, and calcium; prothrombin international normalized ratio (INR); prothrombin time (PT); and activated partial thromboplastin time (PTT).
Continuous variables for clinical characteristics were dichotomized using thresholds specified in the study protocols (age, weight loss, time to progression since prior therapy, and number of metastatic sites) or using the median (body weight and time since diagnosis) (Table 1). Laboratory parameters were analyzed based on local laboratory assessments with 3 categories (abnormally high, normal, and abnormally low). The categorized laboratory values were used in the analysis to account for measurement variability across local laboratories.
Table 1
Clinical factors: baseline summary and univariate analysis
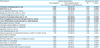
The factors that were included in the final model are shown in bold text. For each factor, the poor prognostic group is shown first for each group pair within parentheses.
HR = hazard ratio; ECOG = Eastern Cooperative Oncology Group; PS = performance status; GEJ = gastroesophageal junction.
*Histologic subtype (other) means mixed and unknown/missing; †Race (other) includes African-American, American Indian, or Alaska Native, multiple race, and others.
Two factors needed special handling: treatment and geographic region. Treatment has substantial impact on OS, as significant treatment benefits were demonstrated in both studies. As discussed in the introduction, geographic region is a well-known prognostic factor in gastric cancer, which is also confirmed in this pooled data. As these 2 factors are not individual patient characteristics, they were adjusted in Cox models as stratification factors instead of covariates. Effects of selected covariates were very similar if these 2 factors were controlled as covariates (small change in hazard ratio [HR] estimates: maximum=−0.09, average=−0.02).
Prognostic factors were identified using Cox models in 2 steps. First, univariate Cox models (including each individual factor as the sole covariate) screened the covariates (significance level=0.05). Then, the final prognostic factors were identified based on a multivariable Cox model that was built using stepwise selection of covariates (entry and exit significance level=0.01). This stringent significance level (0.01) was used to reduce the impact of multiplicity due to the large number of covariates, which decreases the chance of identifying false positive factors as prognostic. Once the factors were identified, HRs with 99% confidence limits were estimated for each prognostic factor based on the final Cox model with only the selected factors as covariates (to reduce the number of patients who may have been excluded due to missing values of unselected factors). Based on the relative magnitude of each factor’s effect on OS (i.e., HR), a prognostic index was devised and grouped into 4 levels: low, medium, moderate, and high risk.
The discriminatory performance of the prognostic index was calculated using Harrell's C-index [20] and assessed visually using Kaplan-Meier plots. The internal validation was assessed via bootstrapping to estimate over-fitting optimism from model building.
To identify any additional independent prognostic factors from the QoL data, we repeated the above analyses with the 15 scales from the QLQ-C30. Following the EORTC scoring guidelines [21], each scale is reported as 0 to 100, with higher scores on the global health status and functioning scales, and lower scores on the symptom scales representing better QoL. For this analysis, these scores were dichotomized by median value (or 0 vs. >0 if median=0, or 100 vs. <100 if median=100). Once the univariate Cox models identified the significant QoL parameters (significance level=0.05), these parameters were included in the multivariable stepwise Cox regression, while the previously selected clinical and laboratory factors were forcibly included in the model (to identify additional prognostic value from QoL data). Once the QoL factors were selected, final estimates of coefficients were based on the model with only the selected clinical, laboratory, and QoL factors, to maximize the number of patients included in the analysis.
RESULTS
Of the 1,020 total patients included in the RAINBOW and REGARD studies, 953 (93%) were included in the final multivariable Cox regression analysis for this study, after excluding patients with missing covariate values. A significant number of this population included patients with peritoneal metastasis (41.6%), ECOG PS 1 (64.8%), time to progression since prior therapy <6 months (63.5%), metastatic sites ≥3 (33.8%), poorly differentiated tumors (63%), and diffuse tumor subtype (38%) (Table 1), which suggests this analysis included many critically ill patients. The Kaplan-Meier survival curve based on data pooled from both studies showed a median OS of 6.9 months, 12-month survival rate of 29% (95% confidence interval [CI], 26.1–32.0), and 24-month survival rate of 9.1% (95% CI, 6.8–11.8) (Supplementary Fig. 1). Results of the univariate analyses for clinical characteristics are summarized in Table 1, and for laboratory parameters in Table 2. It is important to note that the target populations for the RAINBOW and REGARD studies were very similar. The multivariable stepwise Cox regression with clinical and laboratory parameters identified 12 factors associated with poor prognosis for OS (Table 3): presence of peritoneal metastases, ECOG PS of 1, presence of a primary tumor, time to progression since prior therapy <6 months, poor/unknown tumor differentiation, abnormally low blood levels of albumin, sodium, and/or lymphocytes (below the institutional normal range), and abnormally high blood levels of neutrophils, AST, ALP, and/or LDH (above the institutional normal range).
Table 2
Laboratory parameters: baseline summary and univariate analysis
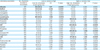
The factors that were included in the final model are shown in bold text.
HR = hazard ratio; AST = aspartate aminotransferase; ALP = alkaline phosphatase; PTT = partial thromboplastin time; LDH = lactate dehydrogenase; PT = prothrombin time; INR = international normalized ratio; ALT = alanine aminotransferase.
Table 3
Multivariable Cox regression analysis of the OS for prognostic factors in advanced gastric cancer
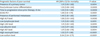
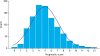
A prognostic score can be created using patient-level linear prediction (xbeta). Since the risks (as measured by HRs) of these factors had a similar magnitude (except low sodium), it was possible to create a simpler prognostic score without losing too much information for each patient by counting the number of prognostic factors (thus regarding their impact as equal, except low sodium, which was counted twice due to its relative size of HR being the square of others). Accordingly, the prognostic score ranged from 0 to 13, and approximately followed a normal distribution (Fig. 1).
Fig. 1
Histogram of prognostic scores among the 953 patients. The distribution approximates a Gaussian distribution.
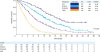
A prognostic index was then devised using prognostic scores as follows: “Low”= 0–2, “Medium”=3–4, “Moderate”=5–6, and “High”=7–13 (Table 4). Kaplan-Meier survival curves were generated for each of these 4 indices (Fig. 2), and a clear survival curve-separation was seen for the 4 risk groups (P<0.0001). The median OS values for the high-, moderate-, medium-, and low-risk groups were 3.4, 6.4, 9.9, and 14.5 months (Fig. 2), respectively. Discriminatory performance of the prognostic index had a Harrell's C-index of 0.66 (95% CI, 0.64–0.68). The over-fitting optimism due to model building was 0.01, as assessed by mean optimism of 200 bootstrapping samples, which suggested very little over-fitting of the model.
Table 4
Prognostic index (No. of patients in each group=953)

| Index | Score | Total No. of included patients (%) |
|---|---|---|
| Low | 0–2 | 107 (11.2) |
| Medium | 3–4 | 322 (33.8) |
| Moderate | 5–6 | 310 (32.5) |
| High | 7–13 | 214 (22.5) |
Fig. 2
The Kaplan-Meier curves showing OS for each of the 4 risk groups determined by the prognostic factors. The median survival and the patients at risk for each of these groups are also presented.
OS = overall survival.
Thirteen of the 15 QoL scales were significant in the univariate analyses (Supplementary Table 1). However, when included with the 12-selected clinical and laboratory factors, only patient-reported appetite loss was an independent prognostic factor (P<0.0001, Supplementary Table 2). The HRs of each of the 12 previous factors were relatively unchanged by inclusion of appetite loss in the model.
DISCUSSION
To the best of our knowledge, this is the largest global RCT dataset used to date to generate a prognostic index for second-line gastric cancer chemotherapy. The large sample size offers opportunities to derive a more reliable prognostic index, which distinguishes the current work from prior observations, most utilizing very limited datasets. Based on individual patient data pooled from 1,020 patients in 2 large phase III studies (RAINBOW and REGARD), we identified 12 clinical and laboratory factors that predict the survival of patients with advanced gastric/GEJ cancer after first-line chemotherapy: peritoneal metastases, ECOG PS of 1, the presence of a primary tumor, time to progression since prior therapy <6 months, poor/unknown tumor differentiation, abnormally low blood levels of albumin, sodium, and/or lymphocytes, and abnormally high blood levels of neutrophils, AST, ALP, and/or LDH. These factors were used to generate a prognostic index that divides patients into 4 risk groups (median OS by risk [months]: high=3.4, moderate=6.4, medium=9.9, and low=14.5), ranging from low to high risk of death. The discrimination power of this prognostic index, calculated using Harrell's C-index [20], is illustrated by the clear separation of the Kaplan-Meier survival curves for OS, along with the large range, 3.4 months to 14.5 months, in median survival time and a discrimination performance as measured by Harrell's C-index of 0.66. As the C-index is data-dependent and impacted by non-comparable patient-pairs (e.g., both patients with censored OS), 0.66 is comparable to that of many widely used prognostic systems in oncology such as the Child-Pugh system and albumin-bilirubin (ALBI) grade in hepatocellular carcinoma [22]. Internal validation was conducted through use of bootstrap validation, which revealed very little over-fitting of the model, with a mean optimism of 0.01. However, independent external validation of the model is warranted.
We extended the analyses by including baseline QoL data from the same studies, which found patient-reported appetite loss to be an additional independent prognostic factor. Although the clinical factor of weight-loss within the previous 3 months was prognostic in the univariate analyses, the subjective assessment of appetite had independent prognostic value. Among other disease-related symptoms and aspects of patient well-being, this symptom apparently has the greatest impact on OS. Although correlations existed among many QoL scales, only appetite loss showed significant contribution of additional power to predict patient's prognosis after controlling the 12-selected strong prognostic factors. All other scales may be prognostic to some extent (as shown in the univariate analysis), but did not meet statistical criteria to qualify as prognostic factors, given that 12 strong prognostic factors were included in the model. However, lack of standardized methods to assess patient-reported appetite loss in clinical practice may limit its use in a prognostic index.
Despite several attempts to develop a prognostic index for gastric cancer, little remains known about the prognostic factors for metastatic gastric cancer, especially in the second-line setting. Most studies either focused on first-line therapy or gastric resection [71014232425]. Chau and colleagues [7] identified 4 independent prognostic factors in a large study (1,080 patients), but this was performed exclusively in the United Kingdom, and was based on first-line treatment . Three of the 4 factors (PS, peritoneal metastasis, and high ALP) were also identified as prognostic factors in our study. Takahari and colleagues [10] also identified 4 prognostic factors (PS, ALP, number of metastatic sites, and no prior gastrectomy) exclusively in Asian patients . Only the first 2 factors were similar to those reported by Chau and colleagues [7], and 3 were identified in our study. Kanagavel and colleagues [12] identified 3 independent prognostic factors in patients with advanced gastric cancer receiving second-line therapy. PS and time to disease progression after first-line therapy were also identified in our analyses. In addition, Kanagavel and colleagues [12] included hemoglobin level as a factor. However, since hemoglobin levels are readily affected by blood transfusion or by erythropoietin, the reliability of this factor should be interpreted with caution. Moreover, this study may lack sufficient power due to small sample size (126 patients). In our study, high AST was identified as a strong prognostic factor in the univariate analysis (P<0.0001), although liver metastasis, which may cause an increase in AST, was not identified as a prognostic factor (P=0.070). This is consistent with another study [26] that identified AST as a prognostic factor, and suggests that serum AST could be a much stronger prognostic factor than liver metastasis.
Generating a generally applicable prognostic index is complicated by large variations in the incidence and mortality of gastric cancer globally, as well as substantial treatment variations in different countries. For example, gastric cancer represents only 1.3% of new cancers in the US, but accounts for 13% of all new cancers in China and the Western Pacific [2]. In addition, while only 2% of cancer-related deaths in the US are from gastric cancer, gastric cancer accounts for 15% and 14% of cancer-related deaths in China and the Western Pacific, respectively [2]. Moreover, considerable regional differences in treatment protocols exist [10]. It is therefore a strength of this analysis that it included not only a large number of patients, but also 27 (RAINBOW) and 29 (REGARD) countries from 6 continents [1617].
Discussions of statistical methods and limitations are addressed in detail within the supplementary material section (Supplementary Text 1). In addition, the results presented here are derived from clinical trial data of patients who had undergone selection processes. In general practice, patients may present with characteristics or conditions that could compromise the validity of the predictive models used here. Additional studies will be required to identify a simplified prognostic model that takes into consideration different patient characteristics or conditions. Furthermore, relevant clinicopathological parameters that affect the laboratory parameters may need to be considered for clinical application of this model.
In summary, individual responses to chemotherapy are largely variable, and many patients have disease progression after first-line chemotherapy [71012]. Second-line chemotherapy is not appropriate for all patients. Therefore, prognostic factors that can be applied with a high degree of confidence and across geographic regions become important decision-supporting tools. The identification of a prognostic index will help with appropriate treatment decisions, as well as enhance patient stratification in RCTs to achieve robust results. Several reports have demonstrated the feasibility and potential use of laboratory data in the stratification of patients in clinical trials [272829]. Our current study raises the importance of assessing novel tissue-based prognostic biomarkers for their discriminatory ability over and above the prognostic index identified here by easily obtainable clinicopathological parameters. The large variation in patient survival and widely differing prognostic profiles underscore the need for RCTs balancing these profiles between treatment arms to obtain unbiased estimates of treatment effects.
 XML Download