

 PDF
PDF ePub
ePub Citation
 Print
Print


INTRODUCTION
The Democratic People's Republic of Korea (DPRK) has conducted a Nutritional Examination Survey every two years since 1998, together with the aid of the United Nations Children's Fund (UNICEF) and World Food Program. There are two survey types of nutrition assessment report in the DPRK: Multiple Indicator Cluster Surveys (MICS) and National Nutritional Surveys (NS). The MICS is a survey sponsored by UNICEF to evaluate the results of the achievements and action plans of each nation for 10 years, and includes a mid-term evaluation. It has been active since the UN Convention on the Rights of the Child in 1990 to promote the well-being and welfare of children. The NS has been performed to provide and monitor basic data for program plans and executions conducted to rebuild infrastructure and food assistance at the initial phase of humanitarian assistance for the DPRK.
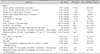
It was conducted without the assistance of international organizations independently in both 2000 and 2006. However, the data published in 2006 is not cited much, due to its low credibility. Since then, after a dormant period, it was resumed in 2009 in the name of the MICS, while the NS published in March 2012 was both the next publication and the latest survey report. This survey report was conducted September 17 to October 17, 2012, and it included 10 regions in the DPRK (including 40 clusters in each region) with 8,040 children at 0-59 months, and 7,649 mothers 15-49 years old. For the survey indicators, nutritional status, anemia, Mid-Upper Arm Circumference, multiple micronutrient supplements for pregnant women, dietary habits, and food diversity were selected as subjects and were divided into children and pregnant women. The main results are shown in Table 1 [1].
NUTRITIONAL STATUS OF CHILDREN UNDER FIVE YEARS OLD
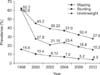
Since a low height is a symptom of long-term malnutrition, height-for-age was set as an indicator of stunting, while weight-for-height was set as an indicator of wasting, since weight can be reduced because of a short-term food intake reduction. "Underweight" refers to weight-for-age, which was set as an indicator of wasting and stunting.
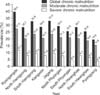
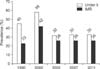
The 2012 survey showed improved results overall compared to 2009 (Fig. 1) [1,2,3,4,5,6,7]. However, regional deviation became more severe. For example, Ryangangdo, where stunting prevalence was the highest, showed 43% in 2004 to 39.6% in 2012, which is a decrease of 3.4%. Meanwhile, Pyongyang, where stunting prevalence was the lowest, showed 24% in 2004 and 15.6% in 2012, revealing an 8.4% decrease. This result shows that it is urgently necessary to assist Ryangangdo, Hamgyongnamdo, and Jagangdo, which were chronically vulnerable districts in which stunting rates exceed 9-10%. Fig. 2 shows the regional prevalence of stunting in 2012 [1].
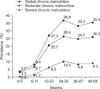
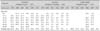
Fig. 3 shows the prevalence of stunting in 2012 by age, while Table 2 summarizes the trends by age since 1998 [1,2,3,4,5,6,7]. It is noted that the recovery rate of stunting stagnated after two years old, despite the overall reduction of prevalence. The prevalence of stunting in 24-35 months old children showed an increasing trend from 32.1% in 2009 to 36.8%. A period of about 1,000 days from pre-pregnancy to 24 months of age that can prevent children from developing stunted growth is called the window of opportunity, and it indicates that the early intervention of nutritional assistance for pregnant women and infants is essential from the prenatal period to 24 months of age in which neurodevelopment is completed. Malnutrition in this period can result in irrevocable aftereffects, not only for physical growth, but also for developmental and cognitive statuses at later stages of life.
DEATH OF CHILDREN UNDER FIVE
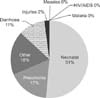
Cause of death (World Health Organization, 2010)
Around 35% of the cause of children's death around the world is related to malnutrition (Lanset Maternal and Child Undernutrition series 2008). In light of this finding, 4,000 children under five who have died early every year in the DPRK were in a state of under-nutrition before they died (Fig. 4) [8].
Children mortality
Children mortality under five has decreased. However, 11,406 children (31 children daily) still die before they reach their fifth birthday according to the State of the World's Children (SOWC) report in 2010. Approximately 6,000 children (16 children daily) die before they reach 28 days of age. Furthermore, approximately 289 women (five per week) die due to childbirth and related complications (Fig. 5) [8].
CHILDREN ANEMIA AND BREASTFEEDING
The incidence of child anemia in the DPRK was 28.7%, which is very high. This high incidence is likely associated with insufficient breastfeeding and supplemented food that contains low quality nutrients, and insufficient supplemented food intake. A low breastfeeding rate, maternal anemia, and malnutrition can also be attributed to main causes of high children anemia. Wasting children showed a high rate of anemia compared to children in a normal group, so the prevention of anemia can be an important measure that can prevent wasting.
CONCLUSION
The latest 2012 report for nutrition status of the DPRK showed the malnutrition and mortality rates of children in the DPRK have improved. However, the prevalence of the stunting reported is still a moderate-severe level and regional deviation became more severe. The 1,000 days between pregnancy and age two are window of opportunity for appropriate growth & development. So early nutritional assistance have high importance.
 XML Download