

 PDF
PDF ePub
ePub Citation
 Print
Print


INTRODUCTION
Colorectal cancer (CRC) is the third most common cause of cancer-related death in the world,12 with development of peritoneal carcinomatosis in 10% to 30% of patients.34 In Eastern Asia, CRC occurs in more than 37.0 per 100,000 individuals per year and accounts for approximately 207,700 annual deaths.5 Although the recent development of new drugs including biologic agents has caused an increase in the overall survival rate of CRC, the median overall survival of patients with metastatic CRC is less than 30 months.67 Especially, CRC patients with peritoneal metastasis have a poor prognosis with a median survival of 6 to 8 months.89 Therefore, early diagnosis and management of peritoneal metastasis in patients with CRC are important in clinical practice.
Peritoneal fluid is a sign of peritoneal metastasis, which suggests the presence of malignant cells in the peritoneal cavity. Malignant ascites accounts for approximately 10% of all peritoneal fluid causes.10 The formation of peritoneal fluid from cancer is a complex and multifactorial process. The mechanism of the accumulation of fluid in the intraperitoneal space associated with cancer appears to be secondary to a combination of increased vascular permeability and impaired lymphatic drainage.11 The patients with stage IV CRC who have peritoneal metastasis are most likely to have peritoneal fluid, whereas the patients with stage I–III CRC are rarely likely to have peritoneal fluid. However, a little peritoneal fluid is occasionally observed during the operation of patients with stage I–III CRC, and to date, there are few data on the peritoneal fluid detected during operation of these patients.
CEA is a glycoprotein normally produced in gastrointestinal tissue during fetal development, and the production of CEA ceases after birth.12 Therefore, the level of CEA is very low in the blood of healthy adults and is a useful tumor marker for gastrointestinal cancer.12 Several studies have reported that the assessment of CEA in peritoneal fluid (pCEA) has a diagnostic value for patients who have peritoneal fluid.131415 Further, the levels of pCEA and positive cytology in peritoneal fluid have prognostic significance for CRC patients.161718
In this study, we aimed to identify the clinical significance of pCEA detected during operation in patients with stage I–III CRC.
METHODS
1. Patients
Between April 2009 and April 2015, the medical records from a total of 60 patients with stage I–III CRC who had peritoneal fluid assessed during operation were retrospectively reviewed. Patients who were histologically confirmed to have CRC were included, and patients who had positive cytology in the assessment of peritoneal fluid or had distant metastasis on preoperative imaging studies including abdominal CT and chest CT were excluded. Detailed clinical data including age, gender, tumor location, histopathology, tumor stage, nodal stage, and use of chemotherapy were collected. All blood samples were taken at the time of admission for initial diagnosis. This study was approved by the Institutional Review Board of Kosin University Gospel Hospital (IRB No. 2017-06-022) and informed consent was waived.
2. Collection and Assessment of Peritoneal Fluid
At the time of operation, any present peritoneal fluid was aspirated by 50 mL syringe. The amount and color of aspirated peritoneal fluid was recorded, and the collected peritoneal fluid was analyzed for cytology and tumor markers. For cytologic examination, the collected peritoneal fluid was centrifuged and smeared on slides and fixed with cytospray, and Papanicolaou and Giemsa staining were performed. The levels of pCEA and CEA in serum (sCEA) were measured by electrochemiluminescent immunoassay (ECLIA) on a Cobas e-601 analyzer (Roche Diagnostics, Mannheim, Germany).
3. Statistical Analysis
Statistical analyses were performed using IBM SPSS version 23.0 (IBM Corp., Armonk, NY, USA). Cutoff values, sensitivity, and specificity of pCEA for prediction of recurrence were evaluated using receiver operating characteristic (ROC) curves. We divided the included patients into 2 groups according to the optimal cutoff value of pCEA to predict recurrence and compared the clinical parameters of the 2 groups. Student t-test and the chi-square test were performed for continuous and categorical variables, as appropriate. Pearson's correlation analysis was used to evaluate the relationship between pCEA and sCEA. Cancer-free survival (CFS) was measured from the date of CRC diagnosis to the date of recurrence or final follow-up. The recurrence of CRC was diagnosed with radiological and endoscopic histopathological data. Kaplan-Meier curves were used to construct survival curves based on cumulative incidences and compared using the log-rank test. A Cox proportional hazards regression model was used to assess factors affecting elevated pCEA level and poor CFS. P-values less than 0.05 were considered statistically significant.
RESULTS
1. Baseline Characteristics
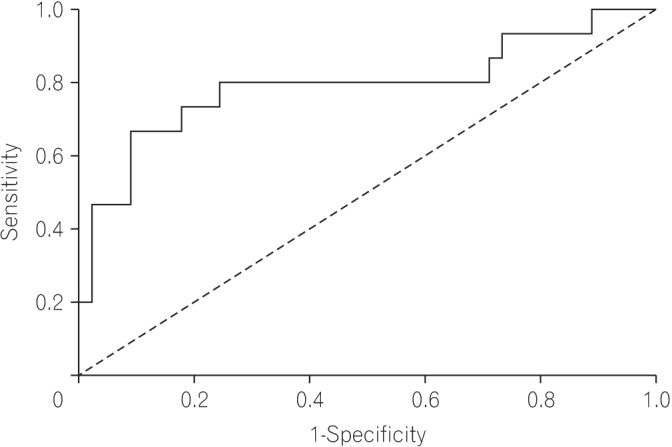
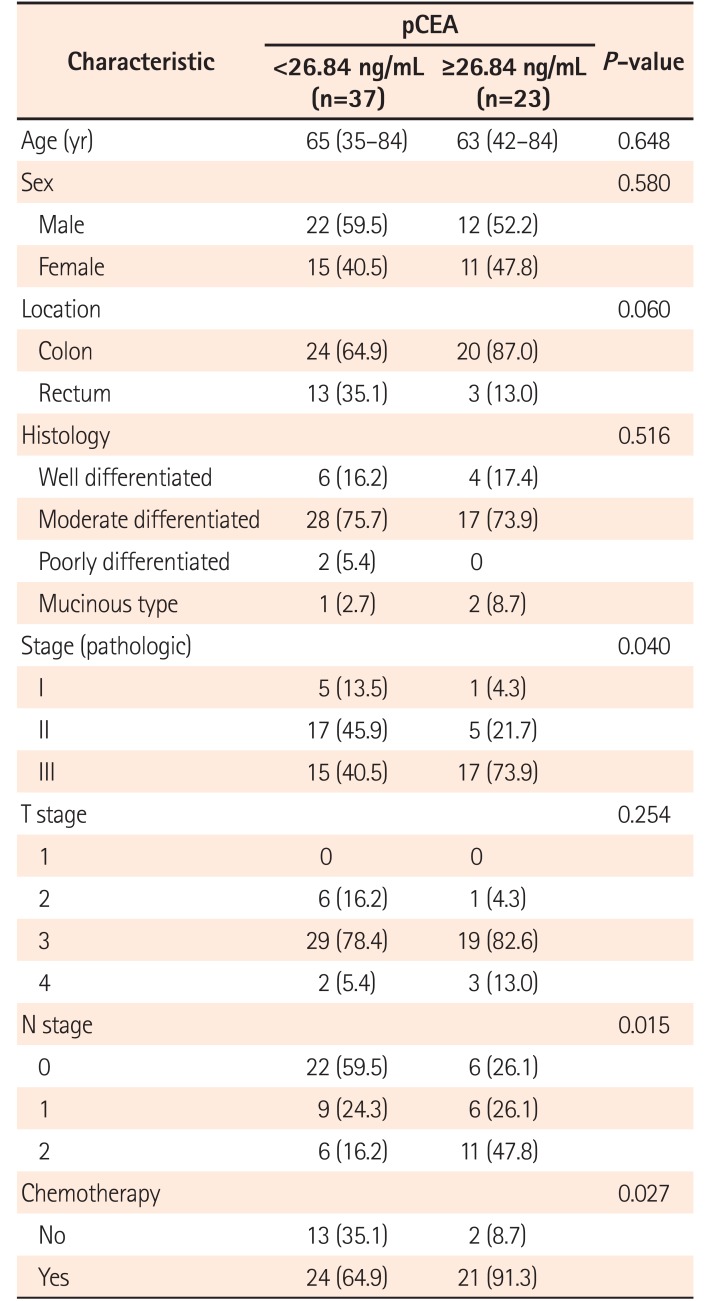
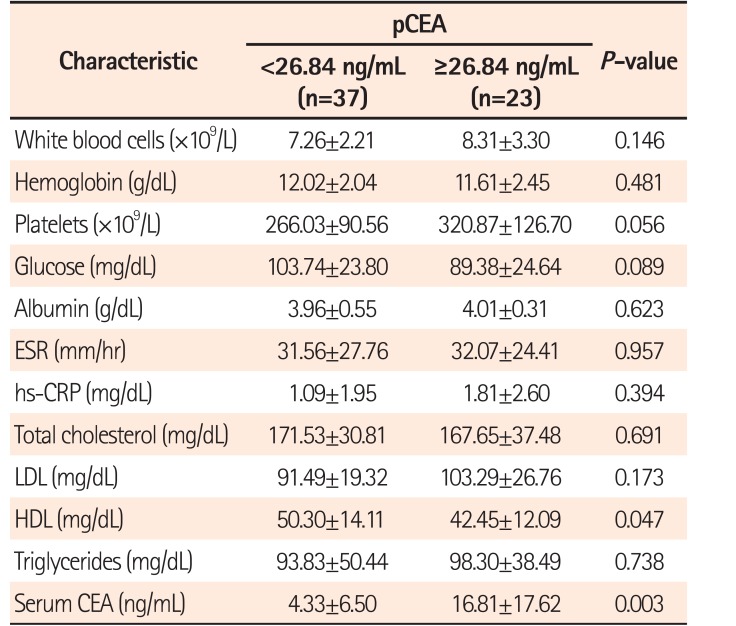
A total of 60 patients between April 2009 and April 2015 were included. Their median age was 64 years (range, 35–84 years), and 34 patients (56.7%) were male. The median follow-up duration was 37 months (interquartile range, 21–50 months). On ROC analysis, the pCEA had the largest area under the curve (0.793; 95% CI, 0.635–0.950; P=0.001) with an optimal cutoff value of 26.84 (sensitivity, 80.0%; specificity, 76.6%) for predicting recurrence (Fig. 1). Patients were classified into 2 groups based on the optimal cutoff value of the pCEA: high pCEA group (≥26.84, n=23) and low pCEA group (<26.84, n=37). Baseline clinical characteristics and baseline laboratory findings according to optimal pCEA level are summarized in Tables 1 and 2, respectively.
2. Recurrence Rate According to pCEA Level and Pathologic Stage
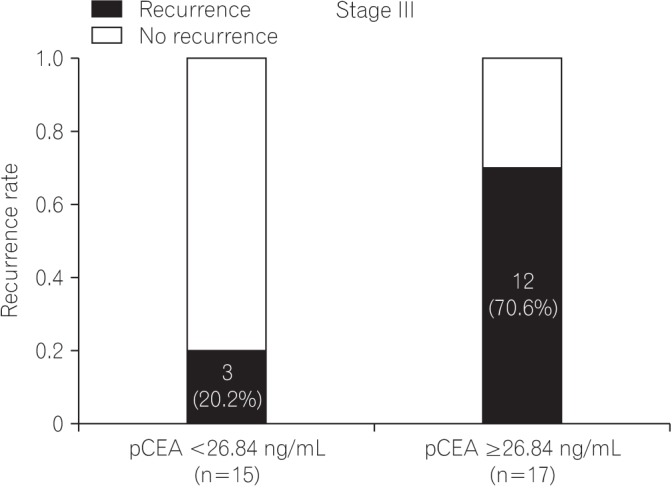
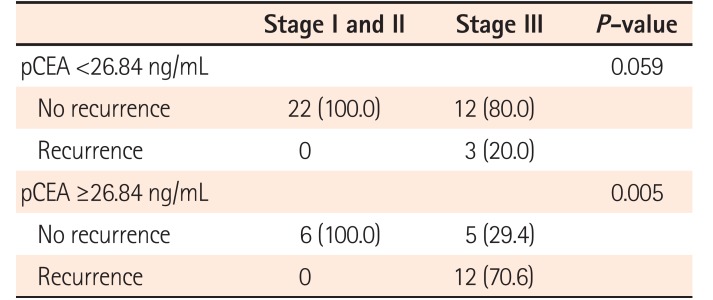
A total of 15 patients experienced CRC recurrence. The recurrence rates were 8.1% in the low pCEA group and 52.2% in the high pCEA group. Patients with recurrence of CRC were all stage III CRC, and patients with stage I or II CRC did not have recurrence of CRC (Table 3). In the low pCEA group, patients with stage I or II CRC did not have recurrence of CRC, whereas patients with stage III had a 20.0% recurrence rate. In the high pCEA group, patients with stage I or II CRC did not have recurrence of CRC, whereas patients with stage III had a recurrence rate of 70.6% (Fig. 2).
3. Factors Affecting Elevated pCEA Level
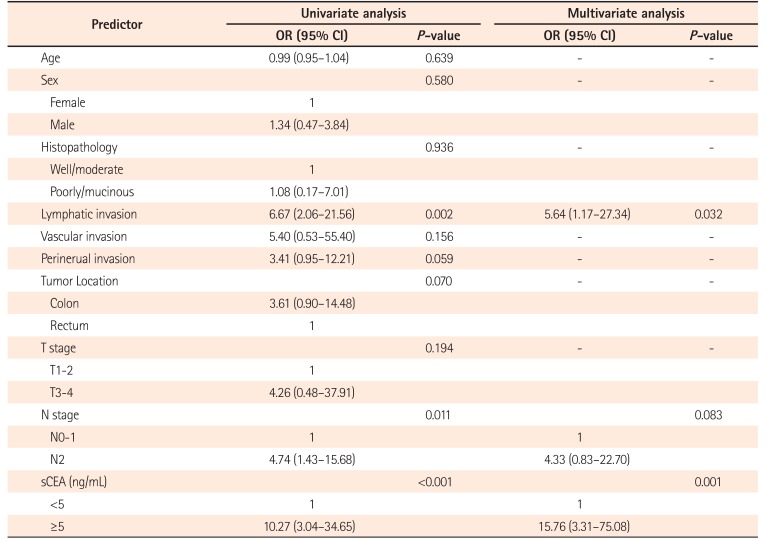
Logistic regression analysis was performed to assess the factors affecting elevated pCEA level (Table 4). In the univariate analysis, lymphatic invasion, N stage and sCEA were significant factors affecting elevated pCEA level. In multivariate analysis, lymphatic invasion (OR, 5.64; 95% CI, 1.17–27.34; P=0.032) and sCEA (OR, 15.76; 95% CI, 3.31–75.08; P=0.001) were significantly associated with elevated pCEA level.
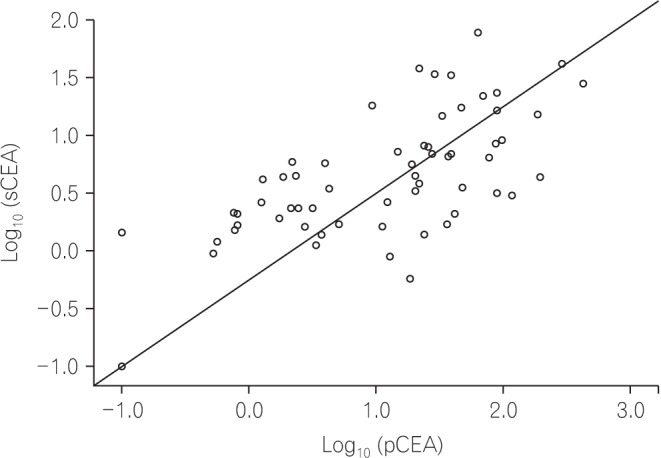
Pearson's correlation analysis was also performed to evaluate the correlation between pCEA and sCEA. The levels of pCEA and sCEA were converted to log values and analyzed, because the original levels of pCEA and sCEA were too high to analyze the correlation. As shown in Fig. 3, pCEA and sCEA had a positive correlation (r=0.656, P<0.001) in this study.
4. Comparison of Long-Term Outcomes According to pCEA
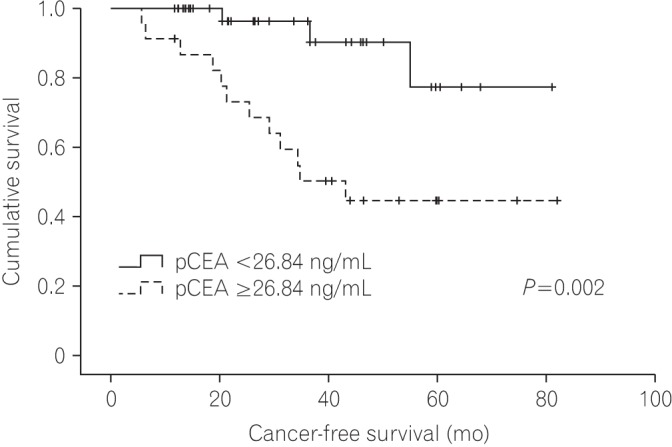
Fig. 4 shows the Kaplan-Meier curve of the CFS for patients according to pCEA. The CFS of the low pCEA group was better than that of the high pCEA group (P=0.002), and the 5-year CFS rates of the low pCEA group and high pCEA group at 5 years were 77.4% and 44.6%, respectively.
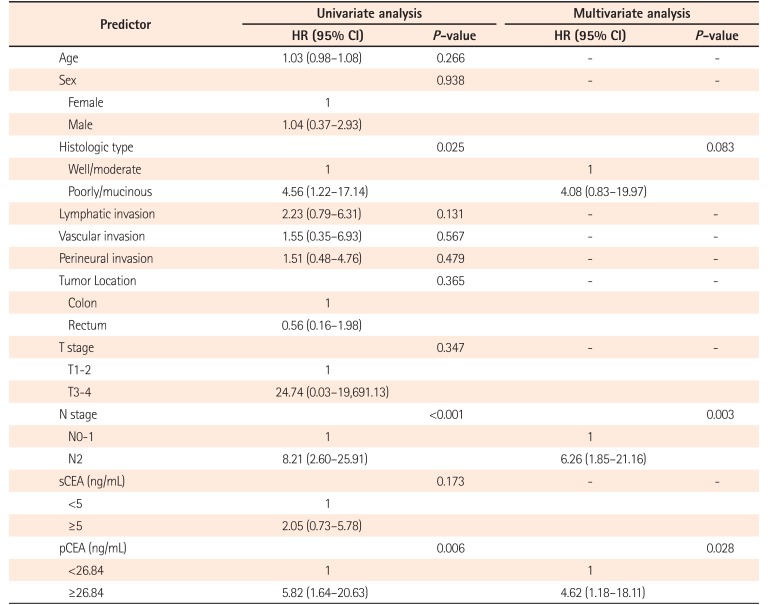
Univariate and multivariate analysis using Cox proportional hazards regression model were performed to identify the factors affecting poor CFS. As shown in Table 5, in multivariate analysis, N2 stage (hazard ratio [HR], 6.26; 95% CI, 1.85–21.16; P=0.003) and high pCEA (HR, 4.62; 95% CI, 1.18–18.11; P=0.028) were associated with poor CFS.
DISCUSSION
In this study, we evaluated the clinical significance of pCEA in stage I–III CRC patients who had peritoneal fluid collected during operation, but had negative cytology. Compared with previous studies that evaluated the effects of pCEA on CRC patient outcomes, our study showed the long-term outcomes of pCEA in stage I–III CRC patients with incidentally detected peritoneal fluid during operation. We determined that stage I–III CRC patients with high pCEA had poor CFS. According to the results of this study, high pCEA could be helpful to predict poor prognosis in patients with stage I–III CRC.
Peritoneal carcinomatosis is one of the most frequent metastatic patterns in patients with advanced CRC.19 Peritoneal fluid is commonly present in patients with stage IV CRC who have peritoneal metastasis, because the peritoneal metastasis of cancer cells could cause the formation of peritoneal fluid. However, there is little data from the peritoneal fluid that is occasionally found during the operation of the patients with stage I–III CRC. In this study, we hypothesized that peritoneal fluid detected during the operation of stage I–III CRC patients might be a significant predictor of recurrence. Between April 2009 and April 2015, we collected data from a total of 60 patients and found that the optimal cutoff value of pCEA for predicting recurrence was 26.84 (sensitivity, 80.0%; specificity, 76.6%). The recurrence rate was 8.1% in the low pCEA group and 52.2% in the high pCEA group (Fig. 2). Interestingly, the recurrence occurred only in patients with stage III CRC, regardless of the level of pCEA (Table 3). These results suggest that the level of pCEA in patients with stage I–III CRC could be an important clue to predict recurrence, and the pCEA of stage I or II CRC patients might have low clinical significance. In this study, eleven patients in the high pCEA group had no recurrence during the follow-up period. Although a longer follow-up period is needed, the patients with high pCEA might not always develop recurrence.
As shown in Table 2, the level of sCEA was higher in the high pCEA group than in the low pCEA group. The relationship of pCEA and sCEA had a positive correlation (Fig. 3), and sCEA was a significant factor to affect the elevated pCEA level (Table 4). However, sCEA was not a significant factor affecting poor cancer-free survival (Table 5). These results indicate that sCEA and pCEA might be closely related, but the clinical significance of sCEA affecting long-term outcomes in patients with stage I–III CRC where peritoneal fluid was detected during operation might be lower than that of pCEA.
Previous studies have reported that high pCEA and positive cytology are significantly predictive of poor prognosis in CRC patients.182021 Especially, the presence of positive cytology is an important factor for predicting poor outcomes in CRC patients.16172223 In this study, we included patients with stage I–III CRC who had peritoneal fluid collected during operation that was negative on cytology, and we demonstrated that N2 stage and high pCEA were significant factors predicting poor prognosis. Until now, there has been little data on pCEA with negative cytology, and our results suggest that high pCEA has a clinical significance for predicting prognosis in stage I–III CRC patients with negative cytology.
This study had some limitations. First, this study was retrospectively performed in a single center. Therefore, we could not avoid selection bias when collecting information on patients with stage I–III CRC. However, we tried to minimize any bias by repeatedly reviewing the medical records. Second, pathologic stage was significantly different between the low pCEA and high pCEA groups. The number of patients with stage II and III CRC in the high pCEA group was higher than that in the low pCEA group; therefore, this study could not exclude partial effects related to cancer stage. Third, the follow-up duration and the number of patients in this study might be insufficient to assess the presence of recurrence in the enrolled patients. To overcome these limitations, further well-designed prospective studies are needed.
In conclusion, our study showed that high pCEA was helpful in predicting poor CFS in stage I–III CRC patients who had peritoneal fluid detected during operation and had negative cytology. Based on the results of this study, we suggest that the assessment of pCEA in stage I–III CRC patients with peritoneal fluid is important for predicting long-term outcomes.
 XML Download