

 PDF
PDF ePub
ePub Citation
 Print
Print


I. Introduction
Accurate diagnosis is the most critical assignment in planning orthognathic surgery, and conventional lateral cephalometry has been the standard for evaluation and orthodontic diagnosis of maxillofacial deformity since the early 1930s1. Various methodologies have been introduced, and normal average value (norm) for corresponding analysis has been reported2. Analysis of lateral cephalometry includes the analysis of angle and length of hard tissues and soft tissues of the face and is the most commonly used method3. However, two-dimensional (2D) lateral cephalometry is associated with many problems. First, it is difficult to achieve accurate identification due to landmark overlap4,5,6. Second, it is difficult to clearly reflect the difference between the right and left sides of the face. Third, there is a fundamental problem in that a three-dimensional (3D) subject is illustrated in two dimensions7.
In addition, weaknesses of 2D lateral cephalometry have been reported including low concordance with results of actual clinical evaluation8,9. Conventional lateral cephalometry has another limitation in that deficiency in the paranasal and infraorbital areas cannot be accurately demonstrated.
3D facial analysis has been presented to solve such shortcomings and can be used to achieve simulation treatment for 3D operation and orthodontic processes10,11,12,13. Systems have been established for normal average values, landmarks, reference lines, and reference planes, all of which can serve as standards of analysis14. If a landmark is defined for 3D analysis, such landmarks should be used for 2D analysis in most cases. This is because lateral cephalometry analysis has been widely performed, and the massive amount of data accumulated can be effectively used for 3D analysis15. However, few studies have analyzed whether 3D analysis agrees with the large amount of 2D data.
In this regard, this study analyzed the concordance and patterns between eight angles measured using lateral cephalometry as well as 3D computed tomography (CT) images. In addition, it also aims to identify a 3D Frankfort horizontal (FH) plane with a high degree of concordance to the 2D plane by studying four FH planes.
II. Materials and Methods
1. Patient selection and data collection
The study population consisted of 20 patients who visited the Department of Oral and Maxillofacial Surgery, Samsung Medical Center (Seoul, Korea) in 2012 who underwent lateral cephalometry (Planmeca ProMax; Planmeca Oy, Helsinki, Finland) and 3D CT (GE LightSpeed VCT XT; General Electronic Medical System, Milwaukee, WI, USA) imaging. All patients were skeletally mature and no longer growing. In total, 20 patients were selected among whom there were 12 males and eight females with an average age of 23.2 years.
The area from the nasal bone to the mandible was included in the image, and the axial slice thickness was 1 mm. During CT scanning, the jaw and teeth were maintained in centric occlusion. Facial bone CT was taken with the patient in a supine position. After completion of CT scanning, the images were saved as digital imaging and communication in medicine (DICOM) files. CT images were also reconstructed to produce 3D images using Simplant Pro 2011 (Materialize Dental NV, Leuven, Belgium).
The following patients were excluded: those with severe congenital malformation, such as hemifacial microsomia, those with pathological lesions of the jaw, and those with severe inflammation.
In the reconstructed 3D image, lines, planes, and angles were set as follows, and the FH plane was the horizontal reference plane in this study.
Lateral cephalometry images were analyzed using V-ceph 5.5 (CyberMed Inc., Seoul, Korea). All analysis was performed by a single investigator.
2. Concordance evaluation between the FH planes defined on 2D and 3D systems
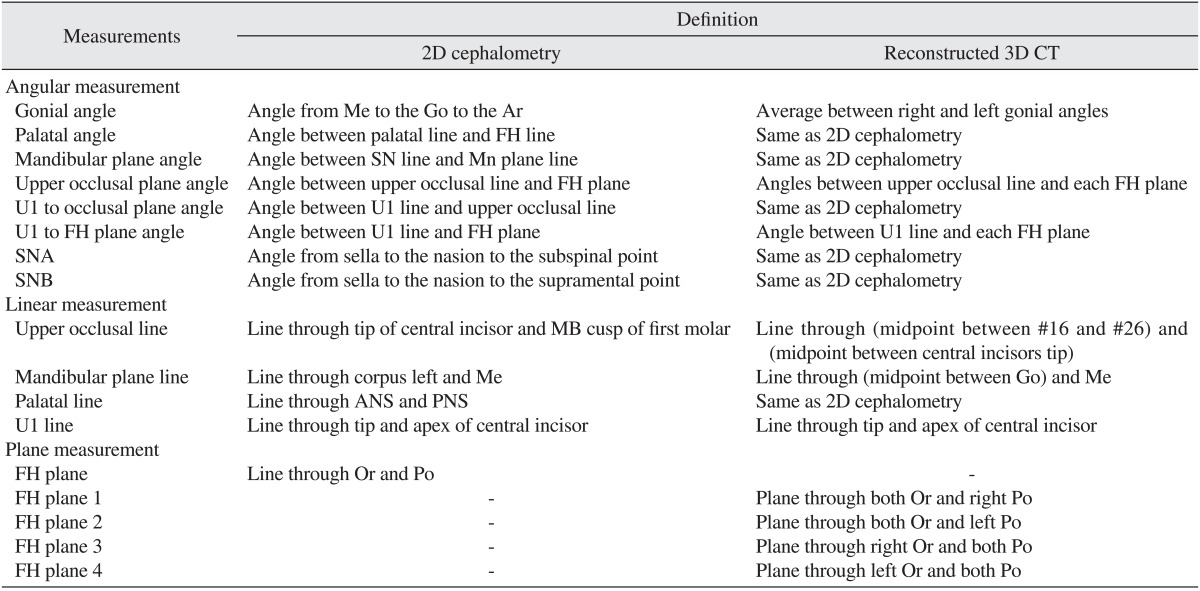
The FH plane on lateral cephalometry was defined with the lines passing the orbitale (Or) and porion (Po), and the upper occlusal plane angle (UOPA) was measured. Four FH planes (Table 1) were established in the 3D system, and the UOPA of each point was measured. The angles measured in 3D and lateral cephalometry were evaluated with regard to intraclass correlation coefficient (ICC) with IBM SPSS Statistics 21.0 (IBM Co., Armonk, NY, USA).
3. Concordance evaluation between measured angles from 2D and 3D systems
(1) Gonial angle (GA), (2) palatal angle, (3) mandibular plane angle (MPA), (4) UOPA, (5) U1 to occlusal plane angle (U1OPA), (6) U1 to FH plane angle (U1FHPA), (7) SNA, (8) SNB were measured both in lateral cephalometry and reconstructed 3D CT (Table 1) and were evaluated with regard to ICC.
III. Results
1. Concordance evaluation between FH planes defined on 2D and 3D systems
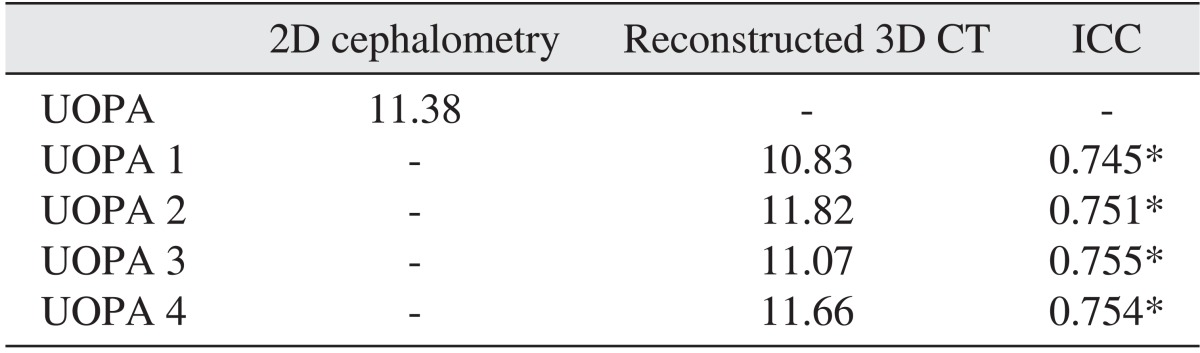
On lateral cephalometry, the average UOPA was 11.38°. When the concordance of UOPA against the four FH planes on 3D was evaluated, the ICCs showed high concordance with 0.745, 0.751, 0.755, and 0.754, respectively. The results were not significantly different. The ICC differences among the four angles acquired in 3D were also not significant different.(Table 2)
2. Concordance evaluation between measured angles from 2D and 3D systems
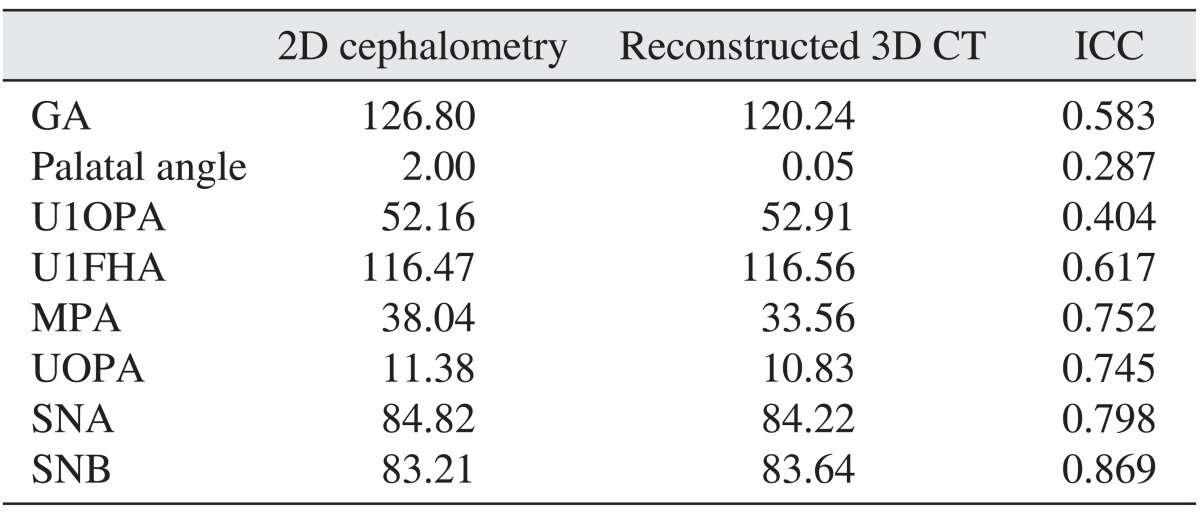
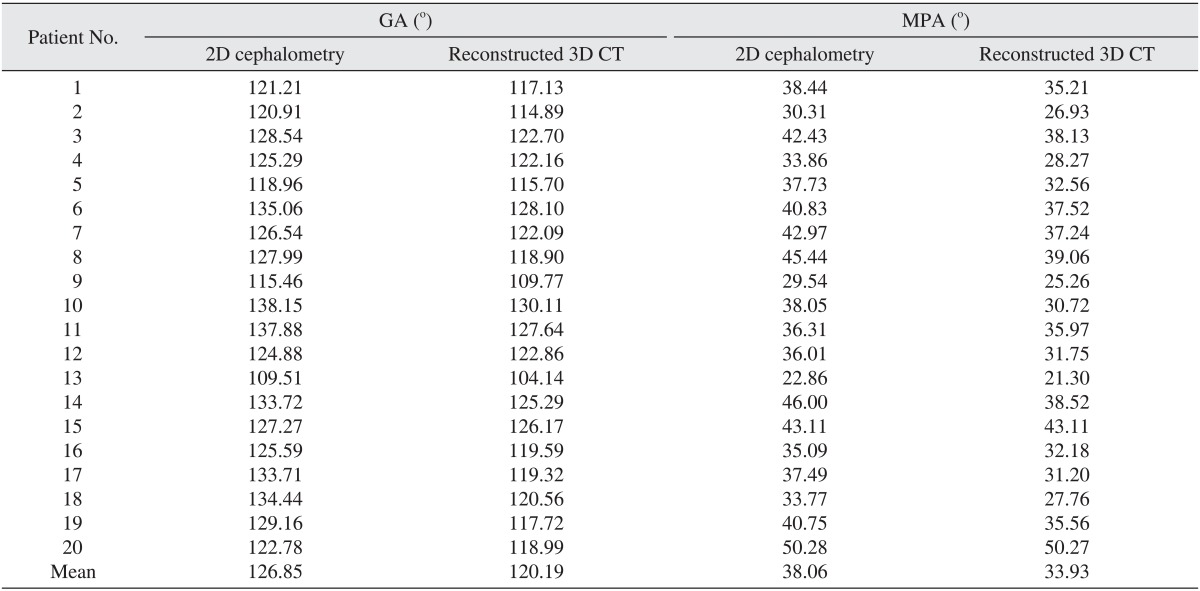
Concordance of the average of eight angles was verified.(Table 3) ICCs of GA, palatal angle, U1OPA, and U1FHPA were low at 0.583, 0.287, 0.404, and 0.617, respectively. Thus demonstrating a low concordance between lateral cephalometry and 3D CT. On the other hand, ICCs of MPA, UOPA, SNA, and SNB were high at 0.752, 0.745, 0.798, and 0.869, respectively. Additionally, GA and MPA acquired in 2D were larger than those in 3D for all 20 patients included in this study.(Table 4)
IV. Discussion
Two-dimensional cephalometry has been widely used for diagnosis and operation in craniofacial skeletal development and orthodontic and orthognathic surgeries13,16. This analysis has been used to analyze lines and angles on an image. The measured values from the patients can be compared with generally known normal values to judge the asymmetry17. In lateral cephalometry, however, it is difficult to distinguish the overlapping structures; in patients with an asymmetric face, the accuracy of analysis is low. Consequently, it is desirable to also use other radiographic images in order to achieve more accurate analysis.
To evaluate the asymmetry of a face, panorama radiography18 and posteroanterior cephalometry have been traditionally used with lateral cephalometry. Panorama radiography is the most familiar technique to most dentists and orthodontists, and it is the representative examination for dental diagnosis and treatment planning. This type of imaging enables dentists to detect cysts and tumors, supernumerary teeth, missing teeth, and bony deformities and to evaluate the asymmetry of the lower jawbone19,20. Updegrave21, however, reported that an incorrect treatment plan may results from serious asymmetry of the mandible ramus and condyle and coronoid processes on panorama radiography. Other authors have reported difficulty in analyzing the face with panorama radiography22. Posteroanterior cephalometry has the same problem in that precise perception is difficult because of many landmark overlaps13. As such, there are limitations to the evaluation of 3D structures on 2D radiographic images.
However, no overlapping landmarks are produced in 3D imaging, minimizing the confusion of left- and right-side structures. Therefore, with 3D CT imaging, clinicians can diagnose all patients accurately including those with facial asymmetry, easily identify the shapes of craniofacial structures, and recognize the shapes of bones and soft tissues from various angles. According to previous studies measuring length on volume-rendered 3D CT images and in cadavers23, the difference in length between two groups was minimal, confirming the accuracy of 3D-CT images. Hildebolt et al.24 also reported accuracy of measurement on 3D CT.
In addition, 3D lateral cephalometry analysis abstracted from 3D CT was introduced, and its accuracy has been reported. van Vlijmen et al.1 performed comparative analysis on various angles and distances between 3D lateral cephalometry and conventional lateral cephalometry and reported that there was no statistically significant difference in many parts.
It is true that lateral cephalometry analysis has been the major method to evaluate facial types for tens of years15,25. 3D CT analysis, a very useful method in diagnosis, uses the same landmarks as conventional lateral cephalometry15. However, the concordance between the measurements of lateral cephalometry and 3D CT has not been sufficiently studied. Using the relationship and patterns of measurements acquired from two analysis methods, as well as their concordance, 3D CT values can be determined from the values of lateral cephalometry analysis. Thus, accumulated lateral cephalometry values can be converted to 3D. However, few cases have performed a clear comparison between the two methods.
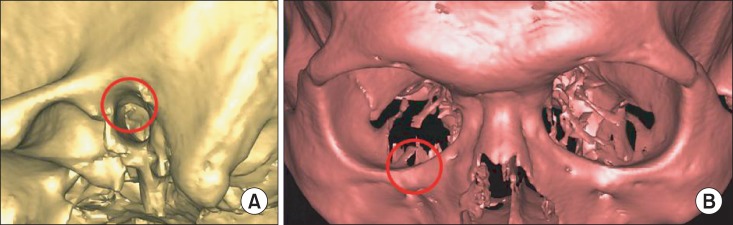
The UOPA abstracted from the FH plane defined in 3D CT and that from lateral cephalometry were found to be very similar.(Table 2) Similarly, the four 3D FH planes did not show differences in concordance with those of 2D analysis. In such cases, it is desirable to choose landmarks with higher representation and reliability. In a study by Yu et al.26, two observers marked lateral cephalometry landmarks three times and calculated the concordance with respect to the x-axis and y-axis. In this experiment, Po showed the lowest concordance among 17 landmarks on the x-axis, while Or did not show a significant difference in concordance among observers or among trials of the same observer. Additionally, when defining Po on 3D CT, a wide curve is produced, making repetition and reproduction difficult.(Fig. 1) Based on these results, it is reasonable to define the FH plane in 3D using two Or and one Po values.
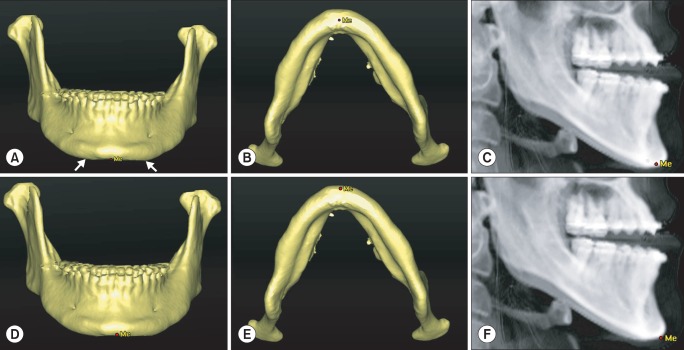
According to the results of this study, GA measured on 2D is larger than that measured on 3D in all patients.(Table 4) There are three possible explanations. First, the difference may be because of error in menton (Me). When marking Me on 3D CT (Fig. 2B) and observing the resulting 3D lateral cephalometry, Me marked on the superior position that Me on conventional lateral cephalometry.(Fig. 2C) This occurs because anatomic structures near the Me are extended in the lower direction on 3D CT.(Fig. 2A) In patients with such structures, the 3D values may be different from those on 2D even when Me is accurately marked on 3D CT. Additionally, when Me is marked at the front of skull, it may be marked in a little superior position (Fig. 2D), and it may lead to erroneous underestimation of GA and MPA. Thus, when Me is marked on 3D CT, it is recommended to approach from the bottom of the lower jawbone.
Second, articulare (Ar) may have larger x-axis error on lateral cephalometry compared with 3D CT. Trpkova et al.7 confirmed through meta-analysis that Ar and basion showed the largest x-axis errors on lateral cephalometry. The possibility of lower accuracy of GA cannot be excluded because of lower accuracy of the reference points.
Third, Ar defined in 3D is different from the definition in 2D. Ar on lateral cephalometry is defined as the point of overlap between the skull base and posterior surface of the lower jawbone condyle, while Ar in the present study is defined as the most posterior point of the mandibular condyle. Thus, it is difficult to assert that Ar in this study is absolutely concordant with Ar on 2D. However, it is impossible to define Ar in 3D using the same definition of that in 2D. Therefore, if Ar is defined using the method of this study, GA in 2D is slightly larger than that in 3D CT.
MPA, just like GA, was larger in 2D than in 3D in all patients. This can be explained by the abovementioned problems associated with Me.
The angles showing low concordance were palatal angle, U1OPA, and U1FHPA.(Table 3) An angle is made by two lines; if the lines are short, the measurement is more difficult, and the risk of error increases, which lowers the probability of repetition and reproduction and consequently the probability of concordance. The straight palatal line and U1 line used to define the aforementioned three angles had short distances, which resulted in their lower concordance values. On the other hand, MPA, UOPA, SNA, and SNB were formed by two long lines and so showed higher concordance.
V. Conclusion
For measurement of angles made up of two long lines, the concordance between two methods is high. In this study, we showed high concordance for MPA, UOPA, SNA, and SNB. When Me was included in the analysis, it was marked in a different location from that of 2D analysis because of the nature of the measurement points. Additionally, the FH plane on 3D CT showed concordance with the FH plane on lateral cephalometry, indicating no difference in concordance no matter what is selected among four FH planes defined on 3D CT. However, it is desirable to define the FH plane on 3D CT with two Or and one Po values considering the reproduction of Or itself.
 XML Download