

 PDF
PDF ePub
ePub Citation
 Print
Print


INTRODUCTION
The primary stability of the implant is regarded as an important factor for obtaining osseointegration and determining the timing of prosthetic loading [123]. Primary stability is achieved by mechanical engagement between the implant and host bone at the time of implant placement. Thus, implant macrodesign (e.g., geometry, length, and diameter), and bone quantity and quality influence primary stability [3456]. Surgical skill has also been demonstrated to be a significant factor for primary stability. From a clinical perspective, obtaining good primary stability saves time and reduces morbidity.
The posterior maxilla is still a challenging area for dental implants in many ways. Together with sinus pneumatization, this area generally presents low bone density and thin cortical bone, which are all unfavorable for achieving good primary stability. To overcome such limitations, several pioneers have recommended bicortical fixation, which provides additional anchorage in the cortical bone of the sinus floor by penetrating the sinus [78]. Previous studies demonstrated that bicortical fixation increased bone-to-implant contact and reduced stress in a situation with poor bone quality [910]. Indeed, bicortical fixation, to date, has been regarded as a good surgical technique for treating the posterior maxilla. However, we cannot always take advantage of bicortical fixation due to variation in anatomical conditions, such as residual bone height (RBH) and the absence of a cortical plate [11].
Several methods have been introduced for measuring stability, including histological analysis, the percussion test, radiographs, reverse torque, cutting resistance, the Periotest value (PTV), and resonance frequency analysis (RFA) [14612]. Among these methods, the commonly applicable methods in a clinical and experimental setting are insertion torque (IT), removal torque (RT), PTV, and RFA.
Torque, that is, rotation resistance, can be measured easily with a torque gauge during implant insertion and removal. However, recording the exact value of IT may not be feasible during implant surgery, and RT measurement in particular is highly invasive. The Periotest was originally developed for the assessment of periodontal pathosis, occlusal loading, and ankylosis in natural teeth, but its indication expanded for evaluating the osseointegration of dental implants. The Periotest shows a value ranging from –8 to +50 (PTV) by measuring the deceleration of a tapping head [13]. The ranges of PTV reportedly have different meaning: -8 to 0, good osseointegration; 1 to 9, a borderline implant requiring clinical examination; ≥10, insufficient osseointegration [13]. Compared to IT, RT and PTV, RFA is commonly recognized as a more practical and accurate tool for evaluating implant stability. However, the device for RFA is expensive, and a special connector to the implant fixture, that is, a transducer or Smartpeg (Osstell AB, Gothenburg, Sweden), is required. The principle of an RFA device is that, by reading the vibration from the pulse-generating device, the resonance frequency value (in hertz) is converted into an implant stability quotient (ISQ) [1]. Presentation of a higher ISQ value can be regarded as an indication of greater implant stability [14].
In the present study, we simulated the posterior maxilla in a manufactured bone model. This model focused on anatomical situations affecting the primary stability of the implant, such as cortical conditions—that is, mono- and bicortical conditions—and RBH. Four different implant stability measurements (ISQ, PTV, IT, and RT) were used to determine the effects of cortical conditions and RBH. Additionally, the correlation among the measuring methods was investigated.
MATERIALS AND METHODS
Polyurethane specimens
Solid rigid polyurethane blocks (Sawbones; Pacific Research Laboratories Inc., Vashon, WA, USA) were used for the present study. The density of the block simulating maxillary cancellous bone was determined to be 0.32 g/cm3 with reference to previous studies [1516]. For the cortical layer of the maxilla, epoxy sheets (Sawbones; Pacific Research Laboratories Inc., Vashon, WA, USA) filled with short fibers were constructed to a thickness of 1 mm, considering previous studies that showed cortical bone thickness (1.49±0.34 mm) and the inferior border thickness of the maxillary sinus (0.86±0.21 mm) [1718]. The dimensions of each block were 3 cm×3 cm×the designated height.
Monocortical and bicortical models were designed, and blocks simulating four different bone heights (3, 5, 8, and 12 mm) were constructed as subgroups in both models (Figure 1). The monocortical models had a single cortical plate on the side opposite to the crest, which was analogous with a maxillary posterior lacking crestal bone. The cancellous bone blocks, 2-, 4-, 7-, and 11-mm-thick, were laminated with 1 mm of cortical bone on the site opposite to the crest; producing 3-, 5-, 8-, and 12-mm-thick bone blocks (subgroups M3, M5, M8, and M12).
Figure 1
Schematic drawings of the designed models. The thin dark layers represent cortical bone layers of 1 mm in thickness. B and M indicate bicortical and monocortical conditions, respectively. The numbers following the B or the M indicate bone height. (A) The B3 group: bicortical bone, 3 mm in height, (B) the B5 group: bicortical bone, 5 mm in height, (C) the B8 group: bicortical bone, 8 mm in height, (D) the B12 group: bicortical bone, 12 mm in height, (E) the M3 group: monocortical bone, 3 mm in height, (F) the M5 group: monocortical bone, 5 mm in height, (G) the M8 group: monocortical bone, 8 mm in height, (H) the M12 group: monocortical bone, 12 mm in height.
The bicortical models had cortical plates on both crestal and opposite sites. The cancellous bone blocks in 1-, 3-, 6-, and 10-mm-thick versions were laminated with 1 mm of cortical bone on both sides; also producing 3-, 5-, 8-, and 12-mm-thick bone blocks (subgroups B3, B5, B8 and B12). In the B3 group, the cancellous bone density was set to 0.48 g/cm3 due to the technical limitations of creating thin cancellous bone of 1 mm in thickness.
Because this was an exploratory study using a new experimental model, the sample size was tentatively chosen to be 10 specimens per group, and therefore, 80 bone blocks in total were used for this study.
Implants
Screw-shaped implants for internal connection were used (Superline; Dentium, Seoul, Korea). These implants were tapered and self-tapping, and their surfaces were sandblasted with large grit and acid etching. All implants measured 4.3 mm in middle diameter, 4.5 mm in platform diameter, and 10 mm in length.
Preparation of the implant bed
The polyurethane bone blocks were fixed with a vise. Osteotomy was prepared in the centers of each block. The drilling was performed according to the manufacturer’s instructions: a Ø 2.2-mm twist drill followed by Ø 2.6-mm drill, Ø 2.85-mm drill, Ø 3.3-mm drill, Ø 3.85-mm drill, and 4.5-mm countersink drill (Dentium, Seoul, Korea). The drilling was performed at 1,200 rpm (Surgic XT plus, NSK, Kanuma, Japan).
Measurement of insertion torque
When inserting the implant fixture, the peak insertion torque values were measured with a digital torque gauge instrument (MG series; Mark-10 Corporation, New York, NY, USA) with a measurement range of 0 to 135 Ncm.
Resonance frequency analysis
RFA was performed using Osstell ISQTM. A #7 Smartpeg was connected to the fixture with hand-tightening force. For each implant, ISQ values were measured in 4 different directions (every 90°). The ISQ values from 4 directions were averaged.
Periotest analysis
After the ISQ measurements, the Smartpeg was removed, and the healing abutment was connected (4.5 mm in diameter, 3.5 mm in height). Using the Periotest M (Medizintechnik Gulden e. K., Modautal, Germany), PTV was measured 3 times in 4 directions.
Measurement of removal torque
The removal torque was applied longitudinally to the bone block and gradually increased (displacement; 0.5 mm/min), and the point at which the specimen became unfastened was recorded (MG series; MARK-IO Corporation, New York, NY, USA).
Statistics
A statistical software program (SPSS Statistics 21.0, IBM Corp., Armonk, NY, USA) was used. The Shapiro-Wilk test and Levene test were performed for testing normal distribution and the homogeneity of the variance, respectively. A two-factor (2×4) analysis of variance (ANOVA) was used to determine the effects of different bone heights on the mono- and bicortical conditions at an alpha level of 0.05 initially, followed by post-hoc Tukey tests. Two-factor ANOVA revealed significant interaction between two factors, and we decided to additionally examine the simple main effect of the bone height and the mono- and bicortical conditions, respectively. The alpha level was corrected to control for type I error: 0.0125 (0.05/4) for the difference between mono- and bicortical conditions (a total of 4 comparisons for each bone height), and 0.025 (0.05/2) for the difference among 4 bone heights (2 comparisons for each mono- and bicortical condition). For bone height, post-hoc pairwise comparison was performed using Bonferroni correction. Four different bone heights produced 6 comparisons (4C2=6) in each mono- and bicortical condition, and thus the alpha level was corrected to 0.0042 (0.025/6).
The Pearson correlation coefficient was determined at an alpha level of 0.05 for the relationship between the different methods of measuring implant stability.
RESULTS
The ISQ, PTV, IT, and RT values of the 8 groups are shown as mean±SD (Table 1).
Table 1
Measurements from each method for measuring stability

Values are presented as mean±standard deviation.
B and M indicate bicortical and monocortical conditions, respectively. The numbers following the B or the M indicate residual bone height (RBH). Two-factor ANOVA revealed statistically significant differences in cortical conditions, RBH, and their interaction. The results of the post-hoc Tukey test are presented as superscripts. M3, monocortical bone, 3 mm in height; M5, monocortical bone, 5 mm in height; M8, monocortical bone, 8 mm in height; M12, monocortical bone, 12 mm in height; B3, bicortical bone, 3 mm in height; B5, bicortical bone, 5 mm in height; B8, bicortical bone, 8 mm in height; B12, bicortical bone, 12 mm in height; ISQ, implant stability quotient; PTV, periotest value; IT, insertion torque; RT, removal torque.
a)Statistically different between 3 mm and 5 mm of RBH; b)Statistically different between 3 mm and 8 mm of RBH; c)Statistically different between 3 mm and 12 mm of RBH; d)Statistically different between 5 mm and 8 mm of RBH; e)Statistically different between 5 mm and 12 mm of RBH; f)Statistically different between 8 mm and 12 mm of RBH.
Interaction of two factors (cortical conditions and RBH)
A two-factor ANOVA tested the level of primary stability in the residual bones with different RBHs, with either a bicortical or a monocortical condition (Tables 2, 3, 4, 5). For all methods of measuring stability, the bicortical condition showed a significantly greater level of primary stability than the monocortical condition (P<0.001 for all methods), and different RBHs also showed statistically different levels of primary stability (P<0.001 for all methods). Moreover, the interaction between cortical conditions and RBHs was also statistically significant for all methods (P<0.001 for all methods). The results of the post-hoc test regarding RBH are presented in Table 1 as superscripts.
Table 2
Result from two-factor analysis of variance for ISQ

Table 3
Result from two-factor analysis of variance for PTV

Table 4
Results from two-factor analysis of variance for IT

Table 5
Result from two-factor analysis of variance for RT

Simple main effect on primary stability
The statistical significance from the simple main effect is expressed in Figure 2. To control the type I error, we adjusted the P level according to the numbers of comparisons for each parameter.
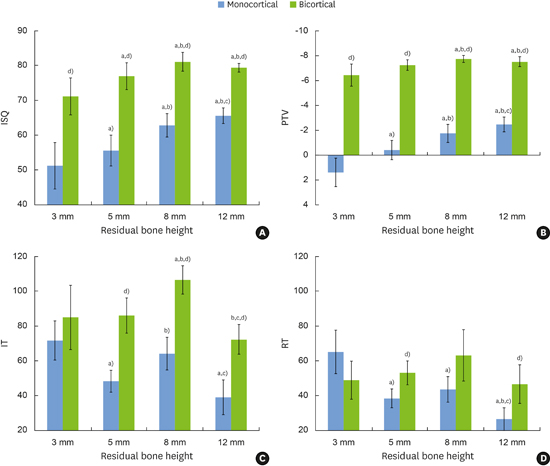
Figure 2
Bar graphs of each parameter for different residual bone heights (RBH) with mono- and bicortical conditions. Blue and green bars indicate mono- and bicortical conditions, respectively. X-axes represent RBH. (A) ISQ (Implant stability quotient) values, (B) PTV (Periotest value), (C) IT (Insertion torque) values, and (D) RT (Removal torque) values for different bone heights with mono- and bicortical conditions. ISQ and PTV were statistically higher in all bicortical subgroups than the corresponding monocortical subgroups, but bicortical fixation did not yield greater IT and RT values than monocortical fixation. In the monocortical groups, ISQ and PTV showed a constantly rising tendency with increasing RBH, which was statistically significant. However, the changes of IT and RT showed a different tendency of increase and decrease. In the bicortical group, all variables showed a similar tendency with different degrees of rise and decline. It should be noted that the B12 group did not attain bicortical fixation due to the length of the implant installed (10 mm).
a)Significant difference compared to 3-mm subgroup in each cortical condition (adjusted P<0.0042). b)Significant difference compared to 5-mm subgroup in each cortical condition (adjusted P<0.0042). c)Significant difference compared to 8-mm subgroup in each cortical condition (adjusted P<0.0042). d)Significant difference between mono- and bicortical conditions regarding each of the 4 different bone heights (adjusted P<0.0125).
The ISQ and PTV values were statistically higher in all bicortical subgroups than in the corresponding monocortical subgroups (P<0.0125 for ISQ and PTV). The IT value was statistically higher in the B5, B8, and B12 groups than in the corresponding M5, M8, and M12 groups, respectively. The RT value was statistically higher in the B5 and B12 groups than in the corresponding M5 and M12 groups, respectively.
In the monocortical group, ISQ and PTV showed a constantly rising tendency with increasing RBH. Each subgroup showed a significant difference compared to the subgroups of lower height (P<0.0042). The IT and RT values showed a similar tendency; the values were the highest in the M3 group followed by the M8, M5, and M12 groups. For IT, the M3 and M8 groups were statistically greater compared to the M5 and M12 groups. For RT, the M3 group was statistically greater compared to the rest of the groups, and the M12 group was statistically lesser than the M5 and M8 groups.
In the bicortical group, all variables showed a similar tendency with different degrees of rise and decline. They increased from the B3 group to the B8 group, and showed a decrease in the B12 group compared to the B8 group. For ISQ and PTV, the B8 group had the highest value followed by the B12, B5, and B3 groups. The B5, B8 and B12 groups showed statistically greater value in ISQ than the B3 group, and the B8 and B12 groups were statistically greater in PTV than the B3 group (P<0.0042). For IT and RT, the B8 group had the highest value followed by the B5, B3, and B12 groups. The IT value in the B8 group was statistically greater compared to the rest of the groups. The values of RT did not show statistical difference.
Correlation analysis
The correlation among the measuring methods was revealed by the Pearson correlation coefficient (Figure 3). The highest coefficient was demonstrated between ISQ and PTV (Pearson’s r=–0.97, P<0.001), which indicates high reverse correlation. The IT value was shown to have moderate correlation with ISQ (Pearson’s r=0.58, P<0.001), PTV (Pearson’s r=–0.61, P<0.001), and RT (Pearson’s r=0.60, P<0.001), respectively. RT showed no statistically significant correlation with ISQ (Pearson’s r=0.12, P=0.28) and PTV (Pearson’s r=–0.14, P=0.23), respectively.
Figure 3
Scatter plots showing the correlation between measuring methods. The Pearson correlation coefficient was used for analyzing the relationship. (A) ISQ (implant stability quotient) vs. PTV (Periotest value), (B) ISQ vs. IT (insertion torque), (C) PTV vs. IT, (D) IT vs. RT (reverse torque), (E) ISQ vs. RT, (F) PTV vs. RT. High reverse correlation was demonstrated between ISQ and PTV. Moderate correlation was demonstrated between ISQ and IT, PTV and IT, and IT and RT. No correlation was demonstrated between ISQ and RT, and PTV and RT.
a)Statistically significant correlation between parameters on the X- and Y-axes.
DISCUSSION
In the present study, we designed several models we may encounter in the posterior maxilla in clinical practice, taking into account RBH and the presence of cortical bone. To simulate the posterior maxilla, we used solid rigid polyurethane blocks that had predetermined bone density and cortical bone thickness with reference to previous studies [1516]. Other studies have utilized cadavers [121920] and animal bones from different sources [2122]. Cadaveric studies may be the best for simulating actual clinical conditions, but limited numbers of samples are available at a high cost, and it is not possible to create experimental conditions. Animal bone models, as well, cannot simulate an identical situation among specimens. Therefore, the model we used in the present study can be generally accepted for simulating the clinical situation in a simplified way.
Bicortical fixation was proposed for increasing primary stability [2324], which was clearly demonstrated in the present study; all subgroups in the bicortical groups showed significantly better values compared to the subgroups in the monocortical groups in terms of ISQ and PTV. Such a finding is in full agreement with previous studies [623]. Shin et al. [6] evaluated the effects of defect type and depth on implant stability in an ex vivo peri-implant bovine rib bone model, and the loss of cortical bone significantly reduced the stability. Ahn et al. [23] demonstrated that under-preparation and bicortical fixation significantly increased implant stability in polyurethane bone models. The advantage of bicortical fixation was also supported by histologic analysis and finite element evaluation. Bone-to-implant contact was greater in bicortically fixated implants [9], and the stress level in trabecular bone was reduced in a model with poor bone quality [10].
One of the strategies for increasing primary stability is to place longer implants. In the study of Hong et al. [25] using polyurethane bone models, not only cortical bone plate but also the total length of the implant was a significantly influential factor for increasing ISQ values. Even though there is no direct comparison between a shorter implant and a longer implant for a bone with the same height in the present study, it was demonstrated that implant stability in ISQ and PTV showed an increasing tendency as RBH rose. In other words, larger contact area with the host bone can provide an adequate amount of stability.
Interestingly, IT and RT in the M3 group were significantly greater than IT in the M5 and M12 group and RT in the rest of the subgroups, which might be caused by the macrodesign of the implant. The implant is designed to have a taper in the coronal 3 mm, generating greater torque when engaging the coronal portion. In the M3 group, the coronal 3-mm portion of the implant was engaged in the apical cortical area, but not in the rest of the monocortical group. Meanwhile, it should be noted that ISQ and PTV showed different tendencies compared to IT and RT. Even if IT and RT in the M5, M8, and M12 groups were lower than in the M3 group, ISQ and PTV showed progressive positive values with increasing RBH. Clinically, this sends an important message. Firm stability, which is measured by a built-in gauge in the implant-installing engine or detected by the clinician’s tactile sense, may not coincide with the level of primary stability determined by ISQ and PTV. Thus, early or immediate loading should not be solely determined by IT. Some studies have cast doubt on the correlations between IT/RT and the RFA [121920], which is in line with the present study.
Even though the above analyses for the simple main effect, that is, cortical conditions and RBHs, showed a significant effect on primary stability, we should focus on a mixed effect of cortical condition and RBH on primary stability. The significant interaction between cortical bone conditions and RBHs was also demonstrated in all methods for measuring stability. In the present study, we established experimentally only two factors for testing primary stability, but the combination of multiple factors other than cortical conditions and RBH, such as implant design, bone quality, and bone grafting in the sinus should be comprehensively considered in a clinical setting.
Importantly enough, we should not misinterpret the concept of obtaining high primary stability. Achieving good primary stability was generally regarded as imperative for the osseointegration of a machined-surface implant [26], which prompted a bicortical fixation method. However, primary stability for rough-surface implants, these days, seems to be more important for advancing the loading. It was demonstrated that a rough-surface implant with no primary stability could be successfully osseointegrated and no difference in healing was noted after a certain healing period [2728]. Moreover, high primary stability may not be influential for the longevity of the implant. Mono- and bicortical fixation was clinically insignificant in marginal bone loss even for machined-surface implants in long-term follow-up for Branemark implants [29].
The methods used in the present study have been popularly employed for measuring implant stability. One of the reasons we measure the stability is out of a desire to predict the prognosis for the implant. Many investigators have demonstrated that the RFA device and Periotest provide high repeatability and reproducibility, or reliability. Indeed, ISQ and PTV can be objective indicators for stability, but the single measurement of those values has limited clinical value concerning the fate of the implant in the future [14]. Several studies have also questioned the prognostic value of ISQ and PTV [3031].
In the present study, ISQ and PTV values were highly correlated. However, it should be born in mind that this result was derived from situations free of an adjacent defect. In a clinical setting, various defect morphologies are found in relation to implant placement. The peri-implant defects may affect the PTV and ISQ differently, because the measuring mechanism by each method is different. This should be investigated in further studies.
It is not feasible to completely simulate the complex reality of the human body, which is the basic limitation of the present study. However, the present study revealed the factors affecting primary stability in a reproducible manner in a controlled environment. Within the limitations of the present study, primary stability was enhanced by bicortical fixation and increased RBH, and more importantly, a significant interaction between cortical conditions and RBHs was demonstrated. Moreover, primary stability expressed by ISQ and PTV may be more clinically significant compared to IT and RT.
 XML Download