

 PDF
PDF ePub
ePub Citation
 Print
Print


I. Introduction
According to the 2007 report of Health Insurance Review Agency1), the estimated number of medical insurance claim was 967,735,494 and the total amount of expense was 32,258,975 million Won. The estimated number of claims associated with malignant neoplasm was 707,478 and the total amount of expense for that was 1,604,788 million Won. Although the number of claims related with cancer occupies only 0.07% of all the claims, the amount of expenses of that reaches about 4.97%. Moreover, the average expense per medical claim related to malignant neoplasm was 2,268,323 Won, which is 68 times greater than average expense 33,334 Won of all themedical claims. Accordingly, the hospital charges related to cancer show huge expansion2). Therefore, it has become very important to predict the hospital charge related to the cancer for the proper allocation of medical resources and establishment of medical policies in hospitals.
Meanwhile, the medical data is difficult to analyze because of its characteristics such as huge volume and heterogeneity, temporality of the data, and high frequency of null values. It is not uncommon that a patient data exceed more than 1000 fields when the patients' data collection is longer than one year3). In addition, medical data consists of various types of data such as image, numbers, videos and electrical signals (EKG, EEG), it ismore difficult to analyze than other domains. Moreover, the medical data collection occurs very irregularily because the disease breaks out unexpectedly. The irregularity of medical data leads to many null values in the aspect of time flow. And the null values influence negatively to build proper prediction models. For the reasons mentioned above, these researches have shown very low prediction accuracy, for they could not help using very limited parts of a huge amount of medical data which consists of various data types.
But, researches related to hospital expense are relatively small. Especially, the researches about the prediction of hospital expense using data mining techniques are not easy to find which are known to be better prediction results than other methods4). Thus we built prediction models to predict the expenses for the cancer patients using artificial neural network and decision trees methods and compared their efficacies.
II. Materials and Methods
In general, appropriate feature selection subset improves accuracy than using total feature set. The authors used RELIEFF suggested by Demsar5), which is an extension of RELIEF as a feature selection method. Further, a domain expert verified selected features. The features were selected for split criteria in decision trees and in naïve Bayes classifier for building models.
The dataset is based on the records of cancer patients who have been treated in Kyung Hee University Hospital from March 1, 2003 to February 29, 2004. The hospital had more than 130,000 admissions, 4,000,000 out-patients' visits and 5,000 newly diagnosed cancer patients during the period. Among them, the data from 1622 patients who had been hospitalized at least once for the treatment of cancer were enrolled. Data from 17 patients who have no personal identification were excluded. Finally, 400,625 records from 1605 patients were used for the analysis. The variables included all the fields based on the standard medical record form of Korea. Dataset were prepared totally with 66 (65 input variables and 1 output variable) variables (Table 1).
The output variable was set once to predict 'the total amount of hospital charge' and then to predict 'the amount paid by insurance'.
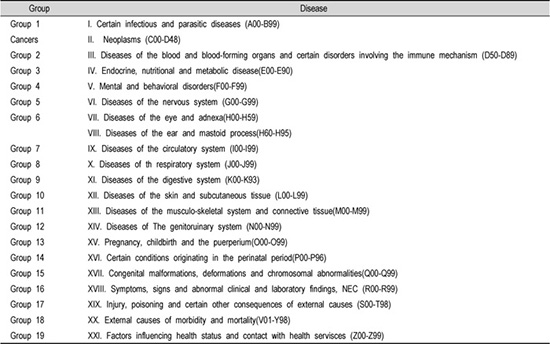
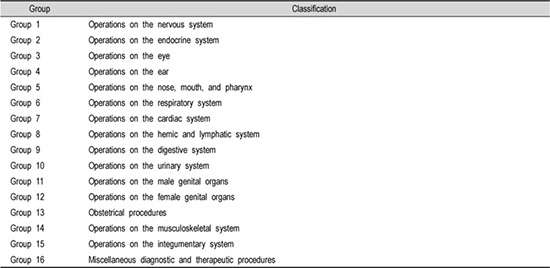
We removed null values, and performed variables selection using RELIEFF algorithm with the help of medical domain experts because building models with a subset of appropriate variables results in better accuracy than with a total set5). For example, original fields, 'operation_1' to 'operation_10', consist of two-digit code to identify surgeon and two-digit code to identify operation numbers. They had many null values, because a patient rarely receives more than five operations during an admission period. So, we derived a new field, no. of operations, which simply stores the number of times of operations performed on a patient, thereby reducing both the number of null values and the number of fields. And disease codes other than cancer were divided into 19 fields, each of which denotes the number of diseases in each disease group. As a consequence, 65 input fields were created in total. 19 disease groupswere generated according to the Korean Classification of Diseases and 16 treatment groups were also generated according to the ICD-9CM classification. Each kind of cancer was stored into one of the twelve fields.
Clementine 7.0 (SPSS, Chicago Illinois, USA) program was used to build data mining models. Having carried feature selection using the well-known RELIEFF method, we build models. A feed-forward back-propagation method was used to build neural network models. 70% of original dataset were set to be training dataset and the rest to be test dataset. Two neural network models were created using the training dataset: one to predict the total amount of hospital charge and another to predict the amount paid by insurance. Similarly, two CART models were built using the same input variables selected fromthe RELIEFF method, as were used to build neural network models. For the CART models, we set maximum tree depth to 30. Same training and test datasets were used as were used when building neural network models. Gini index which indicates a level of impurity of a node is used as a basis for splitting nodes. All the models were built using Clementine 8.1.
III. Results
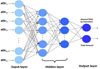
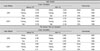
To predict total amount, ANNmodel was createdwith 55 input neurons in its 3 hidden layers (Fig. 1). To predict total mount, theANNmodelwith feature selection showed better linear correlations than without feature selection. The linear correlation coefficient of ANN models with or without feature selection were 0.824 and 0.794, respectively. To predict the amount paid by insurance, ANN model was created with 53 input neurons in its 3 hidden layers. Also, the ANN model with feature selection showed better linear correlations than without feature selection. The linear correlation coefficient of ANN models with or without feature selection were 0.838 and 0.82, respectively (Table 2). The estimated accuracy of neural network model for total amount and the amount paid by insurance was 98.3% and 98.7% respectively. The relative weights of factors that affect hospital charge were analyzed. The most important factors in predicting the total amount were duration of admission (0.074), number of consultations (0.062) and treatment group 16 (0.061) (Table 3). Treatment group 16 is designated as the miscellaneous diagnostic and therapeutic procedures. The most important factors in predicting the amount paid by insurance were duration of admission (0.091), the number of ICU admission (0.063) and the number of consultation (0.063). Among the variables, physician relative variables such as Doctor ID did not influence on the relative importances.
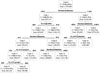
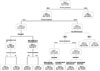
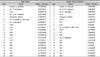
The most important variable was the duration of admission, where the first branch was split at the point of 14.5 days of admission. The second important variable is the number of operations at the left branch of the tree. Then, the nodes at other levels were split based on number of operations, treatment group 16, and treatment group 9. The number of rules in the resulting rule set was eleven and these rules classified the part of high hospital expense well. For example, consider these rules: IF "(1) days of admission ≥14.5 and (2) days of admission <55.5 and (3) the number of ICU admission <0.5" THEN "3,125,038". The correlation coefficients of the CART models were 0.791 for the total amount of hospital charge and 0.699 for the amount paid by insurance regardless of feature selection. In the CART model for amount paid by insurance, the duration of admission was most important variable also but instead of the number of operation, department was demonstrated as second important variable. The other variables were number of ICU admission and treatment group 16(Fig. 3).
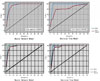
The percent gain of ANN model shows better %gain than CART to predict total amount but to predict amount paid by insurance, ANN showed similar pattern to CART (Fig. 4).
IV. Discussion
With the development of information technologies, it becomes possible to record and search the historical states of patients through database. As a result, tremendous medical data of various types have been accumulated into a database of a medical information system. But because of the complexity, the medical data is difficult to analyze. It frequently occurs that if the period of data collection is longer than one year, the record of such a patient has more than 1000 fields3). In addition, medical data consists of various types of data such as image, numbers, video, etc and thus it ismore difficult to analyze than simple data collected in other domains. The characteristics of medical data include 1) huge volume, 2) heterogeneity, 3) temporal (historical) data, and 4) relatively high frequency of null value.
There have been several researches related to the prediction of hospital charges of cancer patients using statistical analysis such as regression or ANOVA6-8). Since most of these researches were based on a small number of variables among many affecting the hospital charge, their prediction accuracy was not satisfactory. Therefore, these regression models can be hardly used for the prediction of hospital expense. In this aspect, datamining has emerged as an analytical method which can discover interesting knowledge from tremendous data from diverse domains using various techniques such as pattern recognition, statistics, database, machine learning and so forth9). Data mining can discover interesting knowledge from a large amount of data in the form of rules, patterns or trends, which may be difficult to obtain using traditional statistical methods10). In the medical field, data mining techniques such as association rules, artificial neural network, decision tree and genetic algorithm have been used to achieve various objectives and several data mining studies concerning medical cost were performed. Marshall et al.11) built conditional phase-type distribution model to predict elderly patient's outcome and duration of stay. In the research, they were able to identify that there is a strong relationship between Barthel grade, patient outcome and length of stay. Chae et al. examined the characteristics of the knowledge discovery and data mining algorithms to demonstrate how they can be used to predict health outcomes and provide policy information for hypertension management using the Korea Medical Insurance Corporation database12). They built logistic regression, CHAID and C5.0 models from a dataset related to hypertensive and non-hypertensive and compared their performance one another. They reported that the CHIAD algorithm performed better than the logistic regression in predicting hypertension, and C5.0 had the lowest predictive power. These researches are pioneers to introduce data mining models to predict medical costs. But still, data mining models for cancer patients' cost are rarely found.
Thus, we aimed the objective of this study to build prediction models for the hospital charge of cancer patients because there are very limited researches concerning for the cost of cancer patient inKorea, where themedical insurance systemis very unique and governed by the governance. The current research to build data mining models to predict cost of whole cancer patients may be the first in Korea. Although the authors have reported a dataminingmodels to predict cost of cancer patients, it was limited only for the colorectal cancer13). However, our current research has some limitations which should be taken into account in later researches. The dataset we have used to build the predictive models did not have records of all treatments and examinations which a patient has experienced, because they were not digitalized at the time of data collection. Also, we could notmake use of the information indicating the staging of cancer, the use of which may enable us to build a more exact predictive model in various aspects. If we have more digitalized records in a few years to come as we plan, we will make more accurate predictive models of the hospital expense. Further, as more cases of cancer patients are accumulated into the medical information systems, we may apply other data mining technique such as case-based reasoning to the medical data to get the similar results which may be better.
In this study, we included the all kinds of cancers as an input, so that prediction of hospital charge of cancer patients could bemade, independently of the type of cancer. And we used artificial neural networks and decision trees to build prediction models and compare their prediction accuracy because those two models are most commonly used data mining tools. Although, our results showed that bothmodels are efficient to predict cancer patient's hospital charge, the prediction accuracy of ANN model was slightly higher than that of the CART model and the ANN model shows better percent gain for predicting total amount (Fig. 3). Generally, ANN models have shown higher sensitivity, specificity and prediction accuracy than other data mining techniques. In the previous research, the authors have compared the performance of ANN model and that of CART model in predicting hospital charges of colorectal cancer patients13). The result showed that ANN model showed better performance than CART model. The current results demonstrate that with the complicated database, the ANN model shows better prediction than other models. Chien et al.14) applied three data mining techniques to improve prediction of post-operative complication of gastric cancer. The data mining techniques included Artificial Neural Networks (ANN), Decision Tree (DT) and Logistic Regression (LR). The results indicated that ANN was a better technique than DT and LR in predicting post-operative complication. Goss et al.15) compared traditional decision support system such as Binary Logit Regression (BLR) and non-parametric methodologies such as neural network (NN) model to provide objective measures of the likelihood of Intensive Care Unit (ICU) recovery. The study showed that the NN technique predicts mortality rates more correctly than BLR, and offers a promising non-parametric alternative to the parametric methodologies in hospital settings. For the cancer patients, Fogel et al. were first to apply neural networks and linear classifiers to breast cancer patients' dataset16). They used cross-validation to estimate error rate and relied on evolutionary computation to mitigate the black-box problem. However, the fact that neural network models could not give an adequate explanation of their results to doctors is very fatal because they hardly accept the result of 'black box' classifiers unless their performances overwhelm other classifiers17). To overcome such limitations and adjust weights in neural networks, genetic algorithm has been used. Bojarczuk et al.18) proposed a newconstrained-syntax genetic programming (GP) algorithm for discovering classification rules in five medical data sets: chest pain, Ljubljana breast cancer, dermatology, Wisconsin breast cancer, and pediatric adrenocortical tumor. The proposedGP algorithm obtained good results with respect to predictive accuracy and rule comprehensibility, by comparison with C4.5 and Boolean inputs (BGP).
Meanwhile, decision tree is one of the most frequently used techniques for classification and prediction tasks not only in medical data mining area but also in other areas. This enables one to predict prognoses and diagnoses using tree-structuredmodels and to identify useful features which play an important role in making such predictions. Demšar et al.5) built models which can be used to predict whether a severe trauma patient would survive or not. They found out that features selected as split criteria in the decision tree corresponded to factors which other researchers found to have an influence on the survival of a patient who suffered from severe trauma. But the size of their dataset was so small (68 cases) that their models could not be used as a prediction model for severe trauma patient's survival. Breault et al.19) have analyzed diabetes patients' data with CART and discovered that a patient's age rather than whether one has other diseases or not has an association with adjustment of blood sugar.
Although the ANN model showed better results to predict cost, the fact that neural network models could not give an adequate explanation for the result of 'black box' classifiers, CART have their own advantages and unique use so that bothmodels are needed to build proper strategies of hospital and national policies.

 XML Download