

 PDF
PDF ePub
ePub Citation
 Print
Print


I. Introduction
Healthcare costs are in danger of spiraling out of control owing to the substantial increase in the elderly proportion of the population [1]. Research into personal health monitoring (PHM) has intensified in recent years to reduce future healthcare costs, with a shift towards preventive health monitoring outside the hospital setting [23]. An important subfield of PHM is human motion analysis because physical activity reduces the risk of several diseases [4]. Wearable systems for movement analysis have shown great promise and have become a prominent research field in the last couple of decades [56].
Monitoring of physical activity by means of wearable technology has become affordable for consumers, and can take many forms [78]. Parameters of interest for the monitoring of physical activity include heart rate, number of steps, walking speed, step length, and step frequency. Data relating to physical activity can be gathered using equipment such as a GPS (outdoors), accelerometers [9], inertial measurement units [10], pedometers, and heart rate monitors.
The heart rate is affected by several factors, such as illness, medication, and stress [11]. In contrast, walking speed and weight carried are two important factors for monitoring the energetic cost of movement [12]. Walking speed has also been shown to be a predictor of health status and the onset of functional dependence of the elderly [1314]. GPS devices are limited to outdoor measurements. Pedometers estimate walking speed based on step frequency measurements and a set step length, since the walking speed is a product of step length and step frequency. Step length depends on factors like walking style and leg length, but it can also change with the walking speed. Given these facts, it is clear that there is a need for portable and cost effective measurement systems for walking speed that are suitable for indoor use for PHM.
The study of the forces acting between the plantar surface of the foot and a supporting surface, such as the insole of the shoe, is called pedobarography [15]. Pedobarography can be used in a multitude of applications, such as the analysis of gait [16] and posture [17], design of more comfortable footwear [18], evaluation of new prosthetics [19], biped robotics [20] and biomechanics [21]. It provides an alternative means of monitoring physical activity, and it allows any extra load carried to be taken into account [22]. A correlation has been shown between walking speed and the pressure measured with insoles [23], with a relationship between walking speed and peak pressures in the heel, medial forefoot, and toes [24]. The pressures from the big toe (hallux) and heel have been shown to increase linearly with faster walking speed [25]. In contrast, the pressure in the midfoot region has been reported to have a negative correlation with increased walking speed [26]. In a pilot study, a prototype pedobarography measurement system, consisting of commercial off-the-shelf components, indicated that the force-time integral is correlated with the walking speed [27]. To the best of our knowledge, there is no other PHM system that estimates walking speed by analyzing the force-time integral from force-sensing resistors.
This study evaluated a mobile pedobarography system called Identifying Velocity and Load (IngVaL). As personal health monitoring is the intended use of the system, the cost has to be modest, which is possible by limiting the number of sensors to just three force-sensing resistors. IngVaL is an improved version of the prototype system in the pilot study [27]. The three variables investigated in this study were sensor durability, proportion of analyzable steps, and R2 value, for the linearity between system output and walking speed to confirm the accuracy of the method of estimating walking speed.
II. Methods
This study had a cross-sectional design. In this section, first, the IngVaL hardware is described. This is followed by a description of the experiment and, finally, the analysis of the measured data.
1. IngVaL Hardware Development
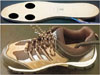
The previously used prototype system [27] was improved by designing new insoles in two shoe sizes. One size fit into shoes with EU shoe size 39, and the other was designed for size 44. Blue Wear safety work shoes, model S1 SRA, were used in this study. Ethylene-vinyl acetate (EVA) was chosen as the insole material together with a cork and leather layer, model 6949 (BNS Bergal Nico & Solitaire Vertriebs GmbH, Mainz, Germany), which was placed between the sensors and the feet. Milling the area in which the sensors were to be placed made it possible to install them flush with the surface, eliminating excess pressure on the vulnerable boundary of the active sensor area. Each right-side insole was fitted with three force-sensing resistors, model A401 (Tekscan Inc., Boston, MA, USA). The three sensors were positioned under the big toe and on the medial and lateral sides of the metatarsal pad, as shown in Figure 1. These three sensor positions were used to monitor the impulse that adds the propulsion energy at the end of each step, to maintain a constant walking speed. The A401 sensor had a circular sensor area with a diameter of 25.4 mm and a thickness of 0.2 mm. Double-sided tape was used to adhere the sensors to the EVA insole. Each insole weighed 0.05 kg and was 0.6 cm thick. The battery weight was 0.26 kg, and the electronics with enclosure weighed 0.78 kg. The total weight of the backpack holding the measurement system was 1.68 kg. The battery lifetime was not an issue because the high-capacity battery (12,000 mAh) was paired with a current draw of up to 16 mA during maximum load on all eight sensors.
1) Wireless data transmission
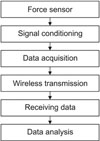
Elastic spiral data cables were run up the leg of each subject from the shoe, secured with Velcro straps at the ankles, to the backpack containing the data acquisition unit. The signals from the sensors were amplified using a FlexiForce adapter 1120 (Phidgets Inc., Calgary, Canada) and then sampled at 200 Hz using an IOIO-OTG (SparkFun Electronics Inc., Niwot, CO, USA). Bluetooth 4.0 provided the wireless link to a Microsoft Surface Pro 2 tablet running Windows 8.1. An overview of the IngVaL system is shown in Figure 2. The software receiving the data on the tablet was a modified version of Johannes Rieke's open-source Java program ioiometer-pc [28].
2) Walking speed reference
A perambulator of model Hard Head SMT251 (Jula Sverige AB, Skara, Sweden), a measuring wheel with a 1.00-m circumference, was modified by adding 10 neodymium magnets evenly spread out around the rim of the wheel. As a result, a reed sensor on the handle of the measurement wheel was activated every 0.10 m, and a 555 timer circuit converted the signal into a square wave. An activated reed sensor resulted in the digital signal going from a high state to a low state. The perambulator was used as a reference system for the walking speed. An elastic spiral data cable connected the perambulator to the data acquisition unit, IOIO-OTG, in the backpack. Thus, the data from the force sensors and the data from the walking speed reference system were synchronized because they both used the IOIO-OTG for sampling of the data.
3) Calibration
Calibration of the sensors was conducted in line with the recommendations of the manufacturers. A Tedea-Huntleigh 1006 Single Point Load Cell (Vishay Precision Group, Malvern, PA, USA) and a GS 42 BMI electronic floor scale (Beurer GmbH, Ulm, Germany) were used to calibrate the force sensors.
2. Experiment
The target number of participants was set to 40. In total, 43 volunteers were recruited from the university staff by convenience sample. Two participants were excluded during the data collection phase because of very uneven walking speeds, and another was excluded for walking extremely fast (3 m/s). As mentioned, two shoe sizes were available, EU sizes 39 and 44. Eighteen of the 40 included participants wore EU size 39 shoes, and the other 22 participants wore size 44. The 40 participants included, 11 women and 29 men, were 37.9 ± 10.5 years old and 1.76 ± 0.10 m tall, and their average weight was 79.5 ± 17.9 kg. The values given show the mean ± standard deviation. The weights were measured with an electronic floor scale, and they correspond to the weight sensed by the insoles, i.e., without the shoes, since the insoles were inside the shoes. Each participant made an initial test to check the output from all sensors.
The measurements were performed indoors on flat ground. A distance of 60 m was measured out along a straight corridor, with the floor being marked with tape. The first and last 5 m of the 60 m were also marked with tape, and these sections were excluded from the measurement to remove data corresponding to the acceleration and deceleration phases. The start and end times were recorded for the middle 50 m. The participants were instructed to walk the distance five times. One self-paced walking speed was used for each of the five walks, respectively. The participants measured the reference walking speed holding the perambulator in their right hands.
Walks using five self-paced walking speeds were executed in a semi-randomized order to avoid using strictly increasing or decreasing speeds: (1) normal walking speed, (2) very fast, (3) between normal and very fast, (4) very slow, and finally (5) between normal and very slow walking speed. Instructions to the participants for the five speeds were the following: (1) to walk at a normal speed, (2) to walk as fast as possible without starting to jog, (3) to walk at a speed between the first two speeds, (4) to walk at a much slower pace than the normal walking speed of the participant, and (5) to walk at a speed between the normal first speed and the very slow fourth speed.
3. Analysis
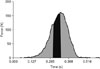
Force-time integrals were investigated; previously, a time window of 50 ms has been shown to be short enough to work with walking speeds up to 2 m/s [27]. This upper walking speed was set because the mean comfortable walking speed is 1.3–1.4 m/s and the mean maximum walking speed is 1.7–2.5 m/s, depending on gender and age, measured over an 8-m long distance [29]. The sums of the signals for each of the three forward sensors, the big toe sensor and the two metatarsal pad sensors, were calculated. The limits of the integral were determined as follows. The upper limit was defined as the time at which the maximum force was exerted using the sum of the forward sensors for the right foot as the upper limit of the integral; the lower limit was taken to be 50 ms before the time of the higher limit, as shown in Figure 3. A script written in the R programming language was run in RStudio to calculate the integrals.
Walking speed is a product of step frequency and step length. The respective correlation, between the step frequency and the force-time integral with the walking speed, was investigated in this study. The force-time integral represents the impulse, at the end of the stance phase of each step, maintaining a constant walking speed. This propulsion impulse affects the step length. The step frequency is defined as the inverted time between points of maximum force for the sum of the three forward sensors in the right insole. The reference walking speed was measured using the measuring wheel, and it was calculated as the average speed for the 50 m between the acceleration and deceleration phases. The following three correlations were made with the reference walking speed: (1) only using force amplitude and time data (force-time impulse integral) from the force sensors, (2) only using the step frequency, and (3) a combination of both. The three estimates of walking speed were thus based on step length (using the propulsion impulse), step frequency, and a combination of both.
III. Results
Four force sensing resistors broke during the experiment performed using the earlier prototype system [27]. The previous experiment included 30 series of measurements each comprising a 50-m walk. On the occasion reported here using IngVaL, no force sensing resistor broke down during the experiment, which consisted of 200 measurement series of the same type.
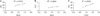
It was possible to calculate the integral for 96.6% of the steps in the 200 series of measurements. The linearity, measured with R2 values, between the walking speed and the system output was calculated using three different methods. These were only using amplitude data from the force sensors (method A), only using the step frequency (method B), and combining the amplitude data with the step frequency (method C). The R2 values are shown in Figure 4. The average R2 values for the three methods were 0.94, 0.98, and 0.98, respectively. An example of the linear relationship between the IngVaL system output and the walking speed is shown in Figure 5. Comparing the three methods for each of the 40 test participants showed that method A was the best for two of the participants, method B was the best for 15 of them, and method C was the best for 23 participants.
IV. Discussion
This study showed that the sensor durability was increased by the improvements made to the insole, which protected the edge of the sensor. As mentioned earlier, the prototype system was prone to breakage, resulting in problems with the durability of the sensors [27]. The force sensors broke down and had to be replaced four times during measurements of 10 participants walking 50 m at three different speeds. The new sensor implementation in IngVaL resulted in zero broken sensors after letting 40 participants walk 50 m at five different speeds. This means that subsequent to implementing changes, no sensors failed, despite requiring participants to cover a total distance more than six times that in the previous study when four sensors had broken. Two improvements were made to protect the sensors and increase their operational lifetime. One was using layers of cork and leather between the sensors and the foot, and the other was to mill away the insole material under the active sensor boundaries to eliminate the possibility of short-circuiting the sensors. A short-circuit yields the maximum sensor output, and in time, it leads to the destruction of the sensor.
The switch to Windows for IngVaL from Android in the prototype system [27] was done because the Windows version became open source and could be modified to increase the wireless data transmission. The improvement in data transfer made it possible to calculate the force-time integral for 96.6% of the steps as compared to 83.1% in the pilot study [27]. Identifying the maximum force and having enough samples over the integration interval are necessary to calculate the force-time integral.
Earlier work, using 10 participants in a pilot study [27], had already shown a promising correlation between walking speed and the combination of step frequency and forcetime integrals. Only using the step frequency, in this study, correlated best with the walking speed for 15 of the 40 participants. The force-time integral alone, which is one factor affecting the step length, was the best for two participants.
Combining both step frequency and force-time integral, correlated the best with walking speed for 23 participants. This means that a set constant estimate of step length, used with pedometers, for example, does not give a true estimation of walking speed. Thus, factors affecting the step length need to be integrated as well. However, the force-time integral is not the only factor affecting the estimation of step length. More factors need to be evaluated in future research. Experiments should also be conducted under harsher conditions to further evaluate the suitability of the force-time integrals and the wireless transmission capability. Examples of such conditions are environments disturbing the wireless transmission of data, together with walking on rougher ground with an inclining or declining slope.
Combining the multiplication of force-time integrals with the step frequency is an improvement over data obtained using the force amplitude or step frequency alone when measuring the walking speed. For each of the participants, the relationship between the multiplication of force-time integrals with the step frequency and the walking speed was found to be linear. Including more participants and incorporating a greater number of walking speeds in comparison to the pilot study [27] confirms the finding of linearity between the system output and the walking speed.
Commercial portable wireless pedobarography systems offer a technically feasible alternative with good results for the estimation of walking speed [23]. However, the IngVaL system is cost effective, once scaled up for production, since IngVaL only uses three sensors.
This study evaluated the IngVaL system. The three variables investigated were sensor durability, proportion of analysable steps, and the linearity between the system output and walking speed. Increased sensor durability and a higher percentage of analyzed steps indicates that IngVaL is an improvement over the prototype system developed in a previous study. The high R2 values, for the linearity between system output and walking speed confirms the accuracy of the method. Future improvements of this proposed system could include small, light-weight wireless communication nodes for use in the body area to avoid the need for cables. Such a system could combine the force sensors with units making inertial measurements for a more complete movement analysis.

 XML Download