

 PDF
PDF ePub
ePub Citation
 Print
Print


I. Introduction
Nowadays, critical intensive care units (CICU) are often dangerously overcrowded, and the acceptance of patients is becoming an increasingly significant public health system problem [1]. Waiting time [23], limited resources [14], and hospital costs [5678], are difficulties facing hospital policymakers and healthcare authorities. Addressing hospital high length of stay outliers (HHSOs) is a major task that continues to preoccupy healthcare providers while maintaining and improving the quality of healthcare. One solution is to have a better allocation of resources by reducing [9] hospital stays and expanding patient acceptance rates. More specifically, reducing HHSOs can have a significant impact on improving flow and reducing in-patient services. However, finding a way to predict HHSOs earlier could be advantageous for managers in that it could help control hospital costs, could support optimal admissions scheduling, staff planning, and management of resources [10].
To this end, both statistical analysis methods and machine learning have been investigated. Typically, HHSO analysis methods follow a statistical, deviation-based, and distancebased approach [11]. Machine learning techniques, have been proposed to build prediction models for length of stay, and they are applied in some care services. These techniques include logistic regression [12], artificial neural network [12131415], decision tree [1215], ensemble model [12], and support vector machines [15].
Various predictive factors have been considered in statistics and data mining. These factors include age [512161718], gender [5161719], marital status [19], ethnicity [19], ambulance use [16], admission type [519], admission status [16], department type [5], discharging reason [5], length of stay [16], comorbidity [1619], in-hospital mortality [16], diagnosis [19], and costs [19].
Up to now, there is no universal agreement about the predictive factors. To this end, we propose a novel approach to identify the main predictive factors influencing HHSOs using data collected from various types of CICUs. We also designed a high-performance hybrid prediction model (HPM).
II. Case Description
1. Data Collection
Data was extracted from MMIC III [2021]. The following five types of CICUs were investigated: neonatal intensive care units (NICUs), medical intensive care units (MICUs), coronary care units (CCUs), cardiac surgery recovery units (CSRUs), and surgical intensive care units (SICUs). We excluded admissions with missing predictive factors and patients older than 89 years because their ages are replaced by 300 years. We obtained HHSO data using the geometric mean plus two standard deviations [2223]. The extracted predictive factors studied in this work are summarized in Table 1.
We encoded the input binary data following a –1/+1 scheme, and for the input categorical data, we followed 1-of-C dummy-coding. We rescaled the input data using both zscore standardization, in which inputs have a mean of 0 and a standard deviation of 1, and min-max normalization, in which inputs are in the range of [-1,1]. We did not encode or rescale the HHSOs. We split the data into two sets: 80% of admissions for the training phase and 20% for the testing phase.
2. HPM Design
The proposed HPM is based on the hierarchical genetic algorithm (HGA) and fuzzy radial basis function networks (FRBFN). The purpose of the HGA is to provide the main predictive factors and the structure of the FRBFN. The purpose of the FRBFN is to accurately predict HHSOs of new admissions.
1) HGA chromosome representation
Our chromosome is composed of two parametric genes and two control genes. The first parametric gene is a vector of seven bits defining the optimal structure of the FRBFN. The second parametric gene is a vector of 28 bits identifying the main predictive factors. When a bit 1 is indicated in the control gene, the corresponding parametric gene is activated. A chromosome is defined by {f, V, k, C, Σ, W}, where F is the fitness function of the HGA, V is the set of predictive factors, and the set {k, C, Σ, W} defines the parameters of the FRBFN, where k is the number of hidden neurons, C and Σ are respectively the set of centers and widths of the transfer Gaussian functions, and W is the set of weights.
2) HPM algorithm
Our algorithm takes as input the training set and its HHSOs, and it returns an optimal solution (chromosome). First, a population of many chromosomes is generated, where V and k are generated randomly. Next, in each evolutionary cycle, a new population of potential solutions is generated based on the application of the genetic operations. In each cycle, the parameters of each produced chromosome are defined as follows: V and k are defined by the application of crossover and mutation on the two control genes separately. The set C is determined using the fuzzy C-means algorithm [24]. The set Σ is defined using the fuzzy K-nearest neighbors algorithm. The set W is defined by the singular value decomposition algorithm. Next, f is evaluated in terms of the mean absolute error (MAE) as shown in Equation (1). The cycle stops when an optimal solution is good enough or the maximum number of generations is expected.


3. Performance Evaluation
We evaluated the performance of the FRBFN in terms of the mean magnitude relative error MMRE and Pred(q) [25] prediction at level q as shown by Equations (4) and (5). Conte et al. [26] maintained that a good estimation model should have MMRE≤0.25 and Pred(q)≥0.75. The parameter m denotes the number of computed HHSOs for which the MRE is less than or equal q:


4. Results
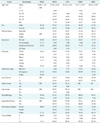
Among the 26,897 admissions considered in this study (Table 2), we found 1,365 (5.07%) patients with HHSO; 44.69% of them were hospitalized in an MICU. The mean age of the patients was 59.96 ± 0.43 years (range, 0–89 years) with most subjects between 40–64 years, while 57.58% of them were men and 42.42% were women. Most of the discharges (62.93%) required other healthcare facilities. Also, 62.86% of the patients were covered by Medicare or Medicaid. In addition, a notable 88.27% of patients showed multiple comorbidities. Table 3 summarizes the statistical results of common factors and some other important factors.
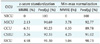
The population was composed of 150 chromosomes, and the number of iterations was 15,000. The predicted outputs were rounded to the zero decimal place because an HHSO is calculated based on the number of days. We used the technique in which the closest respected output is selected as the predicted output. The results shown in Table 4 indicate that the FRBFN performed better for all CICUs. The outcomes obtained by the z-score standardization were more effective and efficient in terms of MRME and Pred(0.25) than those obtained by min-max normalization.
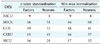
Table 5 summarizes the numbers of predictive factors and the numbers of neurons. There are three key observations to be made. First, the structure of the prediction model differed according to the studied CICUs. Second, the results suggest that each CICU has its own main predictive factors. Third, the obtained optimal configurations depend on the scaling data. The predictive factors found in the two scaling techniques were almost the same. We note that we could not verify any relationship between the FRBFN structure and the main predictive factors.
Table 6 summarizes the common main predictive factors between the studied CICUs. Medical comorbidities were not identified in HHSO prediction of NICUs.
III. Discussion
HHSOs are closely related to hospital costs and should be controlled and justified. We examined the predictive factors associated with HHSOs using both the HGA and FRBFN. We have presented the necessary steps to implement the HPM and have illustrated its applicability using data collected from various CICUs. We obtained the main factors of the prediction model FRBFN and its optimal structure using the HGA.
A comprehensive and accurate determination of the underlying factors associated with HHSOs is a critical requirement as this can help to obtain a lighter and more efficient prediction model. The optimal configurations obtained for HPM are related to the studied data; therefore, the scalability of our approach to other hospital predictions, such as re-admissions or costs may be problematic, and it would require the adoption of pruning heuristics, determination of the effective optimal parameters of FRBFN, or merging with a statistical analysis. Therefore, we cannot claim that similar results can be obtained with other hospital predictions, but it would be an interesting area for future research.
The HHSO distribution is highly skewed as shown in Table 2. This has inspired us to delve deeper into investigating for which fraction of the admissions, our hybrid model can predict HHSOs with error margins that are reasonably bounded.
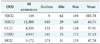
Regarding the race factor in MICUs, the admissions rate of White and Asian races represents 69.67% (average of 44.67 days) and 3.44% (average of 47.1 days) respectively. The hospital stays of most Asian patients were longer than those of White patients. This information cannot be interpreted by our approach; therefore, other potential analysis should be investigated.
To improve the performance of HPM, the following suggestions should be considered: (1) Is there a relationship between the factors and the HPM structure? (2) Explore the sample to identify other factors. (3) The performance of HGA depends on the genetic operators that should be carefully selected. (4) To speed up the HPM, the first control genes can be used without corresponding parametric genes.

 XML Download