

 PDF
PDF ePub
ePub Citation
 Print
Print


I. Introduction
Medical diagnostic decision support systems have become an established component of medical technology and their use will be growing, fueled by electronic medical records and automatic data capture [1]. This system which is the incorporation of computational techniques and artificial intelligence in biomedicine has led to apply to the detection and progression of disease [2].
Many methods have been applied for pattern of classification in biostatistics communities. The main idea of these methods is called 'divide-and-conquer principle that is often used to attack a complex problem by dividing it into simpler problems whose solutions can be combined to yield a solution to the complex problem [3]. Utilizing this principle, Jacobs et al. [4] proposed a modular neural network architecture class mixture of experts (ME). ME model consists of two networks, which is called expert and gating network.
Inputs are presented to the network, and each individual classifier makes an assessment. These outputs from the classifiers are then weighted by the relevant gate, which produces a weight using the current inputs, and this is propagated further up the hierarchy [5]. Expectation-maximization (EM) algorithm have been introduced to the ME architecture so that the training this network is a general statistical approximation algorithm. The EM algorithm can be extended to provide an effective training mechanism for the MEs based on a Gaussian probability assumption. Jordan and Jacobs [3] suggested that the ME architecture extended to a hierarchical model called hierarchical mixture of experts.
Based on this, many applications using ME model were carried out. Ubeyli [1] applied diagnosis for breast cancer and diabetes, Subasi [6] used EEG signal classification for wavelet feature extraction, Jordan et al. [3] proposed decision support in the diagnosis of leukemia patients, and Raman et al. [7] present an infinite ME model to find an unknown number of subgroups within a given patient cohort based on survival analysis.
Transient elastography (Fibroscan; The Princess Grace Hospital, London, UK) is a rapid and non-invasive method to measure liver stiffness and this allows the assessment of liver fibrosis. In the past study, Kim et al. [8] suggested that the Fibroscan offered the best diagnostic performance both for significant fibrosis (F ≥ 2) and severe fibrosis-cirrhosis (F3-F4) by using logistic regression. But we need such an elaborate framework for identifying hidden subgroup along with their key characteristics versus other simple model.
The aim of this study was to apply ME model for classifying of the hidden subgroups and testing the significance of measuring the liver stiffness associated with the development of liver cirrhosis and explored the feasibility of the ME model in diagnostic decision support system.
The remainder of this paper is organized as follows. In second section, ME architecture used in this study is briefly explained and the liver stiffness data is described. Also, EM algorithm used for estimating the ME architecture is presented. In third section, the application results of the ME networks to the liver fibrosis data are described. Finally, in the last section the study is concluded.
II. Methods
1. Liver Stiffness Data Overview
Liver fibrosis is the most important factor that determines the prognosis in chronic liver disease patients. Liver cirrhosis which is the extreme of liver fibrosis is an independent risk factor for liver cancer, chronic hepatitis B is the most important cause (62.5-73%) in Korea [9]. Liver biopsy is the gold standard for assessing liver fibrosis, but its invasive method can be risk of complications such as pain and bleeding.
Transient elastography (Fibroscan) is a rapid and non-invasive method to measure liver stiffness and this allow the assessment of liver fibrosis [8]. Researcher is under way to learn more and physicians are to assess the diagnostic accuracy of measuring the liver stiffness.
In this study, the liver stiffness data is taken from 228 HBsAg positive patients whose liver stiffness was measured by Fibroscan between March 2005 and September 2005. Liver biopsy examinations were performed in 34 patients. The fibrosis (F) was staged on a 0-4 scale according to the Ludwig classification. Kim et al. [8] concluded that Fibroscan is a reliable and rapid noninvasive method to diagnose the severity of chronic liver disease and to predict fibrosis in patients with chronic hepatitis B in addition to using the aspartate aminotransferase-to-platelet ratio index (APRI) and aspartate aminotransferase/aspartate aminotransferase (AST/ALT) ratio.
2. The Architecture of ME Model
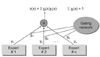
In this subsection, we briefly review the ME architecture [4] and the EM algorithm [3]. The ME architecture is shown in (Figure 1). The architecture is composed of a gating network sit at the nonterminals of a tree and several expert networks sit at leaves of a tree. The gating network receives the input vector x as input and produces scalar outputs that are partition of unity at each point in the input space. Each expert network produces an output vector for each input vector. These output vectors proceed up the tree, being mixture of the gating network outputs. The gating network provides linear combination coefficients as vertical probabilities for expert networks and, therefore, the final output of the ME architecture is a convex weighted sum of all the output vectors produced by expert networks. Suppose that there are N expert networks in the ME architecture. All the expert networks are linear with a single output nonlinearity that is also referred to as 'generalized linear' [10]. The i-th expert network produces its output oi(x) as a generalized linear function of the input x:
oi(x) = f(Wix)
where Wi is a weight matrix and f(·) is generally taken to be the logistic function or the identity function. These models are smoothed piecewise analogs of the corresponding generalized log-linear model (GLIM) models [3]. The gating network is also generalized linear function, and its i-th output, g(x,vi), is the multinomial logit or softmax function of intermediate variables ξi [10]:
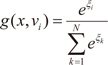
where  and vi is a weight vector. The overall output o(x) of the ME architecture is
and vi is a weight vector. The overall output o(x) of the ME architecture is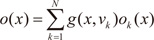
The ME architecture can be given a probabilistic interpretation. For an input-output pair (x,y), the values of g(vi,x) are interpreted as the multinomial probabilities associated with the decision that terminates in a regressive process that maps x to y. Once the decision has been made, resulting in a choice of regressive process i, the output y is then chosen from a probability density P(y∣x,Wi), where Wi denotes the set of parameters or weight matrix of the i-th expert network in the model. Therefore, the total probability of generating y from x is the mixture of the probabilities of generating y from each component densities, where the mixing proportions are multinomial probabilities:
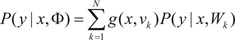
where Φ includes the expert network parameters as well as the gating network parameters. Moreover, the probabilistic component of the model is generally assumed to be a Bernoulli distribution in the case of binary classification, a multinomial distribution in the case of multiclass classification and a Gaussian distribution in the case of regression. Based on the probabilistic model, a learning algorithm for the ME architecture is treated as a maximum likelihood estimation problem. Jordan and Jacobs [3] have developed a learning algorithm for the ME architecture based on EM framework.
Suppose that the training set is given as  . The EM algorithm consists of two steps. In E-step, the posterior probabilities hi(t)(i=1,…,N), which can be interpreated as the probabilities P(i∣xt,yt) are computed for the s-th epoch:
. The EM algorithm consists of two steps. In E-step, the posterior probabilities hi(t)(i=1,…,N), which can be interpreated as the probabilities P(i∣xt,yt) are computed for the s-th epoch: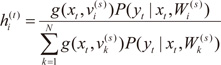
The M-step solves the following maximization problems:
and
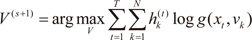
where V is the set of all the parameters in the gating network. Therefore, the EM algorithm is summarized as the following [3]:
For each data pair (xt,yt), compute the posterior probabilities hi(t) using the current values of the parameters.
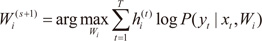
For each expert network i, solve the a maximization problem in Wi(s+1) with observations  and observation weights
  .
.
and observation weights .For the gating network, solve the maximization problem in V(s+1) with observations  .
.
.Iterate by using the updated parameter values.
3. Application of Mixture of Experts to Liver Fibrosis Data
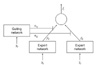
The ME architecture used for the diagnosis of liver cirrhosis is shown in (Figure 2). Since two-group classification was investigated exclusively, the ME was configured with two local experts and a gating network.
There are a total of 228 HBsAg positive patients whose liver stiffness was measured by Fibroscan between March 2005 and September 2005. The diagnosis of liver cirrhosis (LC) were considered such as LC with compensated, LC with decompensated and hepatocellular carcinoma (HCC) cases.
Statistical analysis was performed by R 2.13.0 (software available at http://www.r-project.org). The characteristics of LC and non-LC patients were compared using two-sample t-test and chi-square test. Classical logistic regression model and ME model was described, and classifying of the hidden subgroups.
Receiver operating characteristic (ROC) curves were shown for comparing classical logistic regression and ME model from this data for the validation of model.
III. Results
1. Characteristics of the Study Population
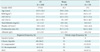
A total of 228 patients were enrolled in this study. The mean age of the patients was 45.9 years and 177 patients were male. In diagnosis, 29 (12.7%) patients were inactive carrier, 106 (46.5%) patients had chronic hepatitis, 63 (27.6%) patients had LC with compensated, 26 patients had LC with decompensated and 4 (1.8%) patients were HCC. The mean age of the liver biopsy patients was 39.4 years and fibrosis stage 1 (portal fibrosis) was 4 (11.8%) patients, stage 2 (periportal fibrosis) was 12 (35.3%) patients, stage 3 (septal fibrosis) was 2 (5.9%) patients and stage 4 (cirrhosis) was 16 (47.1%) patients (Table 1).
According to the clinical diagnosis, the median values of liver stiffness were 7.0 ± 2.7 kPa for inactive carriers (n = 29), 8.3 ± 5.3 kPa for chronic hepatitis patients (n = 106), 15.9 ± 8.3 kPa for compensated cirrhosis patients (n = 63), 31.8 ± 20.3 kPa for decompensated cirrhosis patients (n = 26), and 45.1 ± 34.5 kPa for HCC patients (n = 4). The degree of liver stiffness was statistically significant (p < 0.001) (Table 2).
2. Classfication of the Diagnosis of LC by Measuring the Liver Stiffness
In classification, the aim is to assign the input patterns to one of several classes, usually represented by outputs restricted to lie in the range from 0 to 1, so that they represent the probability of class membership [1]. While the classification is carried out, a specific pattern is assigned to a specific class according to the characteristic features selected for it. In this application, there were two classes: low risk and high risk. Classification results of ME were displayed by a confusion matrix. The confusion matrix showing the classification results of the ME is given as following (Table 3).
According to the confusion matrix, 8 patients were classified incorrectly by ME as non-LC patient in low risk group and no patient was classified as non-LC in high risk group.
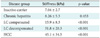
The values of statistical parameters are given in (Table 4). The ME classified expert 1 (low risk) is lower parameter than expert 2 (high risk) except AST. Estimated gating networks are expert 1 (49.76%) and expert 2 (50.24%).
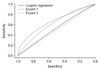
The performance of the ME model can be evaluated by plotting a ROC curve for the test (Figure 3). For a given result obtained by a classifier system, four possible alternatives exist that describe the nature of the result: 1) true positive (TP), 2) false positive (FP), 3) true negative (TN), and 4) false negative (FN) [11]. ROC curves which are shown in (Figure 3) represent performances of the stand-alone logistic regression and ME structure in liver stiffness data. This shows that the performance of the ME is higher than that of the stand-alone logistic regression.
IV. Discussion
In this work, we have presented the use of ME structure to improve accuracy of liver cirrhosis detection in Fibroscan since the overall structure predictive performance is superior to any of the individual experts. In order to detect hidden-subgroup, two local experts and a gating network were used and these experts were divided by low/high risk group. The EM algorithm was used for estimating the ME structure, which is like the maximum problem. The classification results which are the values of statistical parameters and ROC curves were presented for assessing performances of the ME and standalone logistic regression model in liver stiffness data. This shows that the performance of the ME is higher than that of the stand-alone logistic regression.
The proposed ME structure method for diagnostic decision support is a flexible approach that is applicable to assist physicians in the treatment of liver cirrhosis patients. Extending the modified ME structure for the longitudinal data may be developed. Another extension interest is the ME structure for the censored data, simply modifying experts into Cox proportional hazard regression.


 XML Download