

 PDF
PDF ePub
ePub Citation
 Print
Print


I. Introduction
Medical imaging technology provides effective tools for reliable assessment of diseases via various digital image Analysis. Its development history goes back to the early 1980s, but the wide adoption in clinics is not very old. This change obviously accompanied the improvement of computer technology, that yielded 1) improved accessibility to digital data, 2) progressive increase of data set sizes, 3) increased pressure for improved efficiency in healthcare systems, and 4) increased use of image data. Recently the usefulness of the technology made its applications not limited to "native" digital methods, such as computed tomography (CT) and magnetic resonance imaging (MRI), but extended further to conventional analogue imaging modalities (e.g., endoscopy and radiography). Now it is considered one of indispensible parts in medical diagnostics in conjunction with picture archiving and communication system.
Computer aided diagnostic (CAD) systems must be one of the most prospective applications of this medical imaging technology. The basic concept of CAD is to provide a valuable second opinion to assist radiologists' image interpretation by improving the accuracy and consistency of radiological diagnosis and also by reducing the image reading time. To achieve a good quality, it is important to employ effective image analysis techniques in major steps of the CAD scheme, and a number of researchers have reported their efforts in the development of CAD systems in various medical images [1-4].
In CAD, medical images consist of individual pixel elements, to which discrete brightness or color values assigned. They can be processed effectively, evaluated objectively, and made available at many sites at the same time by using appropriate networks and protocols. Generally, we should consider three aspects in medical image analysis [5]. First, biological structures are subject to both inter- and intraindividual alterability. Thus, universal formulation of a priori knowledge is not as effective as specific case treatments. Second, interesting biological structures often cannot be separated conveniently from others because the diagnostically relevant object is represented by the entire image. Finally, reliability and robustness of algorithms is necessary. These mean that images, which cannot be processed correctly, must be automatically classified as such rejected and withdrawn from further processing.
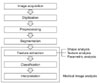
Medical image analysis is generally performed in a systematic sequence, of which steps are used for quantitative measurements as well as abstract interpretation of biomedical images (Figure 1). They require a priori knowledge on the nature and content of the images, which must be integrated into the algorithms on a high level of abstraction. Thus the processing a medical image is very specific, and an algorithm for one application domain can be transferred rarely directly into others.
In this review, we aim to introduce several important analysis methods that have been put forth specifically in the area of medical image analysis over the past three decades. For this, we especially focus on two technical steps in the analysis sequence: "feature extraction" step and "classification" step. A feature extraction step may be categorized into one of three categories, which are shape analysis, texture analysis, and parametric analysis.
II. Image Analysis Methods
1. Shape Analysis
The shape of an object refers to its profile and physical structures. These characteristics can be represented by the boundary, region, moment, and structural representations. These can be used to match shapes, to recognize objects, and to make measurements of shapes.
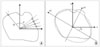
Shape descriptor features are calculated from object's contour: i.e. circularity, aspect ratio, discontinuity, angle irregularity, length irregularity,complexity, rightangleness, sharpness, and directedness. Those are translation, rotation and scale invariant shape descriptors [6-8]. All contour-based data representations usually result in substantial data compression compared to image matrix. For example, a radial functions R(θ) shows the distance R between an interior point and the contour points, as a function of the polar angle θ, In Figure 2, Ri represents a distance between i-th boundary point and centroid of obejct.
Many shape features also can be conveniently represented in terms of moments, such as perimeter, area, radial function, bending energy, roundness, and symmetry. Moments based features are used for recognition of small sets of distinct objects or for pre-classification before more precise comparison in order to reduce number of candidates. For instance, orientation of objects can be defined as angel between x axis and principal axis (x1): axis around which the object can be rotated with minimum inertia. In selecting descriptors, there are certain desirable qualities: 1) uniqueness that there is one and only one set of descriptors for a given two-dimensional shape, 2) calculation independency that a descriptor independent from others can be discarded without additional calculation of the others (especially, a descriptor which does not affect to others may be eliminated painlessly), 3) rotation invariance that the orientation of a object doesn't affect the value of the descriptor, and 4) scale invariance that the outline will not affect the outcome (e.g., a large circle and a small one have the same shape).
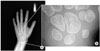
Shape descriptors are important in several contexts. For example, the shape and the size of tumors in mammograms are essential to classify them as benign or malignant. As is well-known, tumors with irregular shape are usually malignant and tumors with regular shape are usually benign [9,10]. Another example is the use of shape analysis of carpal bones for bone age assessment (Figure 3). In this case, we can consider several features as follows: The ratio of the total area of all carpal bones to the total area of the capitates. The ratio of the total area of all carpal bones to the total area of the hamate. The ratio of the perimeter of the capitate to the distance between the centroid of the capitate and the hamate, etc.
2. Texture Analysis
Some diseases, such as interstitial fibrosis, affect the lungs in such a manner that the resulting changes in the X-ray images are texture changes as opposed to clearly delineated lesions. In such applications, texture analysis methods are ideally suited for these images.
Image texture refers to the spatial relationship of pixel values in an image region. Texture also determines the local spectral or frequency content in an image. Here, changes in local texture should cause changes in the local spatial frequency [11]. Based on these definitions, there are ongoing studies into various mathematical methods of quantifying image texture, including statistical, Fourier, and wavelet-based methods. Texture analysis is a three-layer process [12]. The first layer identifies the texture primitives, of which make up texture patterns are composed. The second layer extracts certain properties from the identified texture primitives. Depending on the types of primitives, the properties can be tonal or geometric. The third layer builds the spatial and/or statistical distribution of the primitives in terms of their attributes.
Texture analysis has a long history, and a wide variety of methods has been studied and proposed in the past [13-15]. The gray level co-occurrence matrix (GLCM) is recognized as the most representative algorithm in spatial texture-related research [16-18]. In brief, a GLCM is constructed by systematically considering the relationship between pixel pairs and tabulating the frequency of various gray level combinations within an image or within a region of interest. In a similar manner, run-length features can be computed to evaluate the coarseness of a texture in a predetermined direction. A gray-level run consists of a set of consecutive collinear pixels in a given direction.
A wavelet transform provides improved flexibility over Fouier transform, with trading some degree of spatial-frequency resolution for the ability to localize this frequency content in time. The wavelet transform may be intuitively understood by imagining a window of constant area but fluid dimensions, its width(time) narrowing with increasing length (spatial frequency), and vice versa, by making it equally suitable for identifying fine texture (short bursts of high spatial frequency) and coarse texture (slow waves of low-frequency content) [19-21]. For example, the wavelet energy features reflect the distribution of energy along the frequency axis over scale and orientation, and have proven to be very effective for texture characterization. Because most relevant texture information is removed by iterative low-pass filtering, the energy of the low-resolution image is generally not considered a texture feature. The wavelet entropy can be interpreted as a measure of uncertainty, variability, and complexity. Entropy reaches its maximum in a completely random state and its minimum in a state of certainty. As a result, a homogeneous region produces zero entropy.
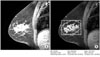
Characterization of microcalcifications (MCs) on mammograms will be a good example of texture analysis (Figure 4). A variety of computer-extracted features and classification schemes have been used to automatically discriminate between benign and malignant clusters. This approach is based on extracting image features from regions of interest and estimating the probability of malignancy for a given MC cluster [22,23].
3. Parametric Mapping Analysis
Parametric mapping analysis is generally used to identify functionally specialized responses and is the most prevalent approach to characterizing functional anatomy and disease-related changes. It entails the construction of spatially extended statistical processes to test hypotheses about regionally specific effects. Resultant parametric maps are image descriptors with voxel values that are, under the null hypothesis, distributed according to a known probability density function.
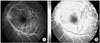
Dynamic perfusion imaging utilizes the imaging evaluation of bio-distribution of the contrast medium infusion acting as a tracer (Figure 5). The contrast medium following infusion is distributed into the body tissue in relation to local microvascularization and on the diffusion across the endothelial membrane into the interstitial space [27]. The imaging depicts the distribution of the contrast medium by measuring variations in the vessels and in the tissue enhancement over time. The elaborated images are represented by parametric color maps.
The perfusion studies, both with CT and or MRI, considered by recent studies, can be used for preoperative grading of the gliomas, in particularly for the differential diagnosis of low and high-grade astrocitomas because these technique can provide complementary information about tumor hemodynamics, not available with conventional CT or MR.
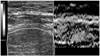
Elastography is a non-invasive method in which stiffness or strain images of soft tissue are used to detect or classify tumors [28]. A tumor or a suspicious cancerous growth is normally 5 to 28 times stiffer than the background of normal soft tissue. When a mechanical compression or vibration is applied, the tumor deforms less than the surrounding tissue. i.e. the strain in the tumor is less than the surrounding tissue. While sonograms convey information related to the local acoustic backscatter energy from tissue components, elastograms relate to its local strain (Figure 6). Some research has been conducted using magnetic resonance elastography and CT. However, ultrasonography still has the advantages of being cheaper, faster and more portable over other techniques.
4. Classification Methods
Classification is a step used for detecting or analyzing patterns of interest contained within images, and performed by experimenting with many different types of classifiers (classification model), comparing their performance and choosing the best.
In quantitative analysis, not only feature selection is important, classifier selection and training are very important. A number of classifiers have been used, including the nearest neighborhood, neural networks, Fisher discriminant analysis, fuzzy-based methods, and learning vector quantization, etc. [29-31].
Linear discriminant analysis is a statistical technique to classify a set of observations into predefined classes. The model is built based on a set of observations (or training set) for which the classes are known. Based on it, the technique constructs a set of a linear function of the predictors, known as discriminant functions. This technique can be used to determine the variables discriminating between two or more naturally occurring groups.
Artificial neural networks (ANNs) work, as do linear discriminants, by mapping a generally multidimensional observation to a scalar decision variable. Unlike linear discriminants, however, ANNs typically use a non-linear mapping function. In its simplest form, a neural network is a set of connected nodes roughly resembling the human neuron system. Artificial neural networks are automated classifiers that have been extensively applied to the field of medical imaging over the past 20 years with much success.
In recent years the support vector machine (SVM) has started to have widely been used as a very successful classifier [32]. SVM attempts to separate points belonging to two given sets in multi-dimensional space by a nonlinear surface, often only implicitly defined by a kernel function. An important advantage of the SVM is that it is based on the principle of structural risk minimization. Thus SVMs aim at minimizing a bounding on the generalization error.
Generally, classifiers require a supervised training technique, image samples are divided into two sub sets. One is used to determine the discriminant function (training) and the other to test the derived function (testing). Since there is a limited amount of available data in training, it is very important to test with enough extra data.
III. Conclusions
In this review, we briefly introduced several image analysis techniques for medical image quantification. The last few decades have resulted in an enormous amount of work related to image analysis. The main objective of this review was to attempt to cover the diversity of methods for shape, texture, and parametric description, and provide a guide that the clinician can use for further research. They will be essential for the development of CAD systems for more accurate diagnosis and prognosis.
 XML Download