

 PDF
PDF ePub
ePub Citation
 Print
Print


INTRODUCTION
In children with significant adenotonsillar hypertrophy (ATH), intermittent hypoxia during sleep from upper airway obstruction may lead to pulmonary vasoconstriction, pulmonary hypertension, and right ventricular (RV) dysfunction.1) Pulsed-wave and tissue Doppler indices, such as the RV myocardial performance index (MPI) and the ratio between tricuspid inflow Doppler velocity during early diastole (E) and tricuspid annular tissue Doppler velocity during early diastole (E′) (tricuspid annulus E/E′), have been used to evaluate the negative effect of ATH on RV function.1)2)3)4) However, early detection of RV dysfunction using RV MPI could be challenging in children with significant ATH, because RV MPIs do not always differ between children with ATH and controls.5) Therefore, a more sensitive echocardiographic parameter that could be used to detect subtle RV dysfunction in children with significant ATH would be beneficial for patient selection for adenotonsillectomy. The value of right atrial (RA) analysis for evaluation of RV dysfunction, morbidity, and mortality has been shown in studies of tetralogy of Fallot6) and Eisenmenger syndrome.7) However, the clinical value of RA function analysis in children with significant ATH has not been well studied. Velocity vector imaging is an angle-independent method that uses speckle and endocardial contour tracking to quantify regional and global cardiac functions.8) To date, RA mechanical deformation, as represented by peak longitudinal RA strain (PLRAS) in systole using velocity vector imaging, has not been used to evaluate preoperative RA reservoir function and associated RV dysfunction in children with significant ATH. In adults with simulated obstructive sleep apnea syndrome (OSAS), atrial remodeling from increased atrial wall stress may cause atrial conduction delay and inhomogeneous atrial depolarization, resulting in prolonged P-wave duration and P-wave dispersion (PWD) on surface 12-lead electrocardiogram (ECG).9) The present study aimed to evaluate PLRAS in children with significant ATH with sleep-related breathing disorder (ATH-SRBD) undergoing adenotonsillectomy to detect possible RV dysfunction, and to compare the clinical usefulness of PLRAS for differentiating preoperative children with ATH-SRBD from controls with those of ECG and conventional echocardiographic parameters.
METHODS
Research involving human participants and/or animals
Ethical approval: All procedures performed in studies involving human participants were in accordance with the ethical standards of the Institutional Review Board of CHA University Bundang Medical Center and with the 1964 Helsinki Declaration and its later amendments or comparable ethical standards (approval number: 2016-12-010-002).
We retrospectively studied preoperative clinical and echocardiographic parameters of children with ATH-SRBD who underwent adenotonsillectomy at CHA Bundang Medical Center from January 2013 to January 2015. All available follow-up echocardiograms after adenotonsillectomy were also studied. In addition, we retrospectively studied the controls, which included healthy children who underwent echocardiography for evaluation of murmur or chest pain and were found to have no significant cardiac causes.
Complete otolaryngologic examinations and lateral neck radiographs were performed for all children with significant ATH. Hypertrophy of the tonsils was categorized as follows: grade I, tonsils confined to pillars; grade II, tonsils that extend just outside the pillars; grade III, tonsils that extend outside the pillars, but do not meet in the midline; and grade IV, large tonsils that meet in the midline.10)11) The adenoid-nasopharynx ratio was calculated from lateral neck radiography.12) Significant adenoid hypertrophy was defined by an adenoid-nasopharynx ratio > 0.55.10)11)13) To assess the severity of SRBD, children with significant ATH completed a previously validated pediatric sleep questionnaire (PSQ).11)14) Parents of children with significant ATH answered yes or no to 22 questions, and a score ranging from 0 to 1 was assigned. A total score above 0.33 (33% of the 22 question items answered positive) was suggestive of SRBD.11)14)
Inclusion criteria were children with grade III or IV tonsillar hypertrophy, an adenoid-nasopharynx ratio > 0.55, a total PSQ score of > 0.33, and who underwent subsequent adenotonsillectomy. Children with grade I or II tonsillar hypertrophy, and children with total PSQ scores of ≤ 0.33 were excluded from our study. Other exclusion criteria were the following: patients with structural congenital heart disease, clinically significant arrhythmia, poorly controlled asthma, neuromuscular disorders that affect breathing, abnormal craniofacial structures, bony abnormalities of the chest such as funnel chest, and children who underwent adenotonsillectomy for recurrent tonsillitis.15) Demographic variables collected were age, sex, body surface area (BSA), heart rate, and systolic and diastolic blood pressures.
Echocardiograms were acquired using commercially available ultrasound equipment (Acuson SC 2000, Siemens Medical, Mountain View, CA, USA). All echocardiographic analyses were performed retrospectively by a single pediatric cardiologist who at the period of analysis was blinded to group allocation (children with ATH-SRBD versus controls). Conventional echocardiographic parameters such as left ventricular ejection fraction, RV fractional area change, tricuspid inflow Doppler velocity during early diastole (E), tricuspid inflow Doppler velocity during atrial contraction (A), and tricuspid annular tissue Doppler velocity during early diastole (E′), were measured according to the American Society of Echocardiography recommendations.16) The tricuspid annulus E/E′ was also calculated. Pulmonary artery acceleration time was obtained from the pulsed wave Doppler recordings of the pulmonary artery.17) Mean pulmonary artery pressure was derived from the following regression equations utilizing pulmonary artery acceleration time: [48 − (0.28 × pulmonary artery acceleration time)].17)
For myocardial deformation analysis, digital images obtained at 70 frames per second and stored for offline analysis were analysed using velocity vector imaging software (Siemens Medical, version 3.0). To obtain PLRAS, endocardial border of RA at an apical 4-chamber view was manually traced and then automatically tracked by the velocity vector imaging software (Figure 1).18)19) Traced contours were manually adjusted for adequate tracking as necessary. PLRAS was obtained at the end of systole (at the end of the T wave) to represent the RA reservoir phase. PLRAS values of 3 RA segments (interatrial septum, roof and lateral free wall of RA) were averaged (Figure 2 and Figure 3). Three cardiac cycles were analysed and averaged. Maximum RA volumes were calculated from an apical 4-chamber view at end-systole, using the area-length method,16) and was indexed to BSA. RV longitudinal peak systolic strain and strain rate (SR) values of 6 segments (3 from the RV free wall and 3 from the interventricular septum) from an apical 4- chamber view were identified at the onset of QRS wave and averaged.
Figure 1
A velocity vector imaging of peak longitudinal right atrial strain during systole. RA: right atrium.
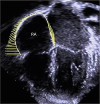
Figure 2
An example of PLRAS during systole obtained as the average of the three segments of the right atrium (septum, lateral wall, and roof) from a healthy control. PLRAS: peak longitudinal right atrial strain.
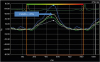
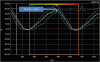
Figure 3
An example of PLRAS during systole obtained as the average of the three segments of the right atrium (septum, lateral wall, and roof) preoperatively from a child with significant adenotonsillar hypertrophy and sleep-related breathing disorder. PLRAS: peak longitudinal right atrial strain.
12-lead ECGs for patients and controls were recorded at a speed of 25 mm/s and amplitude of 1 mV/cm, scanned and measured with calipers.20) The definition of the P-wave on- and off-set was where the beginning of the P-wave inflection crossed the isoelectric line and where the return of the P-wave deflection met the isoelectric line.21)
The PR interval was obtained from lead II. PWD was defined as the absolute difference between the minimum and maximum P-wave durations in any of the 12 ECG leads.22)
All data were analyzed using SPSS Version 23 (IBM SPSS Statistics 23, Armonk, NY, USA) and MedCalc for Windows, version 17.5 (MedCalc Software, Ostend, Belgium). Continuous variables are expressed as mean ± standard deviation and categorical variables as numbers and percentages. Differences between preoperative children with ATH-SRBD and controls were analyzed using independent t-tests or Mann-Whitney U tests, as appropriate, according to the results of the Shapiro-Wilks test. Chi-square tests were performed for categorical variables. Paired t-tests or Wilcoxon signed rank tests were performed for comparisons of preoperative and postoperative data of children with ATH-SRBD. Pearson's and Spearman's correlations were calculated to evaluate correlations of independent variables and PLRAS. A p-value < 0.05 was considered as significant. Receiver operating characteristic curve (ROC) analysis was performed for PLRAS, tricuspid annulus E/E′, maximum P-wave duration (Pmax), and PWD to differentiate preoperative children with ATH-SRBD from controls.
Intraobserver reproducibility was assessed by calculating the mean percentage error (calculated as the absolute difference divided by the mean of two datasets)23) of two sets of PLRAS, RV longitudinal peak systolic strain and SR values from 11 children obtained offline 4 weeks apart.
RESULTS
In total, 56 children, comprising 23 controls and 33 children with ATH-SRBD without symptoms of heart failure and who underwent adenotonsillectomy, were studied. All children had sinus rhythm. Clinical, electrocardiographic, and echocardiographic parameters of the preoperative children with ATH-SRBD and controls are shown in Table 1. Preoperatively, Pmax and PWD were significantly increased in children with ATH-SRBD compared with controls. Preoperative heart rate was significantly higher in children with ATH-SRBD compared with controls. None of the children showed severe tricuspid regurgitation. Preoperatively, among the conventional echocardiographic parameters, only tricuspid annulus E/E′ was significantly higher in children with ATH-SRBD compared with controls (Figure 4). Preoperatively, PLRAS was significantly decreased (Figure 4), but RV longitudinal peak systolic strain and SR did not differ in children with ATH-SRBD compared with those in controls.
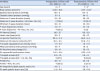
Table 1
Clinical, electrocardiographic, and echocardiographic parameters of preoperative children with significant ATH-SRBD and controls
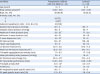
Data are presented as mean ± standard deviation.
ATH-SRBD: significant adenotonsillar hypertrophy and sleep-related breathing disorder, LV: left ventricular, PLRAS: peak longitudinal right atrial strain, RA: right atrial, RV: right ventricular, tricuspid annulus E/E′: ratio between tricuspid inflow Doppler velocity during early diastole (E) and tricuspid annular tissue Doppler velocity during early diastole (E′).
*p < 0.05 compared with controls.
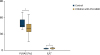
Figure 4
Comparison of PLRAS during systole and tricuspid annulus E/E′ between controls and preoperative children with ATH-SRBD. ATH-SRBD: significant adenotonsillar hypertrophy and sleep-related breathing disorder. E/E′: the ratio between tricuspid inflow Doppler velocity during early diastole (E) and tricuspid annular tissue Doppler velocity during early diastole (E′), PLRAS: peak longitudinal right atrial strain.
Blue boxes represent controls, green boxes represent children with ATH-SRBD.
*p < 0.05 when compared with controls.
From the ROC curve analysis, PLRAS was not inferior to tricuspid annulus E/E′, Pmax, and PWD in differentiating children with ATH-SRBD from controls. However, the discriminative ability of PLRAS, as well as those of the other 3 parameters, was poor (Figure 5 and Table 2).
Figure 5
Receiver operating characteristic curves of PLRAS during systole, tricuspid annulus E/E′, and electrocardiographic parameters (Pmax and PWD) to differentiate children with significant adenotonsillar hypertrophy and sleep-related breathing disorder from controls. AUC: area under the curve, E/E′: tricuspid inflow Doppler velocity during early diastole (E) and tricuspid annular tissue Doppler velocity during early diastole (E′), PLRAS: peak right atrial longitudinal strain, Pmax: maximum P-wave duration, PWD: P-wave dispersion.
The numbers in parentheses represent the 95% confidence intervals for the AUCs.
The p values (area = 0.5) for AUCs of PLRAS, tricuspid annulus E/E′, Pmax, and PWD are 0.0267, 0.0174, 0.0011, and 0.0163, respectively.
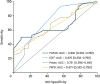
Table 2
Cut-offs of preoperative PLRAS during systole, tricuspid annulus E/E′, and electrocardiographic parameters in differentiating between children with significant adenotonsillar hypertrophy and sleep-related breathing disorder and controls

| Variables | PLRAS (%) | Tricuspid annulus E/E′ | Pmax (msec) | PWD (msec) |
|---|---|---|---|---|
| Cut-off value | ≤ 40 | > 3.4 | > 60 | > 40 |
| Sensitivity (%) | 48.5 | 68.8 | 93.9 | 30.3 |
| Specificity (%) | 91.3 | 56.5 | 43.5 | 100 |
In preoperative children with ATH-SRBD, only tricuspid annulus E/E′ negatively correlated with PLRAS (r = -0.486, p = 0.005), while other conventional echocardiographic parameters, age, heart rate, PWD, and mean pulmonary artery pressure showed no significant correlations between PLRAS.
The intraobserver variabilities were as follows: the mean percentage errors for PLRAS, RV longitudinal peak systolic strain and SR were 23%, 19%, and 22%, respectively.
Postoperative echocardiograms were available for 14 children of those who underwent adenotonsillectomy. The mean follow-up period between adenotonsillectomy and postoperative echocardiogram was 1.2 ± 0.4 years. No subjective symptoms of SRBD were noted in children with ATH-SRBD after adenotonsillectomy at the time of follow-up echocardiography. Comparison of preoperative and postoperative clinical, electrocardiographic, and echocardiographic parameters in children with ATH-SRBD are shown in Table 3. Postoperatively, in children who underwent adenotonsillectomy, Pmax, PWD, PLRAS, RV longitudinal peak systolic strain and SR, as well as other conventional echocardiographic parameters, did not differ from those in the preoperative period (Table 3).
Table 3
Comparison of preoperative and postoperative clinical, electrocardiographic, and echocardiographic parameters of children with significant ATH-SRBD
Data are presented as mean ± standard deviation.
ATH-SRBD: significant adenotonsillar hypertrophy and sleep-related breathing disorder, LV: left ventricular, PLRAS: peak longitudinal right atrial strain, RA: right atrial, RV: right ventricular, tricuspid annulus E/E′: ratio between tricuspid inflow Doppler velocity during early diastole (E) and tricuspid annular tissue Doppler velocity during early diastole (E′).
*p < 0.05 compared with preoperative data.
DISCUSSION
Our study showed significantly decreased preoperative PLRAS in children with ATH-SRBD compared with controls, even when RV longitudinal peak systolic strain and SR were similar. Preoperatively, in children with ATH-SRBD, we found prolonged Pmax and PWD and increased tricuspid annulus E/E′ compared with those of controls. Preoperatively, in children with ATH-SRBD, PLRAS showed a significant negative correlation with tricuspid annulus E/E′. At the postoperative follow-up, in children with ATH-SRBD who underwent adenotonsillectomy, PLRAS, tricuspid annulus E/E′, Pmax, and PWD did not differ from those of the preoperative period.
RA reservoir phase is when RA stores blood during systole and at isovolumetric relaxation.24) Impaired RA reservoir function has been associated with RV diastolic dysfunction (RVDD) in postoperative children with tetralogy of Fallot.6) Thus, the preoperative decrease in PLRAS in children with ATH-SRBD may indicate the presence of RVDD. However, concomitant RV systolic dysfunction (RVSD), due to the decrease in TV annulus movement from the base to the apex during systole, may also cause a decrease in PLRAS.25)26) Since preoperative RV longitudinal peak systolic strain and SR were similar between children with ATH-SRBD and controls, a preoperative decrease in PLRAS in children with ATH-SRBD may reflect RVDD independent of RVSD.
Recurrent hypoxemia and hypercapnia from OSAS could cause pulmonary artery vasoconstriction leading to pulmonary hypertension,1) causing RV hypertrophy and myocardial fibrosis, resulting in RVDD.27) However, in our study, preoperative mean pulmonary artery pressure did not differ between children with ATH-SRBD and controls. Of note, evidence of RV dysfunction independent of pulmonary hypertension in adults with OSAS has been reported.28)29) Increased sympathetic nervous activity could induce a compensatory growth of cardiac muscle cells, causing cardiac hypertrophy.30) Repetitive intrathoracic pressure swings due to OSAS could cause repetitive rises in systolic and diastolic RV wall tension, causing myocardial hypertrophy.31) Increased sympathetic drive, mechanical perturbations, and severity of RV dysfunction have been linked to the severity of apneic episodes.29) Such RV dysfunction could cause RA dysfunction detected as decreased PLRAS in preoperative children with ATH-SRBD.
We found prolonged preoperative Pmax and PWD in children with ATH-SRBD compared with controls, in agreement with previous studies in children4) and adults.21) In children with significant ATH, negative intrathoracic pressure changes could cause RA distortion and result in atrial remodeling, reflected as prolonged Pmax and increased PWD.32) Preoperative prolonged Pmax and increased PWD in children with ATH-SRBD may signify slowed conduction with inhomogeneous recovery in the atrium, increasing the risk of atrial fibrillation.22)
In our study, the usefulness of PLRAS was compared with that of tricuspid annulus E/E′. A tricuspid annulus E/E′ of ≥ 4 predicted an elevated RA pressure of ≥10 mmHg in patients undergoing non-cardiac surgery.33) We found the mean value of preoperative tricuspid annulus E/E′ in children with ATH-SRBD to be 4, which increased compared to that of controls, and may reflect an elevated preoperative RA pressure, suggesting RVDD. However, accuracy of tricuspid annulus E/E′ may be limited due to angle dependency and contraction of nearby myocardial segments.34) Therefore, in preoperative children with ATH-SRBD who do not show overt symptoms of right heart failure, tricuspid annulus E/E′, when used alone, would be limited in detecting subtle RVDD. In addition, the confidence intervals of both tricuspid annulus E/E′ and PLRAS showed substantial overlap with those of controls. This may explain why, in differentiating children with ATH-SRBD from controls, both the discriminative ability of PLRAS and tricuspid annulus E/E′ as an individual parameter was poor (Figure 5 and Table 2). Similarly, poor discriminative ability of left atrial strain in differentiating children in the acute phase of Kawasaki disease from normal children have been reported, possibly due to the wide range of atrial strain values.19) As RV diastolic function is made up of multiple phases, comprehensive usage of more than one parameter has been recommended for adequate assessment of RVDD.27) In children with significant ATH who have borderline scores in the PSQ, assessing SRBD may be challenging, and may complicate the decision whether to perform adenotonsillectomy. Therefore, a combined use of PLRAS and tricuspid annulus E/E′, as well as Pmax and PWD, rather than separate use of individual parameters may be beneficial for the detection of possible RVDD in children with significant ATH who have borderline scores in the PSQ.
The significant negative correlation with preoperative PLRAS and tricuspid annulus E/E′ may be because tricuspid annulus E/E′ is associated with the mean RA pressure.35) However, we did not find a significant correlation between PLRAS and Pmax or PWD. Since Pmax and PWD may reflect interatrial as well as intraatrial conduction delay, left atrial function may also have influenced the changes in Pmax and PWD in our study. Further studies involving LA deformation in children with ATH-SRBD will help elucidate the association of Pmax, PWD, and atrial deformation in these patients.
Because children with ATH-SRBD who underwent adenotonsillectomy had no subjective symptoms of SRBD at the time of follow-up echocardiography, we could assume postoperative improvement in RA deformation and RVDD, as previously reported.2)3)4) However, no significant difference was observed between preoperative and postoperative PLRAS. A possible reason for this similarity is that at postoperative follow-up, children with ATH-SRBD were significantly older and had higher BSA compared to those of the preoperative period. RA reservoir function has been reported to decrease with maturation,23) as atrial walls may become less compliant with age23); therefore, normal values of PLRAS may decrease with age. From our results, we could speculate that the changes in PLRAS due to maturation during postoperative follow-up may offset the improvement in PLRAS due to adenotonsillectomy. Further studies with larger cohorts of children are needed to elucidate this aspect.
In our study, children with ATH-SRBD did not undergo preoperative polysomnography, which is a limitation of this study. The gold standard of OSAS diagnosis in children is polysomnography, and the standard treatment for OSAS is adenotonsillectomy.15) However, overnight polysomnography is expensive and inconvenient, and not all centers are equipped to perform polysomnography; these factors may be associated with variability in incorporating preoperative polysomnography even among specialized sleep centers.15)36) Enlarged tonsil size has been well correlated with preoperative polysomnography data signifying OSAS,36) and the PSQ for assessing SRBD has been regarded as a screening tool for OSAS in children.37) To maximize the probability of OSAS in our study, we only included children with both significant ATH and high-risk SRBD who were likely to benefit from adenotonsillectomy. Other limitations of our study include the retrospective design. We acquired our deformation data from the apical four-chamber view only. If multiple planes were used, a relatively larger number of segments would have been analysed. In addition, PLRAS was compared to tricuspid annulus E/E′, Pmax, and PWD because no children in our study underwent cardiac catheterization to obtain invasive hemodynamic data for the evaluation of RVDD. However, since no children in our study had overt symptoms of heart failure, cardiac catheterization did not seem necessary. In addition, the method of measuring P-wave duration might have influenced our results, as we used calipers20) rather than digital measurement techniques.22) Because of loss to follow-up, not all postoperative echocardiograms were available for children with ATH-SRBD who underwent adenotonsillectomy. Therefore, the small number of postoperative echocardiograms might have influenced our statistical results.
In conclusion, impaired RA deformation was reflected as decreased PLRAS in children with ATH-SRBD before adenotonsillectomy. Decreased PLRAS in these children may indicate subtle RV dysfunction and increased proarrhythmic risk. However, usefulness of PLRAS as an individual parameter in differentiating preoperative children with ATH-SRBD from controls was limited, similar to those of tricuspid annulus E/E′, Pmax and PWD.
 XML Download