

 PDF
PDF ePub
ePub Citation
 Print
Print


INTRODUCTION
Like left ventricular (LV) systolic dysfunction, the presence of right ventricular (RV) systolic dysfunction is also an independent prognostic marker of several cardiovascular diseases.1)2)3) Because the RV has a complex anatomy and different functional mechanism, it is difficult to objectively evaluate. Although there are several conventional echocardiographic indices that can indicate RV systolic function, there is no echocardiographic index to represent intrinsic myocardial properties. Cardiac magnetic resonance imaging (CMR) is a gold standard in the measurement of RV ejection fraction along with evaluation of RV structure.4) However, the CMR is not available in all institution. Thus, some researchers began using strain echocardiography to measure RV systolic function.
Strain is a dimensionless parameter and is calculated from a change in length between two points before and after movement. With some technical improvement, myocardial strain can be measured with echocardiographic images, and strain echocardiography was introduced in clinical settings to offer a noninvasive and objective marker of myocardial contractility. Myocardial strains represent regional and global myocardial systolic function.5) LV strain values estimated from two-dimensional speckle tracking echocardiography (2DSTE) are strong prognostic factors for several cardiovascular diseases, independent of LV ejection fraction (LVEF).6)7) Moreover, strain echocardiography can detect subclinical myocardial changes in their early stages,8) and can be a prognostic marker for many cardiovascular diseases.9)10)11)
After strain echocardiography was applied to measure RV systolic function, it became more popular in research. RV strain values, especially RV global longitudinal strain (RVGLS), have advantages over other conventional echocardiographic parameters of RV systolic function.12)13) Moreover, RVGLS has prognostic capability for several cardiovascular diseases. Despite several limitations associated with RV strain analysis, it is included in recent echocardiographic guidelines.14)
In this review, we discuss measurement, normal reference values, and the clinical importance of RVGLS.
ECHOCARDIOGRAPHIC PARAMETERS OF RIGHT VENTRICULAR FUNCTION
RV has a complex anatomy and different systolic motion, so echocardiographic measurement of RV systolic function is challenging in routine echocardiographic examination.15) The superficial location of the RV just beneath the sternum is another obstacle in echocardiographic evaluation. The visual assessment of RV systolic function is the most commonly used method in routine clinical practice. To objectively assess RV systolic function by echocardiography, we measure conventional echocardiographic indices and strains with strain echocardiography.14)
Because the RV has triangular shape, measurement of RV ejection fraction (RVEF) is difficult by routine echocardiographic examinations. Thus, current echocardiographic guideline does not include RVEF in the objective evaluation of RV systolic function. The measurement of RVEF routinely can be done with CMR or radionuclide scan.
Conventional echocardiographic parameters
All researchers and practitioners are generally in agreement that there is no single best echocardiographic indicator of RV systolic function; thus, several echocardiographic indices of RV systolic function are currently used. Fractional area change of RV (RVFAC), tricuspid annular plane systolic excursion (TAPSE), tricuspid S’ velocity, and RV myocardial performance index (RV Tei index) are commonly used parameters in conventional echocardiography.
RVFAC is a global parameter of RV systolic function and it can be calculated using the RV-focused apical 4-chamber view with the following formula: RVFAC (%) = (RV end-diastolic area − RV end-systolic area) / RV end-diastolic area × 100 (Figure 1A). The normal reference value range for RVFAC is 49 ± 7%, and abnormal values are < 35%.14)16)
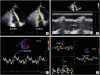
Figure 1
(A) Measurement of right ventricular (RV) systolic function with conventional echocardiographic method: RV fractional area change is calculated from the division of the subtraction of the RV end-systolic area (RVESA) to the RV end-diastolic area (RVEDA) by RVEDA. (B) Tricuspid annular systolic excursion (TAPSE) is the distance between end-diastolic and peak systolic points of the lateral tricuspid annulus. (C) Tricuspid annular S’ velocity can be measured by tissue Doppler application of the lateral tricuspid annulus. (D) The RV Tei index can be measured conventionally by pulsed Doppler [(tricuspid valve closure to opening time (TCO) − ejection time of pulmonic valve (PVET)) / PVET] or the tissue Doppler method [(isovolumic contraction time (ICT) + isovolumic relaxation time (IVRT)) / ejection time (ET)] from the tricuspid annulus.
TAPSE is another indicator of RV longitudinal systolic function. It is measured as the length between the end-diastolic and peak systolic points of the lateral tricuspid annulus (Figure 1B). The normal TAPSE value range is 24 ± 3.5 mm, and any value < 17 mm is regarded as abnormal.14)16)
Tricuspid annular S’ velocity can also be used as an indicator of RV longitudinal systolic function. It can be measured by tissue Doppler application of the lateral tricuspid annulus (Figure 1C). The normal tricuspid annular S’ velocity value range is 14.1 ± 2.3 cm/sec.
The RV Tei index is another global index of RV systolic function (Figure 1D). It can be measured via a conventional method using pulsed wave Doppler of the tricuspid annulus [(tricuspid valve closure to opening time − ejection time of pulmonic valve) / ejection time of pulmonic valve] and tissue Doppler method [(isovolumic contraction time + isovolumic relaxation time) / ejection time]. The normal value ranges of the conventional RV Tei index is 0.26 ± 0.09 and the tissue Doppler RV Tei index is 0.38 ± 0.08.14)16) Among these values for RV systolic function, there is no parameter representing intrinsic myocardial function.
Right ventricular longitudinal strain
Unlike other echocardiographic parameters of RV systolic function, strain values can assess intrinsic myocardial performance and can differentiate active movement from passive movement.17) Longitudinal strain, which can be measured by Doppler tissue image (DTI) and 2DSTE, is a reliable and accurate way to measure RV systolic function, and has been validated in an animal study with sonomicrometry18) and with CMR for several human cardiovascular diseases.19)20)21)22) Strain analysis using 2DSTE provides an angle-independent measurement of RV systolic function with better reproducibility than DTI analysis. The RV has a distinct myocardial structure compared with the LV. The RV wall is mainly composed of superficial and deep muscle layers, where the fibers of the superficial layer are arranged more or less circumferentially and the deep muscle fibers are longitudinally aligned from base to apex. The deep muscle layers account for about 80% of RV contraction23); thus, RV longitudinal strain to assess longitudinal contraction of the RV is a good marker of RV systolic function. Global longitudinal strain (GLS) by 2DSTE is the most commonly used echocardiographic parameter for detection of RV systolic function in several cardiovascular diseases. RVGLS is significantly correlated with RV ejection fraction (Pearson correlation coefficient = −0.50 to −0.80) via CMR.21)24)25)26) RVGLS was significantly correlated with TAPSE (r = −0.547 to −0.83), RVFAC (r = −0.213 to −0.73), tricuspid S’ velocity (r = 0.718), and RV Tei index (r = 0.590).7)21)24)27)28)
METHODS TO MEASURE GLOBAL LONGITUDINAL STRAIN OF THE RIGHT VENTRICLE
There are several available analysis algorithms, including EchoPAC PC software (GE Medical Systems, Milwaukee, WI, USA), velocity vector imaging (VVI; Siemens Medical Solutions, Mountain View, CA, USA), and TomTec software (Image Arena 4.6; Munich, Germany), which are the three most commonly used 2DSTE algorithms.29) The RV free wall and ventricular septum are both divided into three segments (basal, mid, and apical). RVGLStotal is a measurement obtained from the average of the values from all six segments and RVGLSfree wall is the average value from three RV free wall segments.
EchoPAC PC software
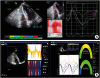
EchoPAC PC software is the most commonly used algorithm. After tracing the endocardial border on an end-diastolic frame by clicking three separate points (apex, lateral, and septal points of the tricuspid annulus), or placing more than six points over the endocardial border, the software automatically tracked the contour on subsequent frames. The region of interest (ROI) is automatically estimated and can be adjusted to fit the thickness of the RV free wall and the septum. Adequate tracking was verified in real time and was corrected by adjusting the ROI or manually correcting the contour to ensure optimal tracking (Figure 2A). Although EchoPAC PC has most commonly been used to measure RV systolic function, it is a vendor-specific software and can only analyze echocardiographic images from GE machines.
Velocity vector imaging software
VVI is an off-line software package for measuring strain values. After manually drawing the RV endocardial border over one frame, endocardial borders are automatically tracked throughout the cardiac cycle.5) Speckles are tracked in the echocardiographic image and myocardial velocity is calculated as the ratio between the time interval and frame-to-frame displacement (Figure 2B). These velocity vectors are displayed throughout the cardiac cycle, and the two-dimensional strain and strain rate are calculated by comparing the speckle displacement in relation to other speckles along the endocardial border throughout the cardiac cycle. Myocardial velocity, peak systolic longitudinal strain, and the strain rate are recorded for each segment (Figure 2B). This software can measure strains in echocardiographic images from all models of commercially available echocardiographic machines, as long as the images were stored in the digital imaging and communications in medicine (DICOM) format.
TomTec software
TomTec software is another type of software for deformation analysis (2D Cardiac Performance Analysis). TomTec is a vendor-independent program that can measure all echocardiographic images stored in DICOM format. For deformation analysis, endocardial borders were manually traced on the end-systolic frame. The software tracks speckles along the endocardial border and myocardium throughout the cardiac cycle.
WHAT ARE THE NORMAL REFERENCE VALUES?
In RV strain analysis, there are two kinds of longitudinal strain, including RVGLStotal and RVGLSfree wall. The RVGLStotal value includes the strain value of the ventricular septum and RVGLSfree wall. There are vendor differences in terms of strain value estimates.30)31) Recently, several studies showed sex and age difference in strain values, and women have higher absolute values than men.32)33) Thus, we should consider the reference values for RVGLStotal and RVGLSfree wall according to vendor and patient age and sex. Table 1 summarizes the normal value range for RVGLS.28)30)32)33)34) RVGLSfree wall > −19% was used as a cut-off value for detecting RV dysfunction in one study performed with EchoPAC software.28) However, this value should be used cautiously in different study populations.
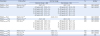
Table 1
Normal reference values for right ventricular global longitudinal strain according to sex, age, and vendors
| Parameter | First author | Normal range | N | Vendor | |
|---|---|---|---|---|---|
| Women (mean±SD) | Men (mean±SD) | ||||
| RVGLStotal (%) | Muraru et al.32) | −26.7 ± 3.1 | −24.7 ± 2.6 | 276 | GE EchoPAC |
| RVGLStotal (%) | Park et al.33) | < 30 years old: −22.8 ± 2.5 | < 30 years old: −20.8 ± 2.9 | 493 | GE EchoPAC |
| 31–40 years old: −23.2 ± 3.6 | 31–40 years old: −20.1 ± 2.5 | ||||
| 41–50 years old: −22.5 ± 3.1 | 41–50 years old: −20.4 ± 3.0 | ||||
| 51–60 years old: −21.8 ± 3.1 | 51–60 years old: −21.0 ± 3.3 | ||||
| > 60 years old: −21.3 ± 3.7 | > 60 years old: −21.0 ± 3.0 | ||||
| RVGLStotal (%) | Meris et al.28) | −24.2 ± 2.9 | 100 | GE EchoPAC | |
| RVGLSfree wall (%) | Muraru et al.32) | −31.6 ± 4.0 | −29.3 ± 3.4 | 276 | GE EchoPAC |
| RVGLSfree wall (%) | Park et al.33) | < 30 years old: −28.2 ± 3.8 | < 30 years old: −25.8 ± 3.7 | 493 | GE EchoPAC |
| 31–40 years old: −28.5 ± 4.7 | 31–40 years old: −24.7 ± 3.5 | ||||
| 41–50 years old: −27.3 ± 4.0 | 41–50 years old: −25.3 ± 3.6 | ||||
| 51–60 years old: −27.1 ± 4.2 | 51–60 years old: −25.9 ± 4.2 | ||||
| > 60 years old: −25.2 ± 4.9 | > 60 years old: −26.1 ± 3.8 | ||||
| RVGLSfree wall (%) | Meris et al.28) | −28.7 ± 4.1 | 100 | GE EchoPAC | |
| RVGLSfree wall (%) | Fine et al.34) | −26.0 ± 4.0 | 116 | GE EchoPAC | |
| RVGLSfree wall (%) | Fine et al.30) | −21.7 ± 4.2 | 209 | VVI | |
WHY DO WE USE STRAIN TO EVALUATE RIGHT-VENTRICULAR FUNCTION?
RV systolic dysfunction is well known to be a poor prognostic factor for several cardiovascular diseases,7)27)35) while decreased RVGLS is an independent prognostic marker in patients with pulmonary hypertension, heart failure, ischemic heart disease, and cardiomyopathies. Because RVGLS is a global parameter of RV systolic function compared with other conventional parameters, such as TAPSE and tricuspid S’ velocity, which represent the displacement degree of the basal segment of the RV free wall, it correlates better with RV systolic function and prognostic power than other conventional parameters. Table 2 summarizes the results from several previous studies of RV strain.
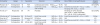
Table 2
Studies showing prognostic significance of right ventricular strain values in different patient population
| First author | Design | N | Population | Outcome | Cutoff (%) | Size of effect or test performance | Analysis software |
|---|---|---|---|---|---|---|---|
| Motoji et al.42) | Retrospective | 42 | PAH | Cardiovascular events | RVGLSfree wall: −19.4% | N/A | GE EchoPAC |
| Choi et al.7) | Retrospective | 51 | PAH | Event-free survival and mortality | RVGLStotal: −15.5% | Event-free survival (HR = 4.91, p = 0.001) | VVI |
| Mortality (HR = 8.84, p = 0.005) | |||||||
| Fine et al.44) | Prospective | 575 | PH | Mortality | Mortality per 6.7% decrease (HR = 2.59, p < 0.001, univariate, HR = 1.46, p < 0.001, multivariate) | GE EchoPAC | |
| D'Andrea et al.46) | Retrospective | 100 | PH from IPF | Event-free survival | RVGLStotal: −12.0% | Event-free survival (HR = 4.7, p < 0.001) | Philips |
| Grant et al.51) | Retrospective | 117 | Advanced HF | RV failure | RVGLStotal: −9.6% | N/A | VVI |
| Park et al.24) | Retrospective | 57 | ICM | Event-free survival | RVGLStotal: −15.4% | Event-free survival (HR = 3.95, p = 0.044) | VVI |
| Park et al.27) | Retrospective | 282 | Inferior AMI | Event-free survival and mortality | RVGLStotal: −15.5% | N/A | VVI |
Pulmonary hypertension
Pulmonary hypertension is a disease with increased pulmonary arterial pressure (mean pulmonary artery pressure ≥ 25 mmHg at rest), as measured during right heart catheterization. RV strain according to DTI was significantly correlated with cardiac index during right heart catheterization (r = −0.61, p < 0.001).36) There were significant correlations between RV strain and cardiac index (r = −0.67, p < 0.001) and pulmonary vascular resistance (r = 0.60, p < 0.001) in patients with normal LV systolic function. In a study of pulmonary arterial hypertension (PAH) patients, RV longitudinal strain value via DTI was lower, and longitudinal strain was strongly correlated with pulmonary artery systolic pressure (r = 0.56, p < 0.001).37) Park et al.38) reported that RV mid-ventricular strain from DTI was well correlated with RVFAC (r = −0.660, p < 0.001) and TAPSE (r = −0.642, p < 0.001) in patients with acute pulmonary embolism. RV mid-ventricular strain markedly improved in these patients after successful treatment. DTI-based RV mid-ventricular strain can be used to discriminate acute cor pulmonale from chronic cor pulmonale. In one study, mid-ventricular strain more than −12.2% could effectively differentiate acute form from chronic cor pulmonale with 83% sensitivity and 78.6% specificity.39)
There are more evidences on GLS with 2DSTE. These studies found that, in PAH patients, RVGLStotal is lower and is well correlated with serum B-type natriuretic peptide concentration and six-minute walking distance.40)41)42) This value is also significantly correlated with invasive hemodynamic data obtained during right-heart catheterization.41)43)
RVGLStotal in PAH patients was significantly correlated with RV ejection fraction according to CMR data (r = −0.69, p < 0.001).22) Lower RVGLStotal (≥ −15.5%) from VVI was associated with lower event-free survival (hazard ratio [HR] = 4.906, p = 0.001) and increased mortality (HR = 8.842, p = 0.005).7) RVGLS had a better net reclassification index value than TAPSE and pericardial effusion for predicting death among PAH patients. In one study with RVGLSfree wall, RVGLSfree wall ≥ −19.4% was the best predictor of cardiovascular events in PAH patients. Fine et al.44) reported their study results from a prospective cohort with pulmonary hypertension wherein they found a variable degree of pulmonary arterial pressure. They included 575 patients (mean age = 56 ± 18 years; 63% women), 406 of whom (71%) were diagnosed with pulmonary hypertension. The survival rate at 18 months varied according to RVGLSfree wall quartile (92%, 88%, 85%, and 71%, p < 0.001), and there was a 1.46 higher risk of death per 6.7% decline in RVGLSfree wall. Although RVGLStotal values were lower in patients with acute pulmonary embolism, this value did not significantly predict adverse clinical events.45)
RV function can be influenced by the presence of lung diseases. Idiopathic pulmonary fibrosis patients had significantly lower RVGLStotal and RVGLStotal according to Philips algorithm, and > −12% had poor long-term prognosis compared with controls (HR = 4.7, p < 0.001).46)
Systemic sclerosis is a risk factor for PAH. RVGLSfree wall was significantly lower in patients with systemic sclerosis than age-matched normal controls; however, conventional echocardiographic measures did not detect this subtle change.47) This result demonstrates the clinical utility of RVGLS for detecting subclinical alternations in RV function before symptom onset.
Heart failure
RV dysfunction is known to indicate poor prognosis in patients with heart failure.35) In particular, RV dysfunction is an indicator of mortality risk among patients with advanced heart failure who are undergoing intensive management strategies, including implantation of a LV assist device (LVAD).48) RV failure incidence ranged from 9%–44% in patients with LVAD implantation.49) Among conventional echocardiographic parameters of RV systolic function, tricuspid annular dilatation (≥ 23 mm/m2) and the ratio of RV:LV end-diastolic diameter were independent predictors of RV dysfunction.50)51)52) Unlike TAPSE, which did not have significant predictive value, RVGLSfree wall (cutoff value < 9.6%) was an independent marker of RV failure after LVAD therapy.51) Cameli et al.53) reported a correlation between RVGLS by 2DSTE and the RV stroke work index, in an analysis of 41 patients who were referred for heart transplantation. The RV stroke work index was strongly correlated with RVGLStotal (r = −0.75) and RVGLSfree wall (r = −0.82), but not with TAPSE or tricuspid S’ velocity.
Myocardial fibrosis is a major pathophysiologic process in several etiologies of heart failure. RVGLSfree wall had a strong correlation with RV myocardial fibrosis (r = 0.80, p < 0.001) in patients with severe systolic heart failure.54) However, degree of RV myocardial fibrosis was poorly correlated with TAPSE (r = −0.34, p = 0.05). RVGLS by 2DSTE performed better for detecting subclinical RV changes than other conventional echocardiographic indices. RVGLStotal and RVGLSfree wall were significantly linked to symptomatic profiles of heart failure patients.55)
Ischemic heart disease
RVGLStotal as measured by EchoPAC was significantly correlated with RV ejection fraction according to CMR (r = −0.797, p < 0.001), and lower RVGLS (≥ −15.4%) was associated with lower one-year event-free survival (93.0% vs. 67.2%, p = 0.030) in patients with ischemic cardiomyopathy.24) Impaired RVGLStotal (≥ −15.5%) according to the VVI algorithm was associated with significantly lower rates of survival and event-free survival in patients with inferior acute myocardial infarction.27) RVGLS offered a superior predictive power compared with other conventional echocardiographic indices of RV systolic function, such as RVFAC and TAPSE. RVGLStotal was better correlated with RV ejection fraction when measured by CMR and it also had superior power to detect RV dysfunction, as defined by the RV ejection fraction calculation (< 50%).26)
Arrhythmogenic right ventricular cardiomyopathy and other cardiomyopathies
Arrhythmogenic right ventricular cardiomyopathy (ARVC) is a rare disease characterized by myocardial atrophy with replacement of fatty tissue to the RV myocardium and a high incidence of ventricular tachyarrhythmias. In one study of 14 ARVC patients and 56 controls, the ARVC patients had significantly lower RVGLSfree wall than controls (-17.8 ± 6.7% vs. −24.6 ± 4.5%, p < 0.001).56) Vitarelli et al.57) reported an effect of undergoing an exercise test on changes in RVGLSfree wall in 19 ARVC patients. In contrast with normal controls and athletes who experienced RVGLSfree wall increases, RVGLSfree wall in ARVC patients decreased from baseline and did not increase after undergoing exercise stress. Also, when RVGLSfree wall > −18% is used as a cutoff value, it is superior to other conventional parameters.56)57)58) Decreased RVGLS can result from fatty deposition in the RV free wall and it can be used to detect ARVC at early stages.
For patients with hypertrophic cardiomyopathy, RVGLS is often lower with RV involvement in pathologic processes. One study that compared hypertrophic cardiomyopathy patients with athletes who engaged in competitive endurance training found that RVGLStotal was lower in the hypertrophic cardiomyopathy patients than in the athletes.59) D’Andrea et al.60) reported that RVGLStotal and RVGLSfree wall were lower in hypertrophic cardiomyopathy patients compared with normal controls, both before and after exercise. They also found a strong correlation between exercise capacity and RVGLStotal (r = −0.56, p < 0.001), as well as with decreased contractile reserve, in patients with hypertrophic cardiomyopathy.
LIMITATIONS OF RIGHT VENTRICULAR STRAIN MEASUREMENT
There are several limitations in applying RV strains in clinical settings. First, there is inter-vendor variability in strain estimates as a result of different algorithms.61) RVGLStotal estimates by two common algorithms were positively correlated (r = 0.60–0.80).45)62) One solution to the inter-vendor variability problems is to use the same software to measure strain and same echocardiographic machine in one patient. Second solution is using vendor-independent analyzing software, such as TomTec, with echocardiographic images that were taken from different echocardiographic machines. There have been recent efforts to reduce inter-vendor variability with a joint standardization task force. The European Association of Cardiovascular Imaging and the American Society of Echocardiography (ASE) created a joint standardization task force and invited two leading ultrasound manufacturers (GE medical systems and Philips medical systems). This effort led to successful reduction in the measurement variability of LV strain, toward similar variation as measured in LVEF.63) However, no study has yet to reduce inter-vendor variability with respect to RVGLS. The current recommendation to reduce inter-vendor variability in consecutive echocardiographic examinations is to use the same machine and software to measure strain values.
Second, unlike the LV strain measurement using apical-4, apical-3 and apical-2 chamber views, we only use apical-4 chamber view to measure RV strain. Focused RV view or modified apical 4 chamber view are recommended in current guidelines.14)64) Using focused RV view is strongly recommended to reduce foreshortening of the RV structure in the recent guideline.64) We should include these views in routine echocardiographic exams, especially for patients with diseases in which RV systolic function is important, such as heart failure, acute myocardial infarction, pulmonary hypertension, and ARVC. Theoretically, three-dimensional speckle tracking echocardiography (3DSTE) analysis is the best method for measuring RV strain.65) Technological advancements will make 3DSTE more feasible in the near future.
Third, inclusion of the interventricular septum is another issue. Some authors showed that RVGLSfree wall was better correlated than RVGLStotal with RV ejection fraction according to CMR. In a recent recommendation published by European Association of Cardiovascular Imaging (EACVI)/American Society of Echocardiography (ASE)/Industry Task Force to standardize deformation imaging, using RVGLSfree wall is the default in the measurement of RV strain.64) However, this recommendation included the statement that the including of the interventricular septum in to the analysis as an option for the users. In this review article, we described RVGLStotal and RVGLSfree wall separately. RVGLSfree wall values are more frequently negative than RVGLStotal values. Anatomically, the RV and LV share an interventricular septum. The RV free wall comprises the transverse fibers, and the LV is encircled by oblique fibers. The interventricular septum consists primarily of oblique fibers that extend into the RV outflow tract. Consequently, the LV actively contributes to about 80% of the flow and to 2/3 of the pressure generated by the RV during systole.66) This has been clearly demonstrated in animal experiments. If the pulmonary artery is banded, RV systolic pressure will increase significantly and RV stroke volume will decrease. If the pulmonary artery and aorta are banded together, RV systolic pressure will increase even further. However, RV stroke volume was observed to increase along with increased LV systolic function with aortic banding.67) Moreover, strain measurement of only the RV free wall is difficult for some strain measurement algorithms because of the strict differentiation between RV free wall and the interventricular septum. To better understand this problem, a new strain algorithm for measuring RV strain and further clinical studies are needed.
Finally, there is lack of prospective studies of RV strain. Although there are several studies indicating strong correlations between RVGLS and other conventional echocardiographic parameters or RV ejection fraction from CMR, these are retrospective studies that are not free from bias. Moreover, almost all studies that found that RVGLS had good prognostic power were also retrospective studies. Thus, we need further prospective studies with larger sample sizes that explore the challenges of inter-vendor variability, including the effect of this variability on treatment patterns and prognostication via RVGLS.
CONCLUSIONS
RVGLS is an objective and accurate marker of global RV systolic function that is strongly correlated with RV ejection fraction according to CMR. It has good prognostic power in many clinical studies. Although there are several limitations in applying this in clinical settings, it is a simple method for measuring RV systolic function and offers reliable feasibility. It can be a good indicator of RV dysfunction, especially at early stages.
 XML Download