

 PDF
PDF ePub
ePub Citation
 Print
Print


Introduction
Effusive-constrictive pericarditis (ECP) is an entity on the continuum between effusive and constrictive pericarditis.1) It was first formally described by Hancock2) in 1971, and only four series have been reported since.2)3)4)5) The condition is generally believed to be rare, occurring in only 1.2% of patients with a pericardial effusion, but it is more frequently found in the context of tuberculous pericardial disease (52.9%).6) The diagnosis of ECP is made by employing direct, invasive, hydrostatic pressure recordings in the pericardial space and the right atrium both pre- and post-pericardiocentesis.1)2)4)5) The invasive, and hence more hazardous, time-consuming and expensive nature of direct pressure measurements makes this method of diagnosis unattractive. Echocardiography is an inexpensive, non-invasive, rapid and reliable imaging modality for diagnosing pericardial effusion, tamponade and pericardial constriction. However, hitherto its role in the diagnosis of ECP has never been systematically studied or compared with direct, pressure-guided measurements.7)8) The objective of this study was therefore to compare echocardiography with traditional, invasive pressure recordings for the diagnosis of ECP.
Methods
Patient population
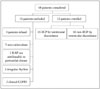
Patients were prospectively enrolled after approval for the study had been obtained from the Health Research Ethics Committee of Stellenbosch University. The patient allocation is summarized in Fig. 1.
Inclusion criteria
Males and females (≥ 18 years), having a suspected tuberculous pericardial effusion, confirmed on echocardiography within 24 hours of referral to the Cardiology Service of Tygerberg Academic Hospital from 15 May 2013 to 31 December 2014, with a pericardial effusion of ≥ 10 mm in size and amenable to percutaneous pericardiocentesis, willing to give written, informed consent to participate in the study, and finally diagnosed with tuberculous pericardial disease (as defined below).
Exclusion criteria
Any patient refusing to participate in the study, evidence that elevated right atrial pressure (RAP) could not be attributed exclusively to pericardial effusion, tamponade and/or constriction pre-pericardiocentesis, or to a constrictive effect post-pericardiocentesis (e.g., established pulmonary hypertension), an irregular ventricular rhythm complicating the interpretation of mitral inflow velocity variation (one of the pre-eminent echocardiographic signs of constrictive physiology),9) clinical evidence of chronic obstructive pulmonary disease, which can cause significant variation in transmitral flow, and therefore a false-positive echocardiographic diagnosis of constriction,10) and lateral or septal early diastolic, mitral annular velocity of < 8 cm/s on pulsed tissue Doppler.11)
Pericardiocentesis and cardiac catheterization
All pericardiocenteses were performed via standard subxiphoid or apical access techniques in the cardiac catheterization laboratory. Lignocaine was subcutaneously infiltrated with a 22-gauge needle, and the skin punctured with an 18-gauge needle to enter the pericardial space. A guidewire (0.97 mm) was inserted into the pericardial space via the needle, and its position confirmed fluoroscopically. The needle was removed, and a 6F sheath advanced over the guidewire. The latter was subsequently removed, and the sheath connected to a three-way stopcock and a 50 mL syringe. Aspiration of pericardial fluid was performed directly, firstly via the sheath, and thereafter via a pigtail catheter inserted into the pericardial space through the sheath. Intrapericardial pressure (IPP) was measured pre- and post-pericardiocentesis via the pigtail catheter located in the pericardial space. RAP was measured before and after removal of pericardial fluid, with a pigtail catheter inserted into the right atrium via a right- or left-sided 6F femoral venous sheath. Right ventricular pressure (RVP) was recorded post-pericardiocentesis by advancing the pigtail catheter used for measuring the RAP into the right ventricle. Left ventricular pressure (LVP) was determined post-pericardiocentesis by means of a pigtail catheter inserted via a right-sided 5F radial arterial sheath, or via a right- or left-sided 6F femoral arterial sheath in the case of radial access not being obtained.
Echocardiograpic data acquisition
Prior to and immediately after pericardiocentesis, transthoracic echocardiography was performed in all patients using a commercially available echocardiographic system (Vivid E9 or Vivid S5, General Electric Vingmed Ultrasound, Milwaukee, WI, USA). Images were obtained by means of 1.5–3.6 MHz or 1.5–4.6 MHz transducers, adjusting depth and gain settings. M-mode, two-dimensional and Doppler data (with ECG) were acquired and digitally stored for off-line analysis (EchoPac 113, General Electric Vingmed Ultrasound).
Diagnostic criteria for tuberculosis
The diagnosis of a tuberculous effusion of the pericardium was based on: 1) acid-fast bacilli found on microscopy of pericardial fluid or tissue, or fluid or tissue from another site (in patients presenting with a large pericardial effusion, clinically suspected to be tuberculous); 2) Mycobacterium tuberculosis cultured from pericardial fluid or tissue, or fluid or tissue from another site (in patients presenting with a large pericardial effusion, clinically suspected to be tuberculous); 3) caseating granulomas identified on biopsy of pericardium or tissue from another site (in patients presenting with a large pericardial effusion, clinically suspected to be tuberculous); and 4) a pericardial effusion within the context of a typical clinical picture of tuberculosis together with supportive biochemistry, i.e., pericardial fluid adenosine-deaminase (ADA) > 40 U/L and/or interferon-γ (INF-γ) > 50 pg/mL.12)
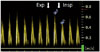
Echocardiographic diagnostic criteria for ECP
Constrictive physiology was diagnosed echocardiographically with either: 1) ≥ 25% respiratory variation of the peak E-wave velocity as determined by pulsed-wave Doppler (Fig. 2) at the level of the mitral leaflet tips in an apical four-chamber view; or 2) a clear, visually determined respiratorophasic shift of the interventricular septum towards the left ventricular cavity during inspiration in an apical four-chamber view.
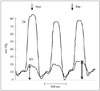
Invasive diagnostic criteria for ECP
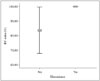
ECP was diagnosed invasively if there was failure of the RAP to decrease by ≥ 50% or to < 10 mm Hg after IPP was lowered to ≤ 1 mm Hg by pericardiocentesis.4) ECP was confirmed by the presence of systolic discordance in the simultaneous, post-pericardiocentesis pressure traces. Discordance was considered present if there was a reciprocal change in the peak systolic RVP and LVP at maximum inspiration, as determined by a right ventricular index of 100%.13) Maximum inspiration was defined as the first ejection phase after the diastolic phase with the lowest, early LVP (Fig. 3).13) The right ventricular index was defined as the percentage of maximum right ventricular systolic pressure attained during maximum inspiration (Fig. 4).13)
Statistical analysis
Continuous variables are presented as means and standard deviations (SDs) when normally distributed. Dichotomous data are presented as numbers and percentages. Independent t-tests were used to compare continuous variables. Sensitivity and specificity and their 95% confidence intervals (CIs) were calculated using EpiCalc 2000 for Microsoft Windows (Microsoft Corp., Redmond, WA, USA). Chi-square tests or Fisher's exact tests, where appropriate, were used to compare two independent proportions, while McNemar's test was used for paired, binary proportions, i.e., to compare the sensitivities and specificities of the different diagnostic tests. Data were analyzed by the Biostatistics Unit of the Centre for Evidence-Based Health Care, Stellenbosch University, using SPSS version 22 (IBM Corp., Armonk, NY, USA) software. All statistical tests were two-sided. A p-value < 0.05 was considered statistically significant.
Results
Thirty-two subjects with tuberculous pericardial disease were enrolled (mean age 38 ± 11 SD years; range 20–61 years). Baseline characteristics are summarized in Table 1. Ten (31%) were female (mean age 33 ± 11 SD years; range 20–55 years) and 22 (69%) were male (mean age 41 ± 10 SD years; range 21–61 years).
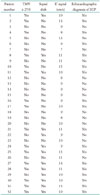
The median ADA was 67.3 U/L (interquartile range 53.7–107.4 U/L) and the median INF-γ was 3201.0 pg/mL (interquartile range 2081.5–4008.5 pg/mL). The pericardial fluid of 11 patients was culture-positive, the pericardial fluid of 3 was microscopy-positive, and the sputum of 2 was culture- or microscopy-positive (Table 2). Twenty patients were HIV-positive (2 elected not to be tested).
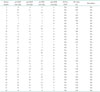
Hemodynamic and echocardiographic characteristics of individual patients are summarized in Table 3 and 4, respectively. Sixteen patients demonstrated ventricular discordance (invasively measured, with a right ventricular index of 100%) (Fig. 4), 16 had ECP diagnosed by invasive pressure measurements in the pericardium and right atrium, and 17 had ECP diagnosed by echocardiography. The mean right ventricular index for the patients without ECP was 83.7% (± 7.9 SD, range 70–95%). The difference between those with ECP (right ventricular index of 100%) and those without (right ventricular index < 100%) was statistically significant (p < 0.001). The mean RAP pre-pericardiocentesis was 14.5 mm Hg (± 6.3 SD, range 3–29 mm Hg), the mean IPP pre-pericardiocentesis was 7.75 mm Hg (± 5.16 SD, range 0–19 mm Hg), the mean RAP post-pericardiocentesis was 10.7 mm Hg (± 5.9 SD, range 0–27 mm Hg) and the mean IPP post-pericardiocentesis was 1.56 mm Hg (± 2.27 SD, range 0–7 mm Hg). The mean RAP pre-pericardiocentesis in those with ECP was 16.19 mm Hg (± 5.91 SD, range 7–29 mm Hg) and the mean RAP pre-pericardiocentesis in those without ECP was 12.8 mm Hg (± 6.34 SD, range 3–25 mm Hg) (p = 0.130).
The sensitivity of pressure-guided measurements, compared with discordance, for the diagnosis of ECP was 56% (95% CI, 31–79%), and the specificity 56% (95% CI, 31–79%). The positive and negative predictive values were both 56% (95% CI, 31–79%).
The sensitivity of echocardiography, compared with discordance, for the diagnosis of ECP was 81% (95% CI, 54–95%) and the specificity 75% (95% CI, 50–92%). The positive predictive value was 76% (95% CI, 50–92%), while the negative predictive value was 80% (95% CI, 51–95%). Statistical significance could not be shown for the difference between sensitivity and specificity of pressure-guided and echocardiographic methods for diagnosing ECP when compared with discordance (McNemar's test, p = 0.344 and 0.453, respectively).
Discussion
This study provides evidence that echocardiography is superior to the hitherto-used RAP/pericardial pressure correlation methodology for the diagnosis of ECP. Even though echocardiography has been applied for diagnosing ECP,8) the fact that it has never been systematically studied8) or compared to either invasive measurements or a gold standard, has made its use in this context anecdotal, with uncertainty about its sensitivity and specificity for establishing the diagnosis of ECP. Furthermore, echocardiography is more widely available, safer, faster and inexpensive compared with invasive measurements, and therefore far more practical for everyday clinical use. This is particularly relevant in many countries and rural areas where tuberculous pericardial disease is prevalent and catheterization laboratories with appropriate invasive pressure-measuring facilities are not available.
Compared with the published series, in which 36, 23, 13, and 15 patients with ECP were included, the current study (16 patients), is the third largest to date.2)3)4) The prevalence of a tuberculous etiology of ECP was higher (67%) in our cohort of patients than in any of the previously published studies. In the series published by Ntsekhe et al.,5) the prevalence of tuberculosis was 60%, while only one case of tuberculosis was identified by Sagristà-Sauleda et al.4) (no data are provided on the prevalence in the larger cohort of patients who underwent pericardiocentesis), and none was identified in the articles by Cameron et al.3) or Hancock.2) This clearly reflects the high prevalence of tuberculosis in the geographical area where the current study was conducted.14) In our study, the prevalence of ECP in patients with tuberculous pericardial effusions was 50%. This closely resembles the 52.9% reported in the study by Ntsekhe et al.,5) where hemodynamic and biochemical characteristics of tuberculous ECP were described in 36 patients. Patients with ECP were generally younger, and their pre-pericardiocentesis RAPs were higher than those without ECP.5) In the original series published by Hancock,2) the RAP was also found to be higher in patients with ECP, while the RAP per se was not compared between those with and without ECP in the remaining two series by Cameron et al.3) and Sagristà-Sauleda et al.4) In the current study we found no differences, either in age or the pre-pericardiocentesis RAP values between patients with and without ECP. Absolute values are obtained by direct hydrostatic pressure measurements in the pericardial space and the right atrium as opposed to the relative values obtained by systolic discordance recordings. Consequently, direct hydrostatic pressure measurements can be affected by a wide range of variables, e.g., ventricular volume, hydration status, ventricular and atrial compliance, hydrostatic level of the catheter tip, and pleural pressures.15)16) Absolute RAP determinations are therefore subject to multiple influences besides those arising from constrictive physiological origin, and they are therefore likely not reliable indicators of the presence of ECP.
Limitations of the study
This was a single-centre study, with only a single etiological cause of ECP included. However, since ECP is a pathophysiological phenomenon, not limited to a specific disease entity, the results are likely to be applicable to ECP resulting from other etiologies as well. Although two-dimensional image quality is often suboptimal in constrictive pericarditis, the required echocardiographic measurements were successfully obtained in all study subjects (n = 32).17) While systolic discordance is best defined objectively using the systolic area index,18) the hemodynamic analysis software in our catheterization laboratory did not support digital area-under-the-curve measurements and also did not allow data exportation for integration of the area under the curve. Hence, discordance was quantified by calculation of the right ventricular index.13) In the original description of systolic discordance, micromanometers were used to measure intraventricular pressures.13) Although micromanometric determination of discordance has never been directly compared with hydrostatic measurements with fluid-filled catheters (used in this study due to cost factors), it is assumed to be comparable.13)
Conclusions and Future Perspective
ECP is a common manifestation of tuberculous pericardial disease, and has traditionally been diagnosed by invasive pressure measurements. The current study strongly supports the use of echocardiography for the diagnosis of ECP. It is more accurate than the pressure-based method when compared with the gold standard of constrictive physiology, i.e., invasive systolic discordance. Moreover, echocardiography is safer, faster, cheaper, and more readily available than facilities and expertise for performing invasive measurements. As measurement of IPP and RAP is not routinely performed as part of pericardiocentesis in many hospitals, echocardiographic diagnosis of ECP has the potential to increase the detection of this condition.1) Furthermore, echocardiographic ECP diagnosis would simplify research, e.g., on whether or not ECP should be treated with systemic or intrapericardial steroids.
As the current study was underpowered to detect a difference in the accuracy of echocardiography and pressure-guided diagnosis of ECP, the results should be confirmed in a larger cohort of patients to further define the role of this non-invasive technique.


 XML Download