

 PDF
PDF ePub
ePub Citation
 Print
Print


Introduction
Echocardiography is the single most important imaging modality and provides comprehensive information about cardiac structures and hemodynamic parameters.1) Markers of left ventricular (LV) systolic function can be used as good prognostic parameters in many cardiovascular diseases.2) However, the accurate and reproducible measurement of LV systolic function remains a difficult goal to achieve. Although LV ejection fraction (LVEF) is a widely available echocardiographic marker of LV systolic function, this measurement has some limitations.3)4) For instance, LVEF is a volumetric parameter that can be affected by cardiac loading condition and heart rate, and it demands good visualization of the endocardial borders.5) Moreover, LVEF provides little information regarding regional function or intrinsic myocardial function.
Two-dimensional (2D) speckle tracking echocardiography (STE) can measure myocardial mechanics by tracking tiny echo-dense speckles and measurement of LV deformation.6)7) The strain measurement calculated by STE represents the magnitude of myocardial deformation; this measurement can objectively assess both global and regional myocardial function.
Importantly, these strain values can detect subclinical diseases prior to the development of overt clinical features8) and can also provide additional prognostic information in many cardiovascular diseases.9)10)11)12) Since the clinical application of strain values requires the definition of a normal range, it is important to define this range using a normal population with standardized echocardiographic methods. We performed a nationwide multicenter trial for the measurement of normal echocardiographic values in the Korea population. This trial was supported by the Korean Society of Echocardiography and was called the Normal echOcardiogRaphic Measurements in KoreAn popuLation (NORMAL) study.13)14) In this substudy, we aimed to define the normal values of LV strain.
Methods
Study population
The NORMAL study was a prospective multicenter study performed from January 2011 to March 2014 to establish normal echocardiography reference values in a Korean population.13) A total of 23 tertiary teaching hospitals participated in this study. Normal Korean adult subjects were evaluated using comprehensive echocardiography. We prospectively included normal adult subjects (aged 20–79 years old) who did not have any significant cardiac disorders or clinical illnesses that might affect cardiac structure and function, such as hypertension and diabetes. We excluded subjects with an evident structural or functional abnormality on the cardiac valve or cardiac chamber during echocardiographic examination. All study participants agreed to provide their information for research purposes. If the subject refused to participate in this study, the person was excluded. The requirement for written informed consent was waived. The study protocol was approved by the Institutional Review Boards of all included institutes.
Standard conventional echocardiography
Echocardiographic images were acquired and measured at each institute according to a standard method outlined by the American Society of Echocardiography.15) All conventional echocardiographic parameters were measured and averaged from 3 cardiac cycles. Briefly, M-mode echocardiography was performed on parasternal views. LV end-diastolic dimension (LVEDD), interventricular septal wall thickness (IVST), and LV posterior wall thickness (LVPWT) values were measured at end-diastole. The LV end-systolic dimension (LVESD) and left atrial anteroposterior dimension values were measured at endsystole. LVEDD and LVESD were indexed to body surface area (BSA). The LV mass (LVM) was calculated using a linear method using both measurement values from M-mode and 2D images, as follows: LVM (gm) = 0.8 × {1.04 × [(IVST + LVEDD + LVPWT)3 − LVEDD3]} + 0.6 (gm). LVM was also indexed to BSA. LV end-diastolic volume (LVEDV) and LV end-systolic volume (LVESV) values were measured and indexed to BSA. LVEF was measured using the biplane Simpson's method on apical 4-chamber (A4C) and 2-chamber (A2C) views.
Echocardiographic images were stored in DICOM format and electronically transferred to the Echocardiographic Core Laboratory (ECL) at Samsung Medical Center. Trained ECL staff reviewed and reanalyzed all echocardiographic images with commercially available software (EchoPAC PC software, GE Medical Systems, Horten, Norway).
Two-dimensional strain echocardiography
We analyzed longitudinal strain values from 2D echocardiographic images of A4C, apical 3-chamber (A3C), and A2C views in the Strain Core Lab at Chungnam National University Hospital and all 2D strain was analyzed by one researcher (PJH). We only analyzed values from images acquired with GE Medical Systems echocardiographic machines. For the offline analysis, we used images that were digitally stored in cineloop format at approximately 60 frames/sec. Strain and strain rate values were measured using offline software (EchoPAC PC 13.0.0, GE Medical Systems). After selecting the best digital 2D echocardiographic image of the stored cardiac cycles, the LV endocardial border was manually traced at the end-systolic frame. After this tracing, a speckle-tracking region of interest was automatically selected to approximate the myocardium between the endocardium and epicardium. The width of the region of interest was adjusted as necessary to accommodate the total thickness of the LV wall, while excluding blood and pericardial tissue. The software automatically tracked stable echo-dense speckles in each frame using the sum of absolute differences algorithm. Each LV wall was divided into 3 segments (apical, mid, and basal), and the tracing quality of each myocardial segment was evaluated. If the segment exhibited poor tracing quality, the endocardial border or the region of interest was readjusted to obtain good tracing results; alternatively, different echocardiographic images were used. Strain analysis was feasible in 99% of all analyzed segments. Myocardial velocity was derived as the ratio between frame-to-frame displacement in all apical views. Longitudinal peak systolic strain (LS) and longitudinal peak systolic strain rate (LSR) values were calculated from an average value of 6 segments, whereas LV global LS (LVGLS) and LV global LSR (LVGLSR) values were measured from an average of 3 apical view global values. Since the Lagrangian strain measurement expresses deformation relative to the initial length, systolic shortening in the longitudinal orientation is expressed as a negative value. Lower LVGLS and LVGLSR values indicate better LV systolic function.
Statistical analysis
Data are expressed as mean ± standard deviation, and 95% confidence intervals (CIs) for each parameter are provided for continuous variables. The independent t-test was used to compare mean values between males and females, and a one-way analysis of variance test was performed to evaluate whether mean values differed according to age. The gender difference of LVGLS with adjustment of other variables was calculated with analysis of covariance (ANCOVA). Pearson's method was used to evaluate significant correlations among clinical and measurement variables. Intraobserver and interobserver variabilities were analyzed from 20 randomly selected cases, and intraclass correlation coefficients (ICCs) were calculated. Also, mean of two measurements and limit of agreement were calculated with Bland-Altman plot. One researcher repeated measurements at least 2 weeks after the first measurements for the assessment of intraobserver variability testing, and another researcher who was blinded to the first measurement value performed the same measurements for the assessment of interobserver variability. p values < 0.05 were considered statistically significant. All statistical analyses were performed using SPSS Statistics version 22 (SPSS Inc., Chicago, IL, USA) or MedCalc (version 12.3.0.0, MedCalc Software, Mariakerke, Belgium).
Results
Clinical characteristics of the study patients
Initially, a total of 1003 normal subjects from 23 centers were evaluated in the current study. After exclusion of 315 echocardiographic images done with other echocardiographic machines and 183 echocardiographic images with different DICOM format unable to calculate strain, we initially tried to analyze 2D strain values from 505 of these subjects. However, 4 of the images were unable to measure speckle tracking strain value, total 501 patients were included in this analysis. Strain measurement was available in 99.2% of stored echocardiographic images. Patient demographic and clinical data are provided in Table 1 according to sex. The mean age was 47 ± 15 years (20–78). Physical parameters of weight, height, and BSA were significantly lower in females than in males (p < 0.001 for all variables). However, the blood pressure values in males were higher than in females. Heart rate was not significantly different between males and females.
Conventional echocardiographic data
Conventional echocardiographic variables are presented in Table 1 according to sex. Also, clinical characteristics and conventional echocardiographic values are presented in Supplementary Table 1 according to age group. Significant differences in conventional echocardiographic variables were observed between males and females. Specifically, the LVEDD, LVESD, IVST, LVPWT, LVEDV, LVESV, and LVM values were greater in males than in females. However, the LVEF values of the two groups were not significantly different.
Two-dimensional strain echocardiographic data
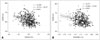
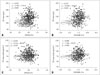
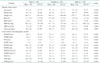
The LV 2D longitudinal strain values are listed in Table 2. Specifically, the LVGLS was −20.4 ± 2.2% (95% CI = −25.4−−16.7%), the LVGLSR was −1.21 ± 0.21−S (95% CI = −1.59−−0.92−S), the peak early diastolic strain rate (E) was 1.55 ± 0.39−S (95% CI = 0.94−2.36−S), and the peak late diastolic strain rate (A) was 0.84 ± 0.29−S (95% CI = 0.39−1.47−S). The LVGLS and LVGLSR values showed significant correlations with the LVEF value (both p < 0.001) (Fig. 1). These systolic parameters also demonstrated significant correlations with LVM. However, the correlations with indexed LVM were not significant (Fig. 2).
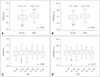
The 2D STE variables are presented in Table 2 according to sex. Females had significantly lower peak systolic strain (better systolic function) and systolic strain rate values compared to those of males (Fig. 3A and B). After ANCOVA analysis, female has better LVGLS (p < 0.001) and LVGLSR (p < 0.001) after adjustment of systolic blood pressure (SBP), LVM, and body mass index (BMI). Also, the peak early diastolic strain rate was higher in females. However, the peak late diastolic strain rates of males and females were similar.
The STE values are presented in Supplementary Table 2 according to age group. No significant differences were observed among any of the age groups (Fig. 3C and D). However, younger females (< 40 years old) had better LVGLS (−21.8 ± 2.4% vs. −20.8 ± 2.1%, p < 0.001) and LVGLSR (−1.3 ± 0.2 vs. −1.2 ± 0.2, p = 0.03) values than older females (> 60 years old). No significant differences were observed between younger males and older males.
Intraobserver and interobserver variability
The ICCs for intraobserver, inter-observer, mean of two measurements and limit of agreement by Bland-Altman plot are listed in Table 3. The intraobserver and inter-observer ICCs for LVGLS-total were 0.972 and 0.924, respectively; similarly, the intraobserver and inter-observer ICCs for LVGLSR-total were 0.956 and 0.879, respectively.
Discussion
In this study, we identified normal reference values of LV longitudinal strain and strain rate using data from the NORMAL study, which prospectively evaluated normal Korean patients from 23 centers nationwide. Females showed more negative (better) peak systolic strain and strain rate values than males. However, no significant differences were observed among different age groups.
‘Myocardial strain’ is a term used to describe local shortening, thickening, and lengthening of the myocardium. Myocardial strain is also considered to be a marker of regional LV function. This strain can be measured on three cardiac axes: longitudinal, radial, and circumferential.16) A negative strain value indicates tissue shortening, whereas a smaller value (that is, a higher absolute value) indicates better ventricular systolic function. Strain can be measured by tissue Doppler imaging (TDI) or by STE. Although TDI can be used to calculate natural myocardial strain, this technique has a number of limitations including angle-dependency, influence of region of interest, and lack of information of global systolic function.17) Currently, STE is the most widely used modality for measuring strain. Importantly, this technique can objectively measure myocardial strain, independent of the angle. Strain rate can be also calculated by STE; these values show good correlation with ventricular contractility.18)19) Many echocardiographic laboratories measure LV strain in the longitudinal direction and use GLS, which is calculated as the average of all apical view segments, as a marker of global LV systolic function.16) Moreover, LVGLS and LVGLSR show significant correlations with pressure-volume loop-derived contractility indices.20)
In our study, we found that the LV longitudinal strain of the A4C view, the A3C view, the A2C view, and the LVGLS were −20.1 ± 2.3, −19.9 ± 2.7, −21.2 ± 2.6, and −20.4 ± 2.2%, respectively. These values are similar to the results of previous studies.21)22)23)24) In a meta-analysis including 2597 subjects from 24 studies, the normal 2D LVGLS value was found to range from −15.9 to −22.1%, with the mean value of −19.7%.21) Kocabay et al.23) reported a normal LVGLS of −21.5 ± 2.0%, calculated from 247 normal Italian subjects. In the Japanese ultrasound speckle tracking of the left ventricle (JUSTICE) study,22) the GLS as assessed by GE machines was −21.3 ± 2.1%; notably, this value was different from the GLS values calculated when using other machines. Saito et al.24) compared 2D strain and 3D strain values from 46 Japanese volunteers and found that the normal 2D LVGLS was −19.9 ± 6.7%. Since LVGLS can be affected by SBP, machine manufacturer, and BMI,19)21)22) we included only subjects with echocardiographic images obtained on GE machines. Moreover, we included normal subjects without hypertension and obesity (mean SBP and BMI were 120 ± 12 mm Hg and 23 ± 3, respectively). We also identified the normal LVLSR range. Specifically, the LVLSR values of the A4C view, the A3C view, the A2C view, and the LVGLSR were −1.18 ± 0.18, −1.20 ± 0.21, −1.25 ± 0.21, and −1.21 ± 0.21−S, respectively. Our calculated mean LVGLSR is similar to those of previous studies with healthy subjects.25)26)
Females had lower (better) LVGLS (−21.2 ± 2.2% vs. −19.5 ± 1.9%, p < 0.001) and LVGLSR (−1.25 ± 0.18−S vs. −1.17 ± 0.15−S, p < 0.001) values than males. This finding is similar to those of a previous study based on strain echocardiography26) and a previous study based on cardiac magnetic resonance.27) We hypothesize that this difference might be a consequence of the different LVM values between the two sexes. Specifically, because males have higher LVM values than females, the LVGLS and LVGLSR values might be lower in females.
We did not identify any significant differences between different age groups. However, LVGLS was higher in younger females (< 40 years old) than in older females (> 60 years old, p < 0.001). Moreover, younger females showed significantly lower LVGLS (−21.8 ± 2.4 vs. −19.2 ± 1.7, p < 0.001) and LVGLSR (−1.30 ± 0.19 vs. −1.16 ± 0.15, p < 0.001) values than younger males. However, no significant differences for LVGLS (−20.8 ± 2.1 vs. −20.1 ± 2.3, p = 0.113) or LVGLSR (−1.22 ± 0.17 vs. −1.19 ± 0.13, p = 0.334) were observed with respect to sex in the older group. In females, the younger group showed lower LVM values than the older group (100.1 ± 19.2 vs. 124.2 ± 23.1, p < 0.001). However, no significant differences were observed in males (136.5 ± 25.8 vs. 142.3 ± 26.6, p = 0.198).
We also identified significant correlations between LVGLS, LVGLSR, and LVM. Because we included normal subjects, these correlations were not strong. These findings are consistent with a cardiac magnetic resonance imaging based study.28) In a previous report of patients with severe aortic stenosis (AS), patients with AS showed markedly decreased GLS prior to aortic valve replacement (AVR), while GLS improved significantly after AVR with decrease of LVM.
Limitations
Several limitations of this study should be acknowledged. First, we included only normal Korean subjects in the NORMAL study; therefore, our results might not be generalizable to other populations. However, this study provides useful LVGLS and LVGLSR reference values and also had much strength, such as the relatively good imaging quality and the fact that it was a prospective study with a reasonably large number of participants. Second, our study included only data acquired with GE echocardiographic machines. Since machines made by different manufacturers could lead to different results, other strain algorithms need to be used to calculate LVGLS and LVGLSR in order to overcome this limitation. Third, patients with significant disease, such as hypertension or diabetes, were excluded based only on past medical histories obtained from the study subjects, while bloodwork and/or other clinical tests were not obtained. Therefore, patients with preclinical hypertension or subclinical coronary artery disease might have been included in the current study. However, the effects of these conditions on heart structure are unlikely to be significant.


 XML Download