

 PDF
PDF ePub
ePub Citation
 Print
Print


INTRODUCTION
Mitochondrial voltage-dependent anion channel-1 (VDAC1) is one of the major components of the outer mitochondrial membrane and plasma membrane, which allows diffusion of small molecules, such as adenosine triphosphate, phosphocreatine, and calcium [12]. In addition to playing the role as a class of porin ion channel located on the mitochondrial outer membrane, VDAC1 is thought to be involved in the formation of the mitochondrial permeability transition pore complex and thus facilitate cytochrome C release, triggering apoptosis [34]. Several human diseases, such as neurodegenerative diseases [5] and cancers [67] have been associated with VDAC1 due to its role in calcium ion transportation and apoptosis, respectively. A recent study suggests that VDAC may interact with endothelium-dependent nitric oxide synthase (eNOS) [8], which is primarily responsible for the generation of nitric oxide in the vascular endothelial cells [9]. Nitric oxide generated by eNOS in the vascular endothelial cells plays an essential role in regulating vascular tone and cellular proliferation [10]. Decreased VDAC1 expression may limit the physical interaction between VDAC1 and eNOS and thus impair nitric oxide production, leading to several cardiovascular diseases, including pulmonary arterial hypertension (PAH). However, little is known about the exact contribution of VDAC1 in the pathobiology of PAH. According to the current classification, pulmonary hypertension (PH) has been classified into five categories based on etiology. Among them, group 1 or PAH is a rare but progressive disease caused by functional and structural changes in the pulmonary vasculature, which leads to increased pulmonary vascular resistance (PVR). Regardless of the initial pathogenic trigger, the major causes of elevated PVR in patients with PAH are chronic pulmonary vasoconstriction, pulmonary vascular remodeling, in situ thrombosis and increased pulmonary vascular wall stiffness. Pulmonary arterial endothelial cell (PAEC) dysfunction and injury are believed to play a critical role in the pathogenesis of PAH and trigger pulmonary arterial smooth muscle cell (PASMC) proliferation and migration leading to pulmonary vascular remodeling. Fibroblasts, essential to the vascular extracellular matrix, are thought to be the first vascular cell line to respond to harmful stimuli leading the development of pulmonary hypertension [11]. Mitochondria act as oxygen sensors and stabilize hypoxia-inducible factors (HIFs) by generation of reactive oxygen species (ROS) at mitochondrial complex III under hypoxia, resulting in pulmonary vascular remodeling and the development of pulmonary hypertension [12]. Despite significant progress in research and the expanding treatment options to ameliorate patients' symptoms, PAH remains a devastating disease with a poor long-term prognosis and the exact pathogenic mechanisms of PAH are still poorly understood.
In this report, we conducted a transcriptomic analysis to identify VDAC1 influenced genes in mouse embryonic fibroblasts that may be implicated in PH pathobiology. These cells were isolated prior to embryonic lethality caused by global Vdac1 knockout, such lethality potentially pointing to the importance of this gene during vascular development. First, we identified differentially expressed genes utilizing microarray data from wild-type (WT) and Vdac1 knockout (KO) mouse embryonic fibroblasts (MEFs) in hypoxic conditions. The genes differentially expressed between WT and Vdac1 KO MEFs were deemed VDAC1 influenced genes. Gene ontology analysis indicates that the VDAC1 influenced genes are significantly associated with PH pathobiology. Second, a molecular signature derived from the VDAC1 influenced genes was developed. We suggest that this gene expression signature can be used to i) predict severity of PH secondary to pulmonary diseases, ii) differentiate idiopathic pulmonary artery hypertension (IPAH) patients from controls, and iii) differentiate IPAH from connective tissue disease associated PAH.
METHODS
Gene expression data
The microarray data of WT and Vdac1 KO MEFs were downloaded from the Gene Expression Omnibus (GEO) database (GEO accession: GSE63247) [13]. We used this dataset to filter out the VDAC1 influenced mouse genes. The gene expression datasets of human subjects were also obtained from the GEO database: GSE15197 for the discovery cohort, GSE24988 for the Toronto cohort, and GSE48149 for the Pittsburgh cohort. All these datasets were chosen based on the availability of annotated patient classification.
Statistical analysis
Significance Analysis of Microarrays (SAM) [14], implemented in the samr library of the R Statistical Package [15], was used to identify the differentially expressed genes in two-class unpaired comparison. False discovery rate (FDR) was controlled using the q-value method [16]. We searched for any enriched Gene Ontology (GO) [17] terms among the differentially expressed genes. Fisher's exact test was used to identify the enriched GO terms.
Classification scores
In order to evaluate the discriminative power of our proposed molecular signature, three different classification scores (S1, S2, and S3) were computed for each human subject based on the expression of the VDAC1 influenced genes (see Results). S1 is a linear combination of gene expression values weighted by the direction of differential expression between control and secondary PH (Equation 1). S2 is a linear combination of gene expression values weighted by the direction of differential expression between control and IPAH (Equation 2). Similarly, S3 is a linear combination of gene expression values weighted by the direction of differential expression between secondary PH and IPAH (Equation 3). All these scores can be used for patient classification. The formulas are shown below [1819]:
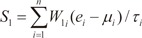
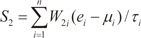
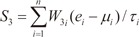
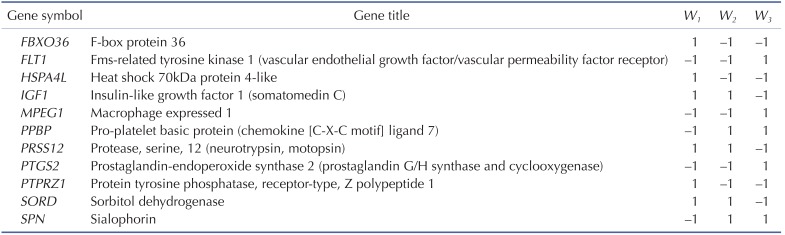
Here, n is the number of genes in the VIP signature; W1i, W2i, and W3i denote the weight of gene i for calculating S1, S2, and S3, respectively (as shown in Table 1), which indicate the direction of deregulation for gene i (1 or -1); ei denotes the expression level of gene i; and µi and τi are the mean and standard deviation of the gene expression values for gene i across all samples, respectively.
RESULTS
Mouse genes influenced by VDAC1
To infer the genes potentially regulated by VDAC1 in pulmonary hypertension, we first investigated the difference in gene expression profile between WT and Vdac1 KO mouse MEFs in hypoxic condition. We obtained one microarray dataset containing gene expression information for both WT and Vdac1 KO MEFs incubated in hypoxic conditions from the GEO database (GEO accession: GSE63247) [13]. At the specified significance level of FDR<0.1% and fold change (FC)>3 (see Methods for details), 736 genes were found to be upregulated in Vdac1 KO MEFs (Supplementary Table S1) while 585 genes were downregulated in Vdac1 KO MEFs (Supplementary Table S2). We considered these dysregulated genes as VDAC1 influenced mouse genes in hypoxic condition. We next searched the enriched GO terms [17] among the VDAC1 influenced genes. We found that the VDAC1 influenced genes are significantly associated with cell cycle, vascular development, and hypoxia related terms, such as “cell cycle process”, “cell division”, “blood vessel morphogenesis”, “blood vessel development”, “response to hypoxia”, and “oxidation reduction” (Supplementary Fig. S1).
VDAC1 influenced gene signature
We matched the VDAC1 influenced mouse genes to distinct human orthologs, which yielded 1,184 VDAC1 influenced human genes. To determine how deep the VDAC1 influenced genes are involved in PH, we explored the genes that are differentially expressed in PH human patients. We obtained one microarray dataset of human subjects from the GEO database (GEO accession: GSE15197) [20]. This dataset contains the whole-genome gene expression data from lung tissue of 13 healthy controls, 8 patients with idiopathic pulmonary fibrosis (IPF) induced secondary PH, and 18 patients with IPAH (discovery cohort).
Firstly, we investigated the genes differentially expressed between healthy controls and patients with secondary PH. In total, 846 upregulated and 409 downregulated genes in secondary PH (FDR<5% and FC>2) were identified. Among these dysregulated genes in secondary PH, 124 genes were found to overlap with the VDAC1 influenced human genes, which is statistically significant (cumulative hypergeometric test: p=9.7×10⁻⁶). Secondly, we looked into the genes differentially expressed between healthy controls and patients with IPAH. We found 1,269 upregulated and 1,101 downregulated genes in IPAH (FDR<5% and FC>2). Among the dysregulated genes in IPAH, 168 genes were found to overlap with the VDAC1 influenced human genes (cumulative hypergeometric test: p=2.9×10⁻¹). Finally, we compared the gene expression pattern between patients with secondary PH and IPAH. Compared with secondary PH, there were 1,269 upregulated and 1,101 downregulated genes in IPAH (FDR<5% and FC>2). Among these genes, 224 genes were found to overlap with the VDAC1 influenced human genes, which is statistically significant (cumulative hypergeometric test: p=4.0×10⁻⁵). All these results suggest that the VDAC1 influenced genes are actively involved in PH pathogenesis.
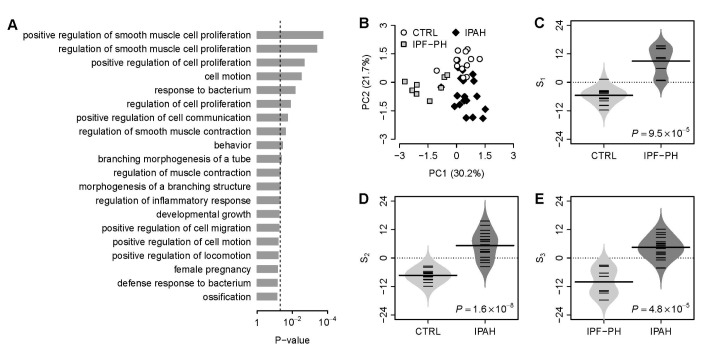
We focused on the intersection of dysregulated VDAC1 influenced genes from the above three comparisons (control vs. secondary PH, control vs. IPAH, and secondary PH vs. IPAH). In total, there were 11 VDAC1 influenced genes within the intersection. We designated these 11 genes as VDAC1 influenced PH (VIP) signature (Table 1). Gene ontology analysis demonstrates that the VIP genes are significantly associated with numerous GO terms in PH physiology, such as “smooth muscle cell proliferation”, “regulation of smooth muscle contraction”, and “morphogenesis of a branching structure” (Fig. 1A). Principal component analysis on the VIP gene expression indicates that, for one given subject group in the discovery cohort, the VIP signature significantly differentiates this group from the other two (Fig. 1B). In order to systematically evaluate the classification power of VIP, three different classification scores (S1, S2, and S3) were assigned to each subject based on the VIP gene expression (see Methods for details). S1 is a linear combination of VIP gene expression values weighted by the direction of differential expression between control and secondary PH (W1 in Table 1). Compared with control, higher S1 implies higher likelihood of secondary PH. S2 is a linear combination of VIP gene expression values weighted by the direction of differential expression between control and IPAH (W2 in Table 1). Higher S2 suggests higher likelihood of IPAH compared with control. Similarly, S3 is a linear combination of VIP gene expression values weighted by the direction of differential expression between secondary PH and IPAH (W3 in Table 1). Compared with secondary PH, higher S3 denotes higher likelihood of IPAH. All these scores can be used for patient classification. In the discovery cohort, it's not surprising that S1 significantly distinguishes between control and secondary PH (Fig. 1C), S2 significantly distinguishes between control and IPAH (Fig. 1D), and S3 significantly distinguishes between secondary PH and IPAH (Fig. 1E). The areas under the receiver operating characteristic (ROC) curve (AUC) were 0.981, 0.992, and 0.986 for S1 (control vs. secondary PH), S2 (control vs. IPAH), and S3 (secondary PH vs. IPAH), respectively (Supplementary Fig. S2).
VIP based S1 predicts severity of secondary PH in a validation cohort
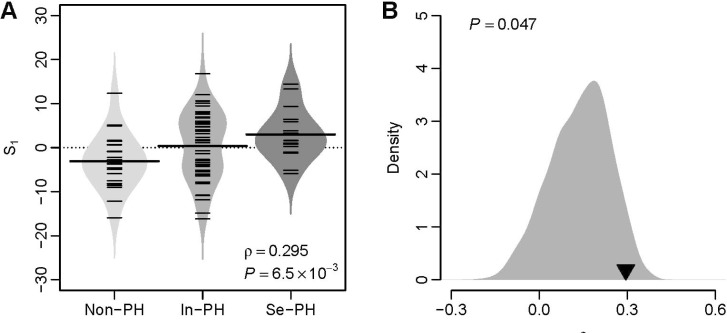
We investigated the predictive power of S1 in a validation dataset from University of Toronto (GEO accession: GSE24988) [21], which includes 22 pulmonary fibrosis patients without secondary PH (mean pulmonary arterial pressure [mPAP]<20 mmHg), 45 pulmonary fibrosis patients with intermediate secondary PH (21 mmHg≤mPAP≤39 mmHg), and 17 pulmonary fibrosis patients with severe secondary PH (mPAP>40 mmHg) (Toronto cohort). We tested the relationship between S1 and PH severity for the patients from the Toronto cohort. A significant and positive correlation between these two quantities (Spearman's rank correlation test: ρ=0.295 and p=6.5×10⁻³) was observed (Fig. 2A), which suggests the predictive power of VIP based S1 for secondary PH severity. A computational study [22] suggests that the majority of published gene signatures are not significantly better than random gene sets of identical size that are randomly selected from human genome. To address this issue in our study, we conducted a resampling test. We obtained 1,000 random gene signatures by randomly selecting 11 genes from human genome (the same size as the VIP signature) and calculated the correlation between S1 and PH severity for each random gene signature. Our alternative hypothesis is that the correlation coefficient of the VIP signatures should be more positive than expected by chance if the predictive power of the VIP is significantly better than the random gene sets. Resampling test indicates that the null hypothesis that the predictive power is by chance could be rejected. The correlation coefficient of the VIP signature is significantly larger than that of the random gene signatures (Right-tailed: p=0.047) (Fig. 2B).
VIP based S2 differentiates patients with IPAH from controls in a validation cohort
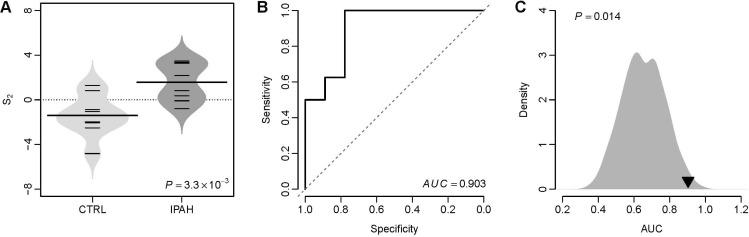
We tested the classification power of S2 in distinguishing IPAH patients from controls in a validation dataset from University of Pittsburgh (GEO accession: GSE48149), which contains 8 controls, 8 patients with IPAH, and 10 systemic sclerosis associated PAH (SSc-PAH) patients (Pittsburgh cohort). The VIP based S2 of IPAH patients was significantly higher than that of controls (t-test: p=3.3×10⁻³) (Fig. 3A). The AUC of S2 was 0.903 in this cohort (Fig. 3B), which suggests a fairly good classification power of the VIP signature in distinguishing IPAH patients from controls. We performed a resampling test following the similar procedures mentioned above. We obtained 1,000 random gene signatures with 11 genes and calculated the AUC for each random gene signature. We found that the AUC of the VIP signature is significantly larger than that of the random gene signatures (Right-tailed: p=0.014) (Fig. 3C).
VIP based S3 differentiates IPAH from SSc-PAH
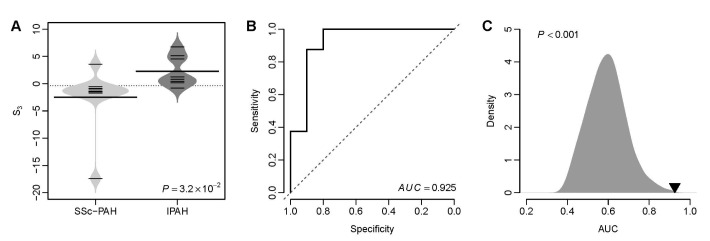
Fig. 1D suggests that the VIP based S3 can be used to distinguish IPAH patients from patients with secondary PH. Here, we tested that whether S3 was able to differentiate IPAH from connective tissue disease associated PAH. We calculated the S3 for the patients with IPAH and SSc-PAH from the Pittsburgh cohort. We found that the VIP based S3 of IPAH patients was significantly higher than that of SSc-PAH patients (t-test: p=3.2×10⁻²) (Fig. 4A). The AUC of S3 was 0.925 (Fig. 4B), which suggests an excellent classification accuracy of the VIP signature in distinguishing IPAH from connective tissue disease associated PAH. Resampling test indicates that the AUC of the VIP signature is significantly larger than that of the random gene signatures (Right-tailed: p<0.001) (Fig. 4C).
DISCUSSION
VDAC1 is one of the major ion channels located on the outer mitochondrial membrane. Regardless of intrinsic complex biological function with differential roles as a calcium transporter or metabolism regulator, we looked into the classification power with the gene sets influenced by VDAC1. Firstly, we confirmed the critical role of VDAC1 in PH pathology by the gene ontology analysis of the VDAC1 influenced genes: several PH-related GO terms are significantly enriched by the VDAC1 influenced genes, such as “blood vessel morphogenesis”, “blood vessel development”, “response to hypoxia”, “oxidation reduction”, and so on (Supplementary Fig. 1). Secondly, we generated the VIP signature based on the VDAC1 influenced genes by filtering through transcriptomic datasets of PAH patients. Thirdly, we validated the VIP signature as a powerful tool to differentiate PAH patients using independent validation cohorts.
A previous study demonstrated that depletion of mitochondrial voltage-dependent anion channel-2 (VDAC2) blocked the agonist-induced increase in eNOS activity in human pulmonary artery endothelial cells [8], which may contribute to the limited eNOS activity that characterizes PH [8]. In this study, we found that the eNOS (gene symbol: Nos3) gene expression was significantly attenuated in the Vdac1 KO MEFs (Supplementary Fig. S3), which suggests that VDAC1 may play a protective role in cardiovascular system and diminished VDAC1 may constrain eNOS activity in lung vascular endothelium and thus lead to PH. In contrast, a significant upregulation of hypoxia-inducible factors, Hif-1α (gene symbol: Hif1a) and Hif-2α (gene symbol: Epas1) in the Vdac1 KO MEFs (Supplementary Fig. S3). Hypoxia-inducible factors are major transcription factors in response to lower oxygen level in the cellular environment. In our current study we have used MEF as a cell type which we feel is important to both PAH and PH secondary to pulmonary fibrosis. It is clear that fibroblasts play an important role early in the development of pulmonary arterial hypertension [11]. Many suggest that this is the first cell line to respond to a hypoxic environment [2324]. Fibroblast activation, resulting in synthesis of collagen and extracellular matrix, is also a hallmark of idiopathic pulmonary fibrosis [25]. Dense fibrosis in IPF leads to destruction of the capillary bed and increased pulmonary vascular resistance as well as release of vasoactive mediators leading to vascular remodeling [26]. Upregulated HIF-1α in pulmonary vasculature has been implicated in the development and progression of PH and rapid accumulation of HIF-1α has been reported in PASMC to increase intracellular calcium [Ca2+]i as the common pathway leading to pulmonary vascular remodeling [27]. Heterozygous deficiency of Hif-1α or Hif-2α could significantly impair physiological responses to hypoxia and protect mice against PH [2829]. Therefore, the increased expression of Hif-1α and Hif-2α in VDAC1 deficient cells confirms the protective function of VDAC1 in PH. However, further studies are required to understand the exact protective mechanism of VDAC1 in PH.
Based on the VDAC1 influenced genes, we developed the VIP signature, which was composed of 11 protein-coding genes (Table 1). The VIP signature efficiently predicts severity of PH secondary to pulmonary fibrosis (Fig. 2), identifies IPAH patients from controls (Fig. 3), and differentiates IPAH from connective tissue disease associated PAH (Fig. 4). Among the VIP gene list, FLT1 and IGF1 are among the top genes that have been heavily documented for their active roles in PH pathology. The protein of FLT1, known as vascular endothelial growth factor receptor 1 (VEGFR-1), is a signaling protein involved in the regulation of angiogenesis and vasculogenesis. Aberrant expression of VEGFR-1 has been found in mice, rats, and piglets under chronic hypoxia [303132] and human PH patients [33]. The protein encoded by IGF1, insulin like growth factor 1 (IGF-I), is a member of a family of proteins involved in mediating growth and development. IGF-I has been proposed as one of the mediators of vascular change due to its role in stimulation of proliferation in cultured vascular smooth muscle cells [34]. It was found in neonatal mice that smooth muscle cell-specific deletion of IGF-1 attenuated hypoxia-induced pulmonary vascular remodeling, right ventricular hypertrophy, and right ventricular systolic pressure [35]. In addition, differential methylation was identified in IGF1 promoter region in response to neonatal hypoxia, which suggests that epigenetic regulation of IGF1 may be involved in the pathogenesis of PH [36]. The gene PTGS2 within the VIP gene list, encoding cyclooxygenase 2 (COX-2), is also implicated in PH. Inhibition of COX-2 may exacerbate hypoxic PH and enhance contractility of vascular smooth muscle cells [37], which suggests that COX-2 potentially plays a protective role in the lung's response to hypoxia [38].
In summary, we have demonstrated that intensive examination of transcriptomic data with novel translational approaches may help us gain new insight into the pathobiology of PH. Transcriptomic analysis strongly suggests the protective role of VDAC1 in PH despite unclear molecular mechanism.
 XML Download