Abstract
Objectives
To investigate the reliability of the lumbar extensor muscle degeneration classification as an indicator of potential risk for osteoporotic vertebral compression fractures (OVCF).
Summary of Literature Review
Fatty degeneration of lumbar extensor muscles has attracted increased interest in the literature as a risk factor for OVCF.
Materials and Methods
Ninety-one patients with OVCF (group 1) and 60 patients without OVCF (group 2) were investigated. Magnetic resonance imaging was used to measure and to analyze the muscle mass and fatty degeneration of the lumbar extensor muscle. The degree of fatty degeneration of the lumbar extensor muscle was classified into 4 stages: less than 10%, 10%-25%, 25%-50%, and more than 50%.
Results
Fatty degeneration of the lumbar extensor muscle and the bone mineral density T-score were 29.66%±12.28% and −3.56±1.13 in group 1 and 24.04%±13.29% and −2.27±1.46 in group 2, which were statistically significant differences (p<0.05). Logistic regression analysis revealed that as the fatty degeneration of the lumbar extensor muscle increased, the risk of OVCF increased (odds ratio [OR]=1.21; p=0.01). The risk of OVCF increased as the lumbar extensor muscle degeneration classification scores increased (OR=13.53; p=0.02). Furthermore, as the muscle mass of the multifidus decreased, lumbar lordosis and sacral inclination decreased (β=0.33; p=0.01 and β =0.25; p=0.04, respectively). However, no factor affected thoracic kyphosis.
REFERENCES
1. Kanis JA, McCloskey EV, Johansson H, et al. A reference standard for the description of osteoporosis. Bone. 2008 Mar; 42(3):467–75. DOI: 10.1016/j.bone.2007.11.001.

2. Hida T, Shimokata H, Sakai Y, et al. Sarcopenia and sar-copenic leg as potential risk factors for acute osteoporotic vertebral fracture among older women. Eur Spine J. 2016 Nov; 25(11):3424–31. DOI: 10.1007/s00586-015-3805-5.

3. Kim DH, Choi DH, Park JH, et al. What is the effect of spinopelvic sagittal parameters and back muscles on osteoporotic vertebral fracture? Asian Spine J. 2015 Apr; 9(2):162–9. DOI: 10.4184/asj.2015.9.2.162.

4. Chen LK, Liu LK, Woo J, et al. Sarcopenia in Asia: consensus report of the Asian Working Group for Sarcopenia. J Am Med Dir Assoc. 2014 Feb; 15(2):95–101. DOI: 10.1016/j.jamda.2013.11.025.

5. Go SW, Cha YH, Lee JA, et al. Association between sarcopenia, bone density and health-Related Quality of life in Korean men. Korean J Fam Med. 2013 Jul; 34(4):281–8. DOI: 10.4082/kjfm.2013.34.4.281.

6. Verschueren S1, Gielen E, O'Neill TW, et al. Sarcopenia and its relationship with bone mineral density in middle-aged and elderly European men. Osteoporos Int. 2013 Jan; 24(1):87–98. DOI: 10.1007/s00198-012-2057-z.

7. Miyakoshi N1, Hongo M, Mizutani Y, et al. Prevalence of sarcopenia in Japanese women with osteopenia and osteoporosis. J Bone Miner Metab. 2013 Sep; 31(5):556–61. DOI: 10.1007/s00774-013-0443-z.

8. Lee JC, Cha JG, Kim Y, et al. Quantitative analysis of back muscle degeneration in the patients with the degenerative lumbar flat back using a digital image analysis: comparison with the normal controls. Spine (Phila Pa 1976). 2008 Feb 1; 33(3):318–25. DOI: 10.1097/BRS.0b013e318162458f.
9. Goutallier D, Postel JM, Gleyze P, et al. Influence of cuff muscle fatty degeneration on anatomic and functional outcomes after simple suture of full-thickness tears. J Shoulder Elbow Surg. 2003 Nov-Dec; 12(6):550–4. DOI: 10.1016/S1058274603002118.

10. Kalichman L, Klindukhov A, Li L, et al. Indices of Paraspinal Muscles Degeneration: Reliability and Association With Facet Joint Osteoarthritis: Feasibility Study. Clin Spine Surg. 2016 Nov; 29(9):465–70. DOI: 10.1097/BSD.0b013e31828be943.
11. Felsenberg D, Silman AJ, Lunt M, et al. Incidence of vertebral fracture in europe: results from the European Prospective Osteoporosis Study (EPOS). J Bone Miner Res. 2002 Apr; 17(4):716–24. DOI: 10.1359/jbmr.2002.17.4.716.

12. Joo SU, Cho JH. Basic pelvic parameters associated with lumbar degenerative desease. J Korean Soc Spine Surg. 2016 Dec; 23(4):239–45. DOI: 10.4184/jkss.2016.23.4.239.
13. Sinaki M, Itoi E, Wahner HW, et al. Stronger back muscles reduce the incidence of vertebral fractures: a prospective 10 year follow-up of postmenopausal women. Bone. 2002 Jun; 30(6):836–41. DOI: 10.1016/s8756-3282 (02)00739-1.

14. Kay AG. An extensive literature review of the lumbar multifidus: anatomy. J Man ManipTher. 2008; 8(3):102–14. DOI: 10.1179/jmt.2000.8.3.102.

15. Park SI, Lee WY, Kim HS, et al. Quantitative correlations of trunk muscles in young and middle-aged men with chronic low back pain by magnetic resonance imaging. J Korean Acad Rehab Med. 2007 Feb; 31(1):1–6.
16. Hides JA, Cooper DH, Stokes MJ. Diagnostic ultrasound imaging for measurement of the lumbar multifidus muscle in normal young adults. Physiother Theory Pract. 1992 Jan; 8(1):19–26. DOI: 10.3109/09593989209108076.

17. Fechtenbaum J, Etcheto A, Kolta S, et al. Sagittal balance of the spine in patients with osteoporotic vertebral fractures. Osteoporos Int. 2016 Feb; 27(2):559–67. DOI: 10.1007/s00198-015-3283-y.

18. Reid JG, Costigan PA. Trunk muscle balance and muscular force. Spine (Phila Pa 1976). 1987 Oct; 12(8):783–6. DOI: 10.1097/00007632-198710000-00013.
19. McLoughlin RF, D'Arcy EM, Brittain MM, et al. The significance of fat and muscle areas in the lumbar paraspinal space: a CT study. J Comput Assist Tomogr. 1994 Mar-Apr; 18(2):275–8. DOI: 10.1097/00004728-199403000-00021.
20. Parkkola R, Rytokoski U, Kormano M. Magnetic resonance imaging of the discs and trunk muscles in patients with chronic low back pain and healthy control subjects. Spine (Phila Pa 1976). 1993 Jun 1; 18(7):830–6. DOI: 10.1097/00007632-199306000-00004.

21. Sinaki M, Nwaogwugwu NC, Phillips BE, et al. Effect of gender, age, and anthropometry on axial and appendicular muscle strength. Am J Phys Med Rehabil. 2001 May; 80(5):330–8. DOI: 10.1097/00002060-200105000-00002.

22. During J, Goudfrooij H, Keessen W, et al. Toward standards for posture. Postural characteristics of the lower back system in normal and pathologic conditions. Spine(Phila Pa 1976). 1985 Jan-Feb; 10(1):83–7. DOI: 10.1097/00007632-198501000-00013.
23. Chae SU, Shin DM, Kim TK, et al. The relation of paraspinal muscles and degenerative lumbar spondylolisthesis. J Korean Orthop Res Soc. 2012 Jun; 15(1):39–45.
24. Takeda N, Kobayashi T, Atsuta Y, et al. Changes in the sagittal spinal alignment of the elderly without vertebral fractures: a minimum 10-year longitudinal study. J Orthop Sci. 2009 Nov; 14(6):748–53. DOI: 10.1007/s00776-009-1394-z.

Fig. 1.
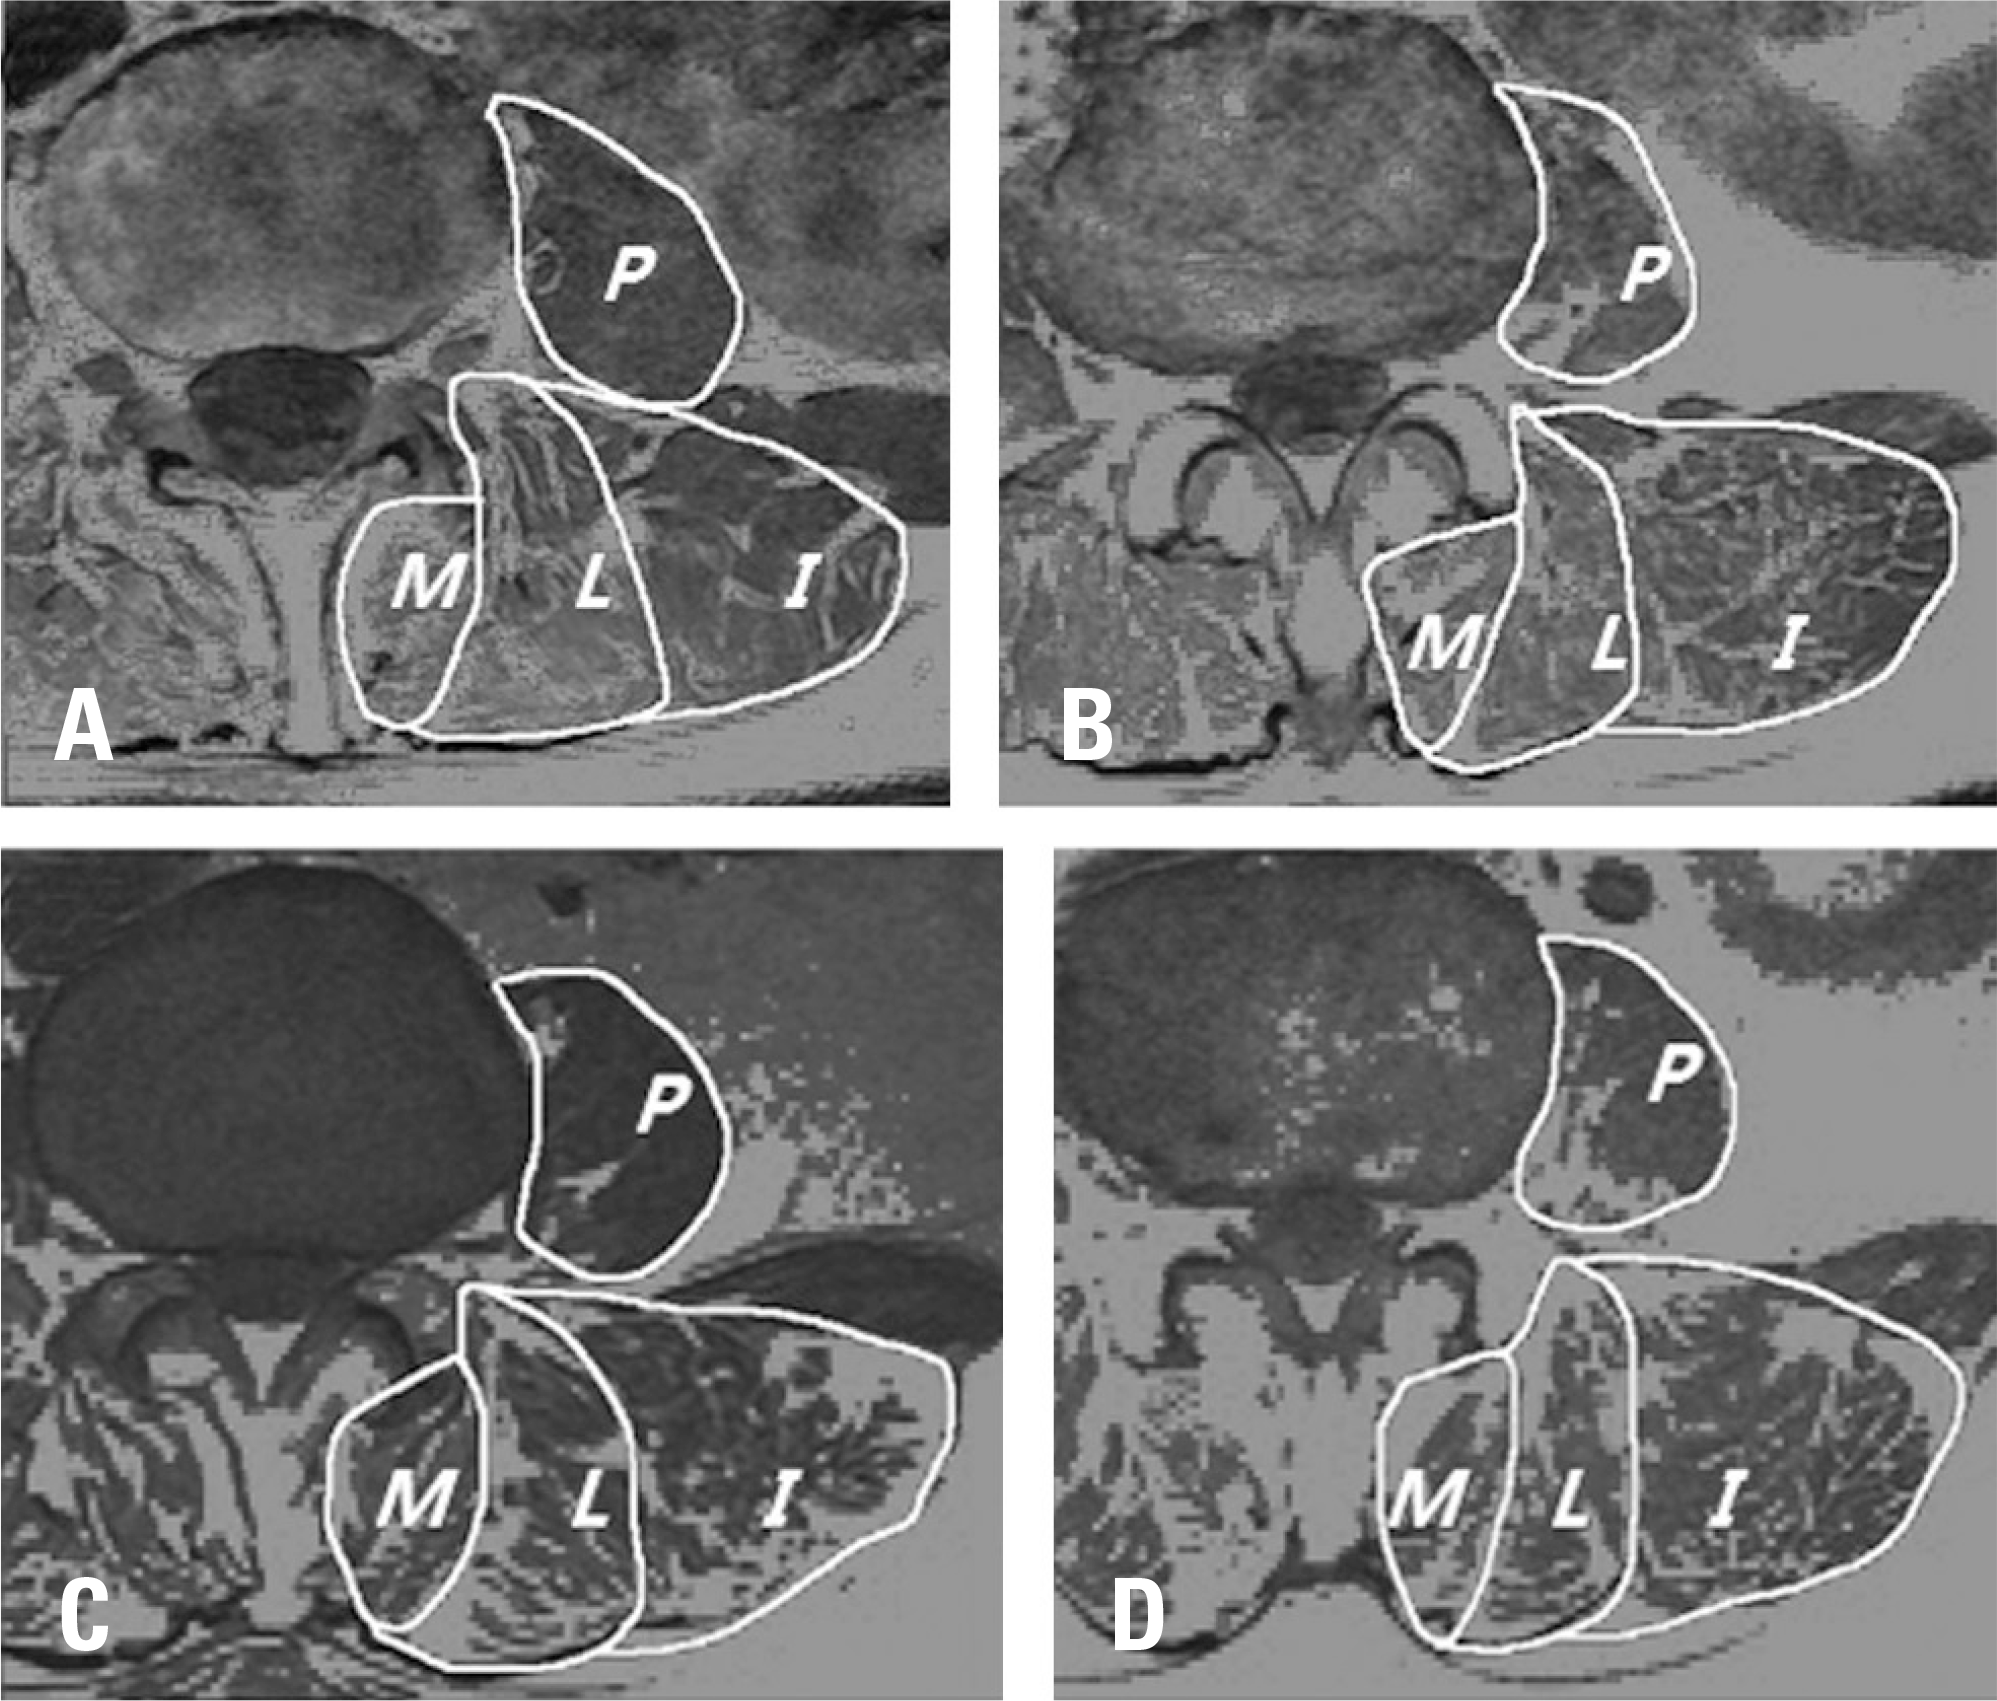
Paralumbar muscle mass and fatty degeneration on a T1 axial section of magnetic resonance imaging at the L3 level. M, multifidus; L, longissimus; I, iliocostalis; P, psoas. (A) Multifidus fatty degeneration (MF): 7.5%, longissimus fatty degeneration (LF): 12.3%, iliocostalis fatty degeneration (IF): 6.7%, mean extensor muscle fatty degeneration (EF): 8.8%, lumbar extensor muscle fatty degeneration classification: stage 1. (B) MF: 18.5%, LF: 17.1%, IF: 10.9%, mean EF: 15.5%: stage 2. (C) MF: 53.7%, LF:41.8%, IF: 30.3%. mean EF: 41.9%: stage 3. (D) MF: 47.2%, LF: 52.4%, IF: 69.4%, mean EF: 56.3%: stage 4.

Fig. 2.
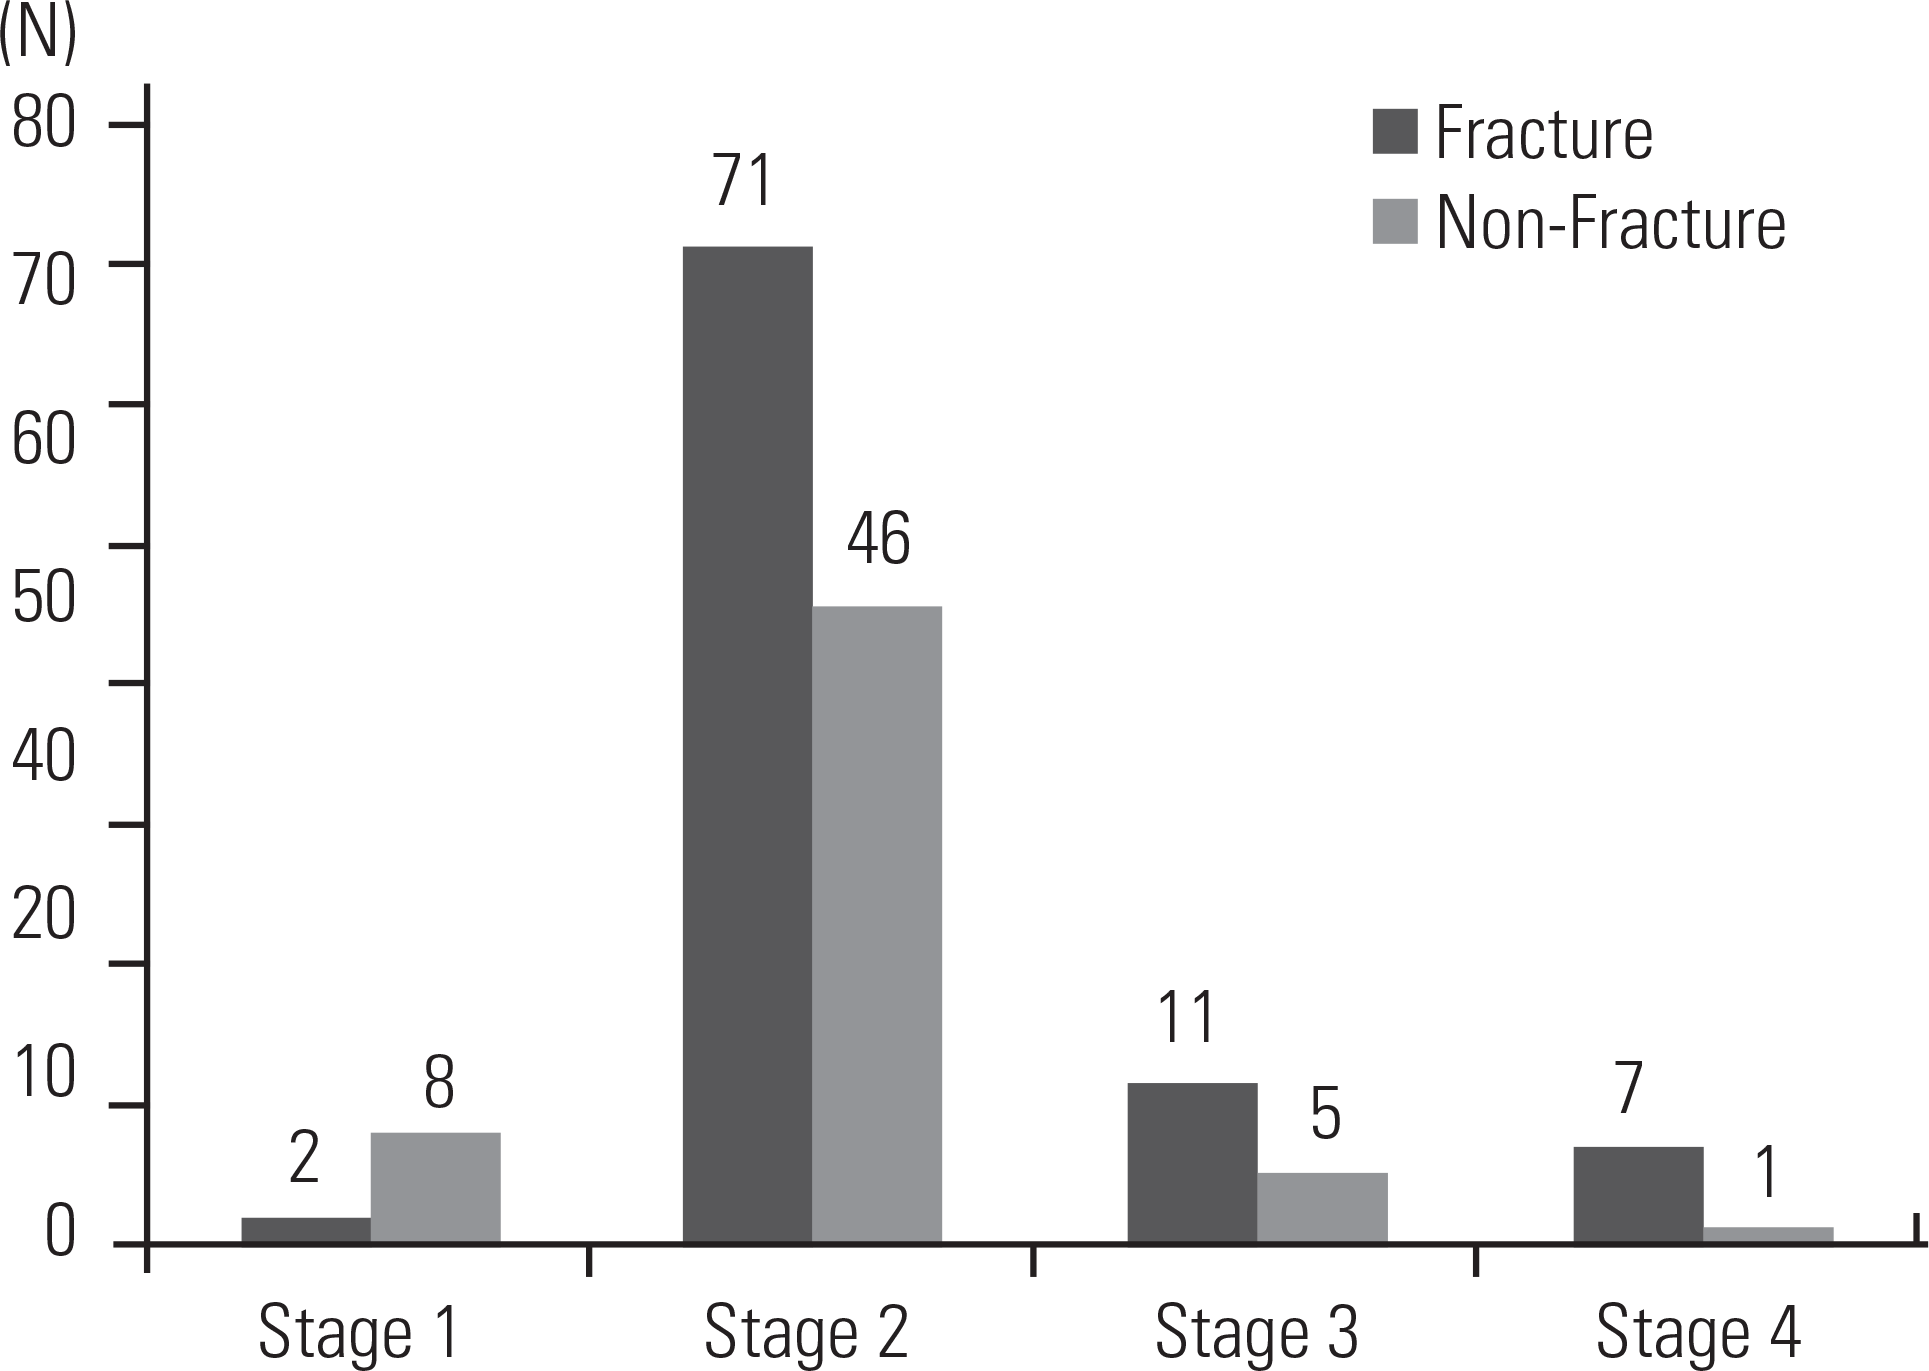
Distribution of the fatty degeneration classification of the paralumbar extensor muscle between patients with and without osteoporotic vertebral compression fractures.

Fig. 3.
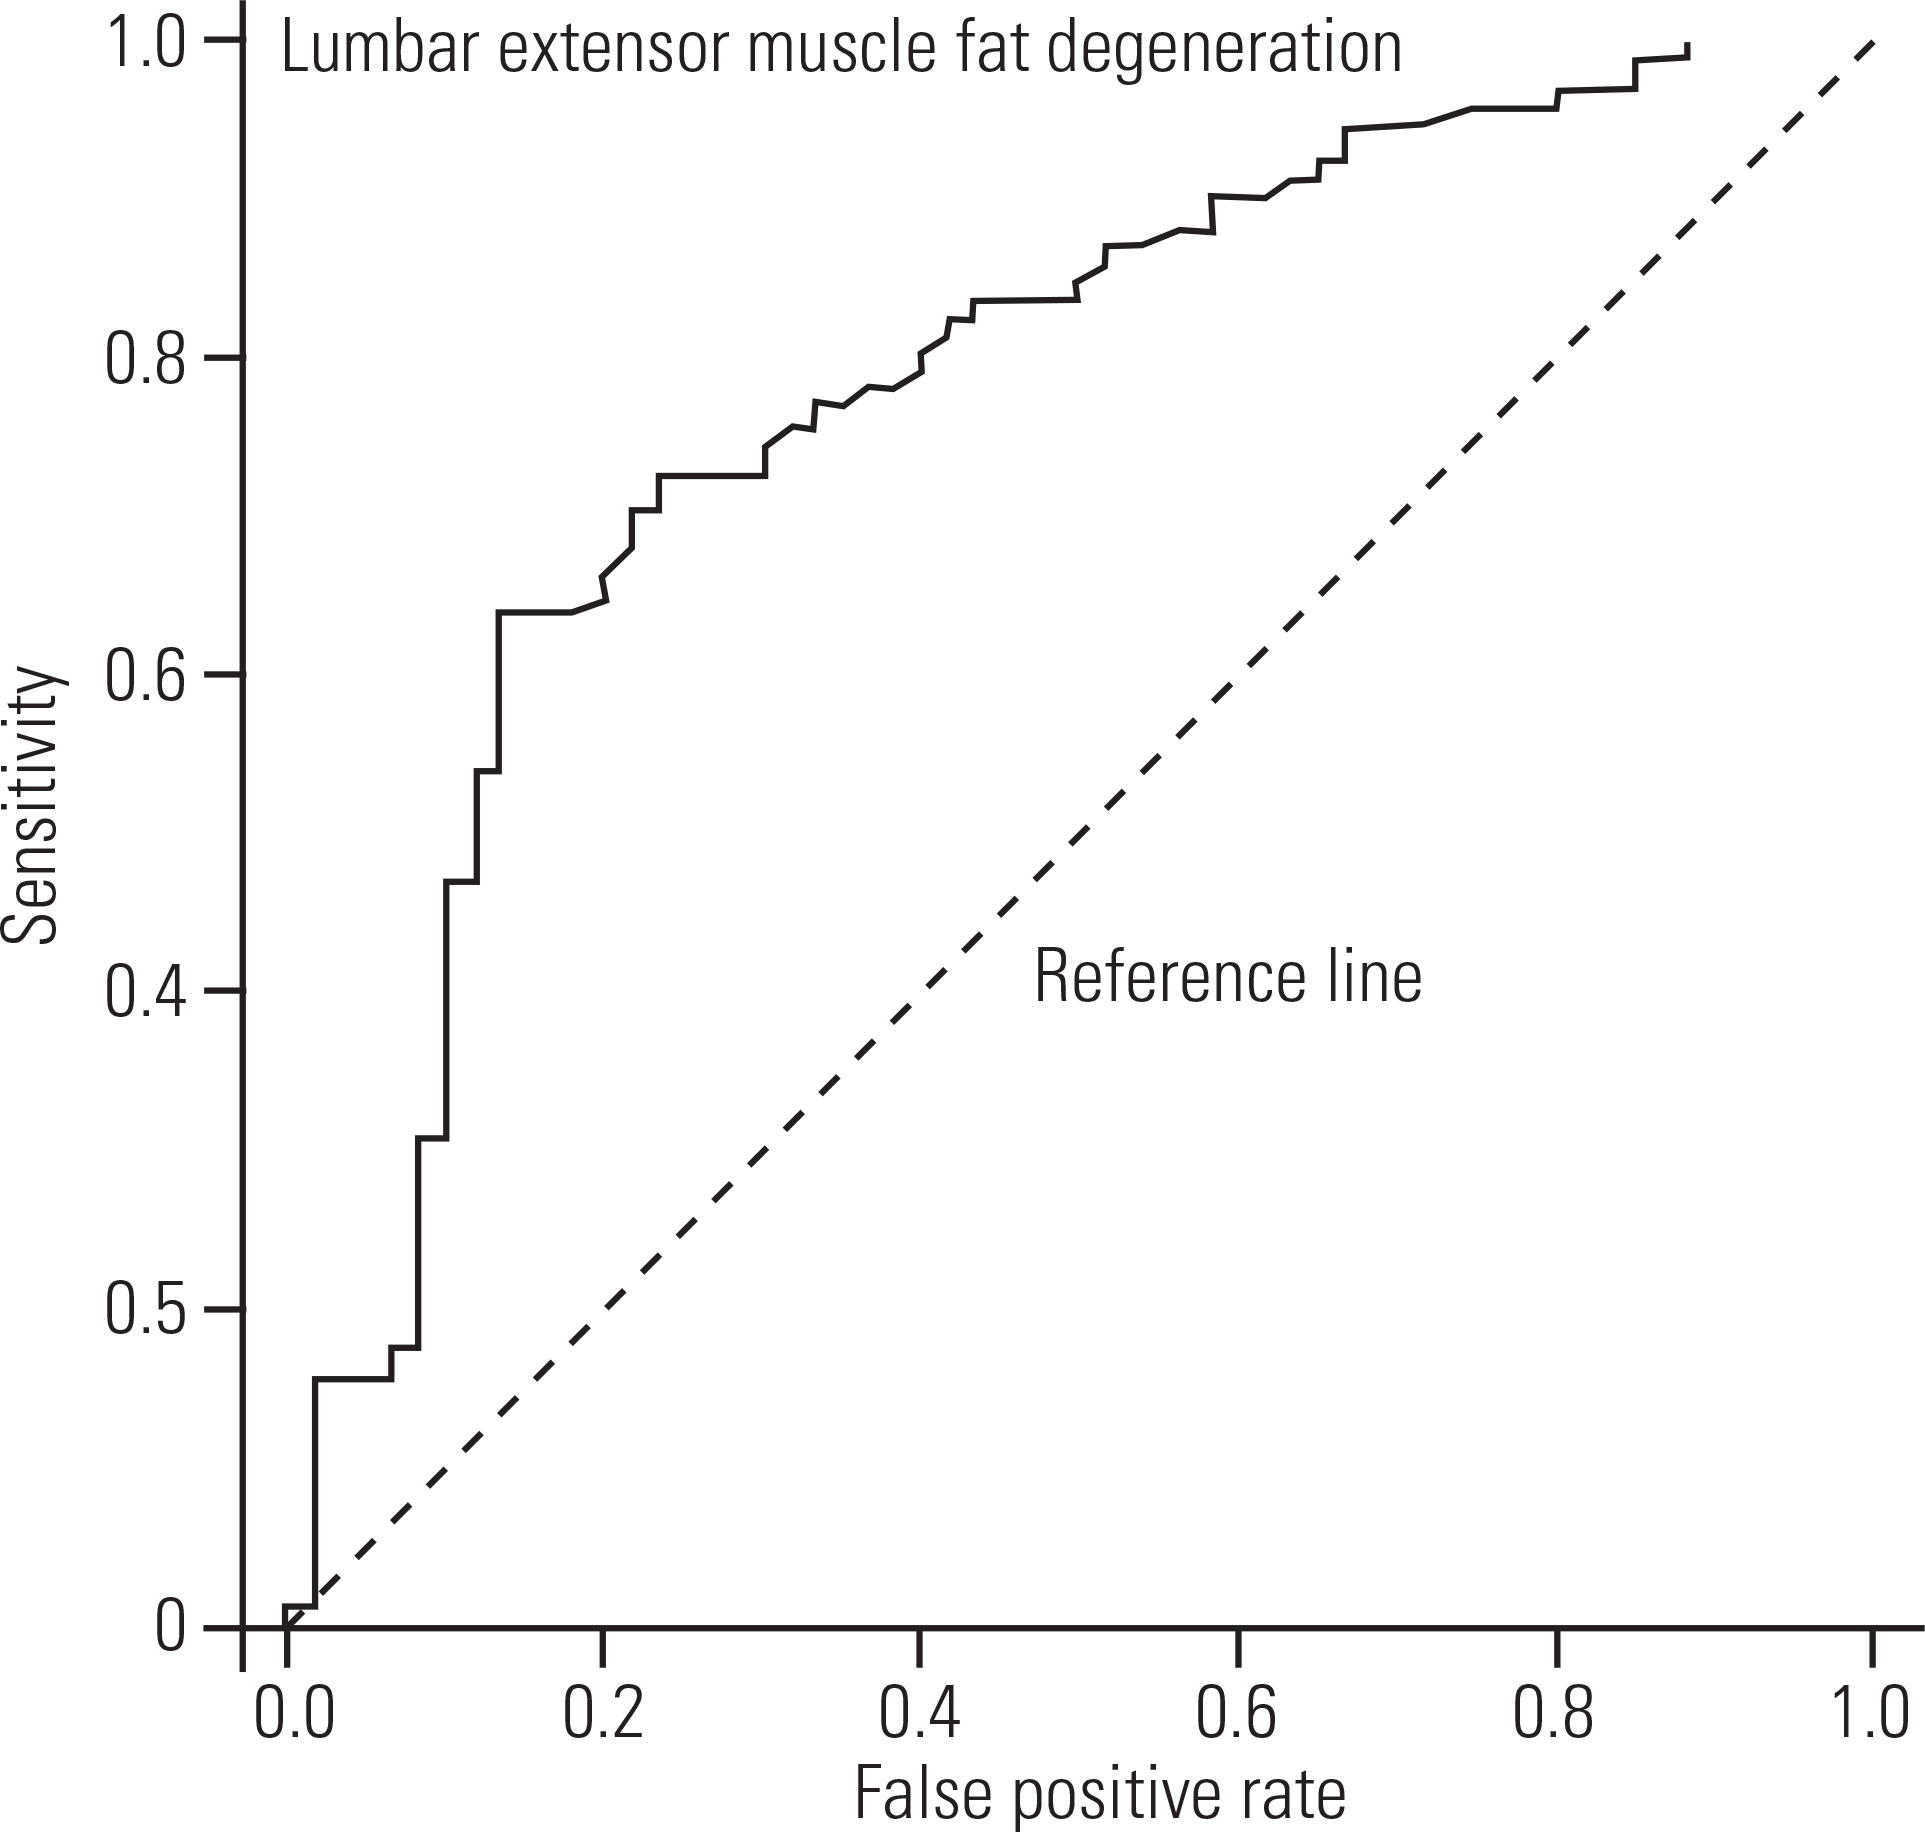
Receiver operating characteristic curve of fatty degeneration of the lumbar extensor muscle and osteoporotic vertebral compression fracture; the cut-off value of fatty degeneration as a predictor of osteoporotic vertebral compression fracture was 24.6% (sensitivity: 0.73, specificity: 0.75).

Table 1.
Lumbar extensor muscle mass & fat degeneration
Table 2.
Univariate logistic regression analysis for osteoporotic vertebral compression fracture
| B∗ | OR | 95% CI | p-value | |
|---|---|---|---|---|
| Age (yr) | −0.02 | 0.98 | 0.87-1.07 | 0.68 |
| BMD (T-score) | −1.07 | 0.58 | 0.17-0.67 | 0.01 |
| Lumbar extensor muscle fat degeneration (%) | 0.01 | 1.21 | 1.00-1.01 | 0.01 |
| Lumbar extensor muscle fat degeneration classification (Stage) | 0.17 | 13.53 | 1.06-1.33 | 0.02 |


 PDF
PDF Citation
 Print
Print


 XML Download